

Deployment Diagrams: Nodes, Artifacts, Execution Environments and a Docker/Azure Topology
A deployment diagram shows which nodes and execution environments the software runs on, which artifact is placed where, and over which protocol and port the nodes talk. In this post we draw the HR Portal's docker compose development environment and its Azure production topology, and build the «manifest» bridge between artifacts and components.
Version note: The diagrams in this post use UML (Unified Modeling Language) 2.5.1 notation; the publish output was produced with the .NET 10 SDK (software development kit) and the compose file was validated with Docker Compose v5.1.0.
Guess First: Which Ports Will Ops Open?
The HR (human resources) Portal is going to production for the first time. Linus from the ops team asks three questions: "How many instances of the API (Application Programming Interface) will run, which machine talks to which service on which port, and who connects to the calendar system?" The only documentation the team has is the compose file the developers use every day:
name: hrportal-dev

services:
  api:
    build:
      context: .
      dockerfile: src/HrPortal.Api/Dockerfile
    image: hrportal-api:dev
    ports:
      - "8080:8080"
    environment:
      ASPNETCORE_ENVIRONMENT: Development
      ConnectionStrings__HrPortal: "Server=sqlserver;Database=HrPortal;User Id=sa;Password=${MSSQL_SA_PASSWORD};TrustServerCertificate=true"
      ConnectionStrings__Redis: "redis:6379"
      ConnectionStrings__ServiceBus: "Endpoint=sb://servicebus;SharedAccessKeyName=RootManageSharedAccessKey;SharedAccessKey=SAS_KEY_VALUE;UseDevelopmentEmulator=true;"
    depends_on: [sqlserver, redis, servicebus]

  worker:
    build:
      context: .
      dockerfile: src/HrPortal.Worker/Dockerfile
    image: hrportal-worker:dev
    environment:
      ConnectionStrings__HrPortal: "Server=sqlserver;Database=HrPortal;User Id=sa;Password=${MSSQL_SA_PASSWORD};TrustServerCertificate=true"
      ConnectionStrings__ServiceBus: "Endpoint=sb://servicebus;SharedAccessKeyName=RootManageSharedAccessKey;SharedAccessKey=SAS_KEY_VALUE;UseDevelopmentEmulator=true;"
    depends_on: [sqlserver, servicebus]

  sqlserver:
    image: mcr.microsoft.com/mssql/server:2025-latest
    environment:
      ACCEPT_EULA: "Y"
      MSSQL_SA_PASSWORD: "${MSSQL_SA_PASSWORD}"
    ports:
      - "1433:1433"

  redis:
    image: redis:7-alpine

  servicebus:
    image: mcr.microsoft.com/azure-messaging/servicebus-emulator:latest
    volumes:
      - "./servicebus-config.json:/ServiceBus_Emulator/ConfigFiles/Config.json"
    environment:
      SQL_SERVER: sqlserver
      MSSQL_SA_PASSWORD: "${MSSQL_SA_PASSWORD}"
      ACCEPT_EULA: "Y"
    depends_on: [sqlserver]
If you drew a diagram from this file, how many boxes and lines would it have? Which values stay the same in production, and which change completely? And how many of Linus's three questions are actually answered in this file?
What Question Does a Deployment Diagram Answer?
The file is valid; docker compose config --services lists five services:
sqlserver
servicebus
worker
redis
api
But only one of Linus's questions, and only partly, is answered here: the ports of the development environment. In production SQL (Structured Query Language) Server is not a container but a managed database service. Redis talks on port 10000 with TLS (Transport Layer Security), not on 6379. Instead of the Service Bus emulator there is a real namespace, and the API runs between two and five replicas. The compose file describes a development environment, not the production topology.
A deployment diagram fills exactly that gap: it shows where the software physically runs, which files are placed into which runtime environment, and over which protocol those environments are connected. Chapter 19 (Deployments) of the UML 2.5.1 specification defines the elements of this diagram. The component diagram in the previous post answered "which module is wired to which contract?"; a deployment diagram answers "which box does each module run in, and how do the boxes talk?". Not mixing the two starts with accepting that two separate questions deserve two separate diagrams.
Deployment diagrams come in two levels. A type-level diagram shows kinds, like "an API container, a database", and is the form used most in architecture documentation. An instance-level diagram shows real instances: names are underlined (api-replica-1 : ContainerApp) and it is used in an incident analysis to answer "which replica, which zone?".
Notation: Nodes, Devices and Execution Environments
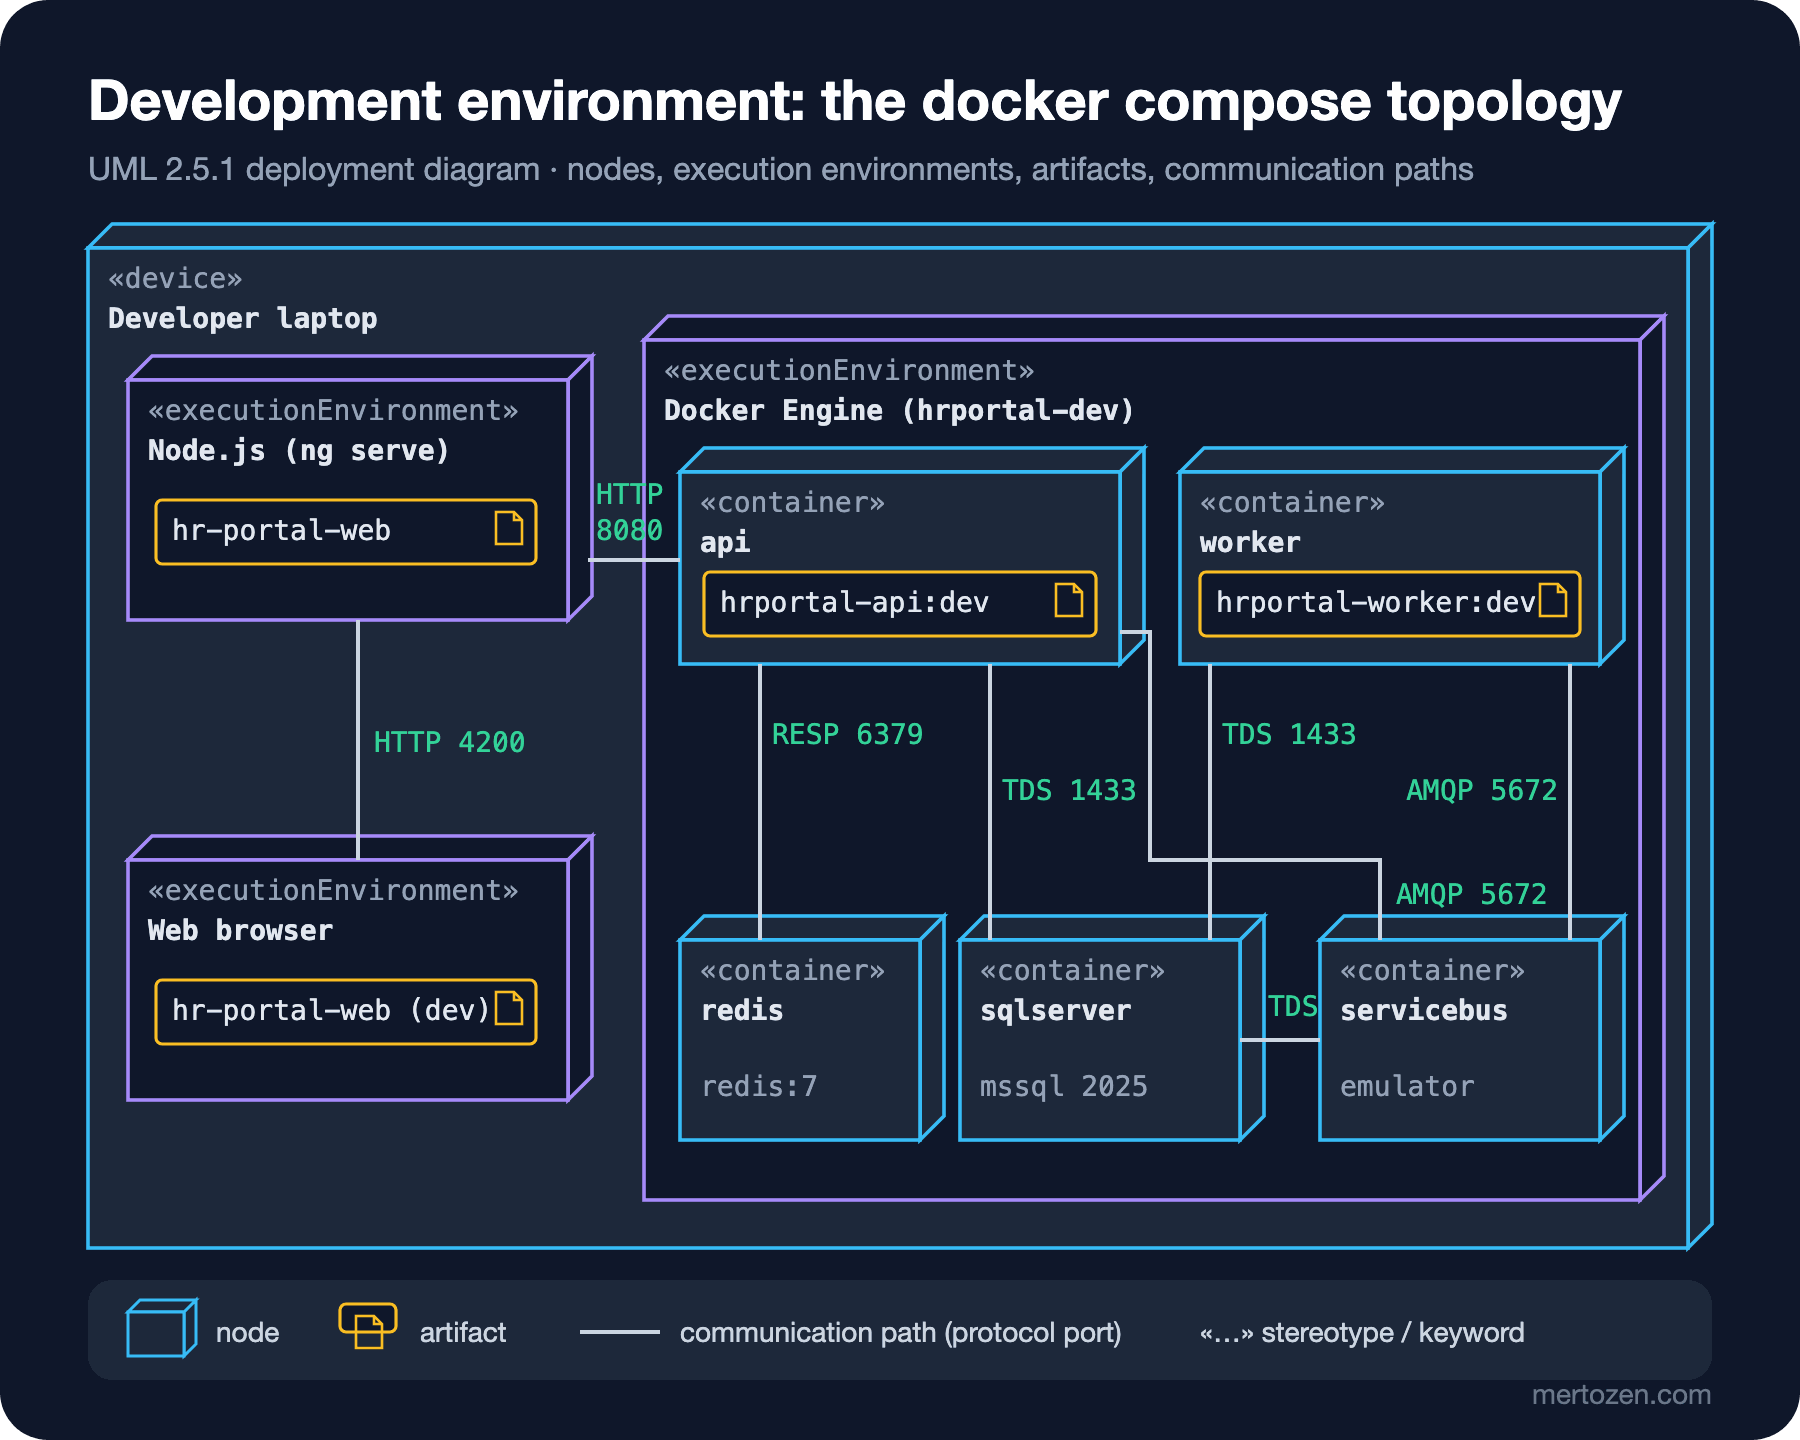
A node is drawn as a three-dimensional box and stands for a computational resource on which software can run. UML defines two special kinds. A «device» is physical hardware: a developer's laptop, a server, a phone. An «executionEnvironment» is a software environment running inside a node that accepts artifacts into itself: Docker Engine, the Node.js runtime, a browser, the .NET runtime, a database engine. Nodes can be nested; in the figure the laptop contains Docker Engine, and Docker Engine contains five containers.
Labels like «container», «cdn» and «PaaS» are not standard UML keywords but user-defined stereotypes. UML allows this, and it is common practice in the industry. The rule is to say what they mean in the diagram's legend or title. A Docker container is technically an execution environment into which files from an image are placed; the «container» stereotype just makes that easier to read.
Artifacts, «manifest» and Deployment
An artifact is the concrete unit of deployment: a file or a package of files. It is drawn with a document icon whose top right corner is folded, or with the «artifact» keyword. UML's standard profile also offers subtypes such as «executable», «library», «script» and «file». When we publish the modules from the previous post, these are the artifacts that come out:
HrPortal.Api.dll
HrPortal.CalendarIntegration.dll
HrPortal.Leave.Contracts.dll
HrPortal.Leave.dll
HrPortal.Notification.Contracts.dll
HrPortal.Notification.dll
HrPortal.Payroll.dll
Each DLL (dynamic-link library) is the physical counterpart of a component. UML draws that relationship as a dashed arrow labeled «manifest» from the artifact to the component: "HrPortal.Leave.dll manifests the Leave component". Artifacts can also be nested. A container image is an outer artifact that carries these DLLs. The source we rendered with PlantUML 1.2026.9:
@startuml hr-portal-manifest
artifact "hrportal-api:1.4.0" <<image>> as Image {
  artifact "HrPortal.Api.dll" as ApiDll
  artifact "HrPortal.Leave.dll" as LeaveDll
  artifact "HrPortal.Payroll.dll" as PayrollDll
}
component "Api" as Api
component "Leave" as Leave
component "Payroll" as Payroll
ApiDll ..> Api : <<manifest>>
LeaveDll ..> Leave : <<manifest>>
PayrollDll ..> Payroll : <<manifest>>
@enduml
This small diagram is the bridge between the component diagram and the deployment diagram. The logical module (component) turns into a file (artifact), and the file is placed onto a node. There are two ways to write that placement: draw the artifact inside the node box, or draw a dashed arrow labeled «deploy» from the artifact to the node. Both mean the same; in crowded diagrams nesting is easier to read.
There is also the deployment specification: an artifact with the «deployment spec» keyword. It carries how a deployment is configured and is attached to the deployment with a dashed line. In .NET its most familiar example is appsettings.Production.json together with the environment variables on the container platform. Replica counts, the environment name and Key Vault references live there, and they are what make the same image behave differently in different environments.
Communication Paths and Protocol Labels
The plain line between nodes is a communication path: a connection over which two nodes can exchange messages. In UML it is an association, so no arrowhead is drawn; if you need direction, you look at a sequence diagram. In practice, writing the protocol and port on the line is the single most important detail that makes the diagram readable for ops. The labels in the figure: HTTP (Hypertext Transfer Protocol) 4200 and 8080, SQL Server's protocol TDS (Tabular Data Stream) 1433, Redis's RESP (REdis Serialization Protocol) 6379 and Service Bus's AMQP (Advanced Message Queuing Protocol) 5672.
None of these paths uses TLS in the development environment. The emulator only supports unencrypted AMQP over TCP (Transmission Control Protocol). SQL Server is reached with TrustServerCertificate=true. Writing these onto the diagram is the cheapest way to put "is it like this in production too?" on the table. Also notice the small line between servicebus and sqlserver: the Service Bus emulator keeps its state in SQL Server. Someone reading the depends_on line in the compose file can miss that; someone reading the diagram cannot.
The Development Environment: Turning docker compose into a Diagram
The figure above is a direct translation of the compose file from the opening. Each service is a «container» node. The image line is the artifact placed into the container. The host and port in the ConnectionStrings__* values are the labels of the communication paths. We added two things that are not in the file: that the Angular application runs on Node.js with ng serve, and that the browser connects to it on 4200. The compose file only knows its own containers; the diagram tells how the developer actually works.
The translation also catches inconsistencies. While drawing, we noticed that worker does not connect to Redis. The reminder job reads pending requests directly from the database and needs no cache. Is that a deliberate decision or a forgotten configuration? The question came out of the diagram without opening the code.
The Production Topology: Azure
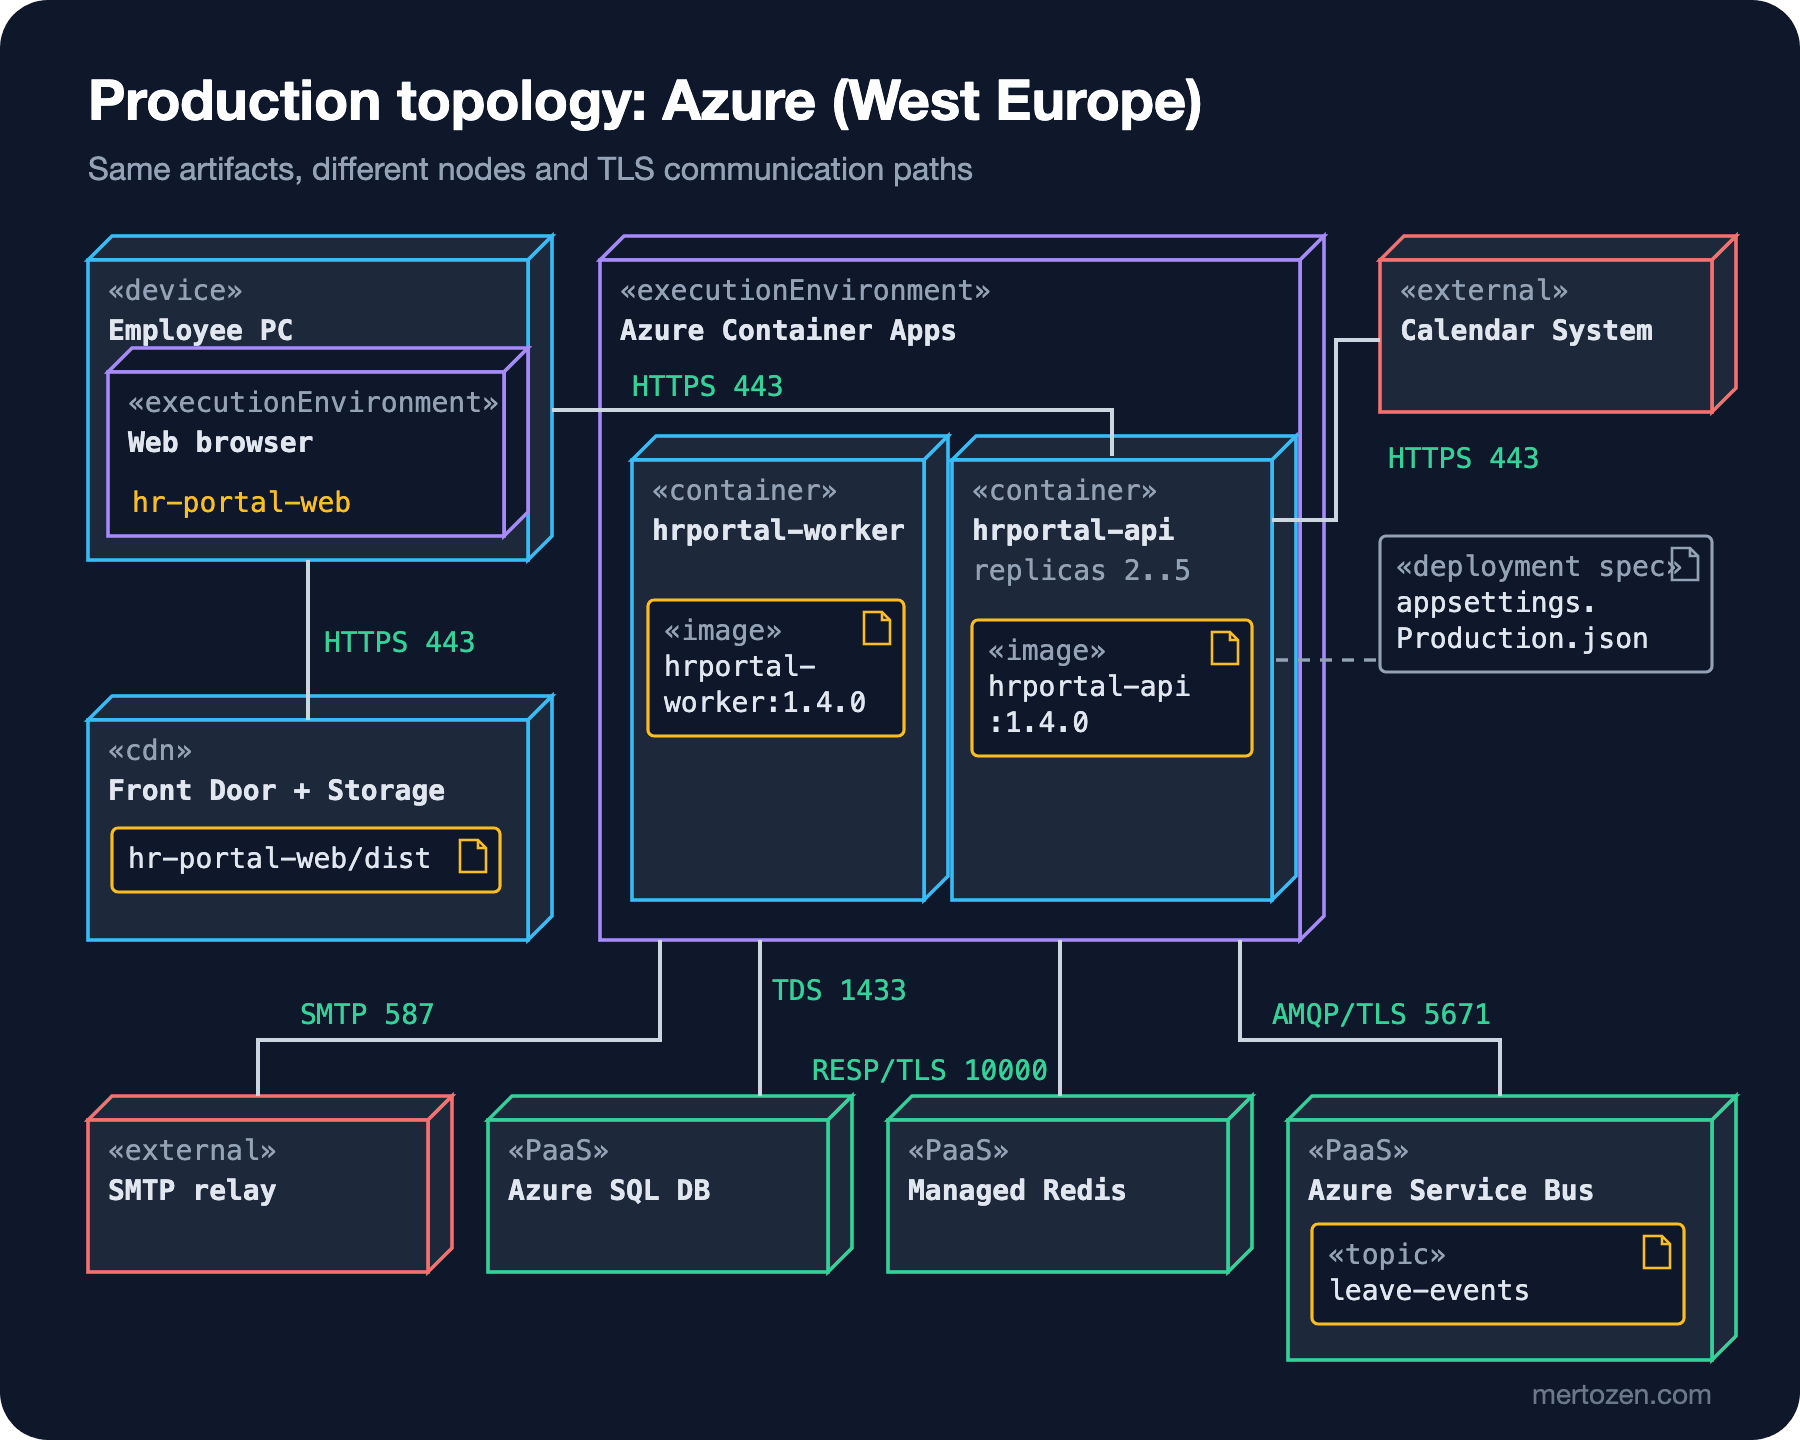
In production the same artifacts land on very different nodes. The Angular build output (hr-portal-web/dist) is served from a Storage account behind Azure Front Door, i.e. through a CDN (content delivery network), and runs in the employee's browser. API and worker are two separate container apps in the same Azure Container Apps environment. Because the environment is a boundary that shares networking and logs, we drew it as an enclosing execution environment. The API's replica count is between 2 and 5, the worker's is fixed. The fact is in the diagram, the value is in the deployment spec.
The three nodes on the data side are managed services: Azure SQL Database, Azure Managed Redis and Azure Service Bus. We marked them with the «PaaS» (Platform as a Service) stereotype, because the critical fact for ops is "we do not manage this machine". The Redis choice carries a time-sensitive detail: Microsoft has announced that the Basic, Standard and Premium tiers of Azure Cache for Redis retire on September 30, 2028, and since April 1, 2026 new customers cannot create caches in those tiers. The target for new installations is Azure Managed Redis, which uses port 10000 and TLS by default. That is why the RESP/TLS 10000 label in the diagram differs from RESP 6379 in development.
For readability we drew the paths to the data services from the Container Apps environment rather than from each container. Which container connects to which service is in the PlantUML source below and in the previous figure. Simplifications like this are legitimate, as long as the diagram's title or a note says so. The diagrams-as-code counterpart of the same model (rendered with PlantUML 1.2026.9):
@startuml hr-portal-production
title HR Portal - production deployment (Azure, West Europe)

node "Employee PC" <<device>> {
  node "Web browser" <<executionEnvironment>> as Browser {
    artifact "hr-portal-web" as SpaBundle
  }
}
node "Front Door + Storage" <<cdn>> as Cdn {
  artifact "hr-portal-web/dist" as SpaDist
}
node "Azure Container Apps" <<executionEnvironment>> as Aca {
  node "hrportal-api (replicas 2..5)" <<container>> as Api {
    artifact "hrportal-api:1.4.0" <<image>> as ApiImage
  }
  node "hrportal-worker" <<container>> as Worker {
    artifact "hrportal-worker:1.4.0" <<image>> as WorkerImage
  }
}
artifact "appsettings.Production.json" <<deployment spec>> as Spec
node "Azure SQL DB" <<PaaS>> as Sql
node "Managed Redis" <<PaaS>> as Redis
node "Azure Service Bus" <<PaaS>> as Bus {
  artifact "leave-events" <<topic>> as Topic
}
node "Calendar System" <<external>> as Calendar
node "SMTP relay" <<external>> as Smtp

Api .. Spec
Browser -- Cdn : HTTPS 443
Browser -- Api : HTTPS 443
Api -- Calendar : HTTPS 443
Aca -- Sql : TDS 1433
Aca -- Redis : RESP/TLS 10000
Aca -- Bus : AMQP/TLS 5671
Worker -- Smtp : SMTP 587
@enduml
Put side by side, the differences between the two environments fit into one table. This table is also the agenda for the meeting with ops:
| Topic | Development (compose) | Production (Azure) |
|---|---|---|
| SPA (single-page application) | ng serve, Node.js, 4200 | Front Door + Storage, HTTPS (HTTP Secure) 443 |
| API | 1 container, HTTP 8080 | Container Apps, 2..5 replicas, HTTPS 443 |
| Database | mssql 2025 container, TDS 1433, certificate not validated | Azure SQL Database, TDS 1433, TLS required |
| Cache | redis:7 container, RESP 6379, no TLS | Azure Managed Redis, 10000, TLS |
| Messaging | Service Bus emulator, AMQP 5672, no TLS | Azure Service Bus, AMQP 5671, TLS |
| Calendar and e-mail | Fake implementation | Corporate Calendar System (HTTPS), SMTP (Simple Mail Transfer Protocol) relay 587 |
Talking to Ops: How Much Detail?
Linus's questions set the level of detail. Each node's name and kind, each artifact's name and version, each communication path's protocol and port, the replica count and the faces exposed to the outside (443 from the browser and 443 to the calendar system) are enough for this meeting. Someone writing firewall rules looks for exactly these lines. IP (Internet Protocol) addresses, VM (virtual machine) sizes and subnet masks belong in the infrastructure-as-code files, not in the diagram. They may change on every deploy; updating the diagram each time is not realistic.
The deployment diagram also has a C4 (Context, Containers, Components, Code) counterpart. The C4 model's deployment diagram is derived from the UML deployment diagram. Deployment nodes are nested and instances of C4 containers are placed inside them. The difference is focus: in C4 the things inside the boxes are C4 containers like "API Application", in UML they are artifacts. Choosing between them is not a matter of taste but of audience. If the rest of the architecture documentation is written in C4, the deployment should be too; if releases and packaging are being discussed, UML's language of artifacts and «manifest» is more precise. We cover all of C4 in the next post. The pipeline that produces the Docker image is in the ASP.NET Core Web API series' post on Docker and GitHub Actions.
Common Pitfalls
Drawing a picture full of cloud service icons but no labels. Azure icons catch the eye, but if there is no protocol and port on the lines, the picture does not answer ops' questions. Whatever you use, write a protocol on every path and a kind on every node.
Melting components and artifacts into the same box. "The Leave module connects to SQL Server" is a logical statement. In a deployment diagram the thing that connects is the container in which the DLL that manifests Leave runs. That distinction is vital in our case, where the same module runs in two different containers (API and worker).
Mistaking development for production. A diagram drawn automatically from a compose file shows none of production's TLS, replicas or managed services. Draw a separate diagram per environment, or at least collect the differences in a table like the one above.
Drawing arrowheads and fixing a direction. A communication path is an association. If you want to show who calls whom, that is a job for a sequence diagram or a C4 dynamic diagram; arrows in a deployment diagram add false precision and often wrong information.
Leaving the diagram unversioned. If the artifacts carry no version (hrportal-api:1.4.0), the diagram cannot say which release it describes. The image tag and the name of the deployment spec are the diagram's date stamp.
A Small Experiment
★☆☆ Add a mailpit container to the compose file and connect the worker to it over SMTP. Which node, which artifact and which communication path get added to the development diagram? How does the "Calendar and e-mail" row of the production table change?
★★☆ Draw the instance-level version of the production diagram: three API replicas spread over two availability zones. Underline the names and list which information differs from the type-level diagram.
★★★ Write a small C# console application that reads the output of docker compose config --format json and turns services into nodes, images into artifacts, and the hosts and ports in the connection strings into communication paths of a PlantUML deployment diagram. Compare the generated diagram with the hand-drawn one: which information is missing, and why?
A deployment diagram speaks the ops team's language, but it is too detailed for explaining the architecture to management or to a developer who just joined. In the next post we move on to the C4 model: we draw the Context, Container and Component levels for the HR Portal, see why the word "container" does not mean a Docker container, and go through the notation checklist.