

SIMD and Vectorization: Processing Many Values at Once with Vector128/256/512 and TensorPrimitives
SIMD means processing 4, 8 or 16 values held in a wide register at once with a single instruction; in .NET you use it through the BCL, TensorPrimitives, Vector<T> and Vector128/256/512. Summing a million ints, a single-accumulator vector loop is 2x faster and a four-accumulator one 6.5x; plus vpaddd ymm/zmm in x64 assembly, IsHardwareAccelerated as a JIT constant, and double sums that change with the hardware.
Version note: The code in this post was built and run with .NET 10 (C# 14) and System.Numerics.Tensors 10.0.15; tests use xUnit v3 4.0.3, and measurements were taken with BenchmarkDotNet 0.15.8 on an Apple M5 (ARM64, macOS 27, .NET 10.0.13). The example in the .NET 11 section was run on .NET 11 GA (SDK 11.0.100). The x64 assembly listings come from the .NET 10.0.15 JIT (in a Linux x64 container) and from a crossgen2 10.0.13 build targeting Windows x64.
Guess First
At the end of each day, Bookstore's reporting service sums the quantities of a million order lines: an int[] where every element is between 1 and 5. There are three candidates: a plain foreach loop, LINQ Sum(), and TensorPrimitives.Sum from the System.Numerics.Tensors package. All three are O(n) and all three touch each element once. Which one is fastest, and by how much?
Second question: the revenue part of the same report sums a million double amounts. The plain loop and TensorPrimitives.Sum return two different results from the same array. Which one is wrong?
The earlier posts in this series looked at how the CPU executes instructions, how it fetches data from memory and how cores share it. This post goes down to the lowest layer of parallelism: a single core processing several values at once with a single instruction.
SIMD: One Instruction, Many Lanes
SIMD means one instruction performing the same operation on several values held in a wide register. A 128-bit vector register holds four int values; each of those four slots is called a lane. A scalar add adds one number to one number, while a vector add adds four (or eight, or sixteen) pairs in one go.
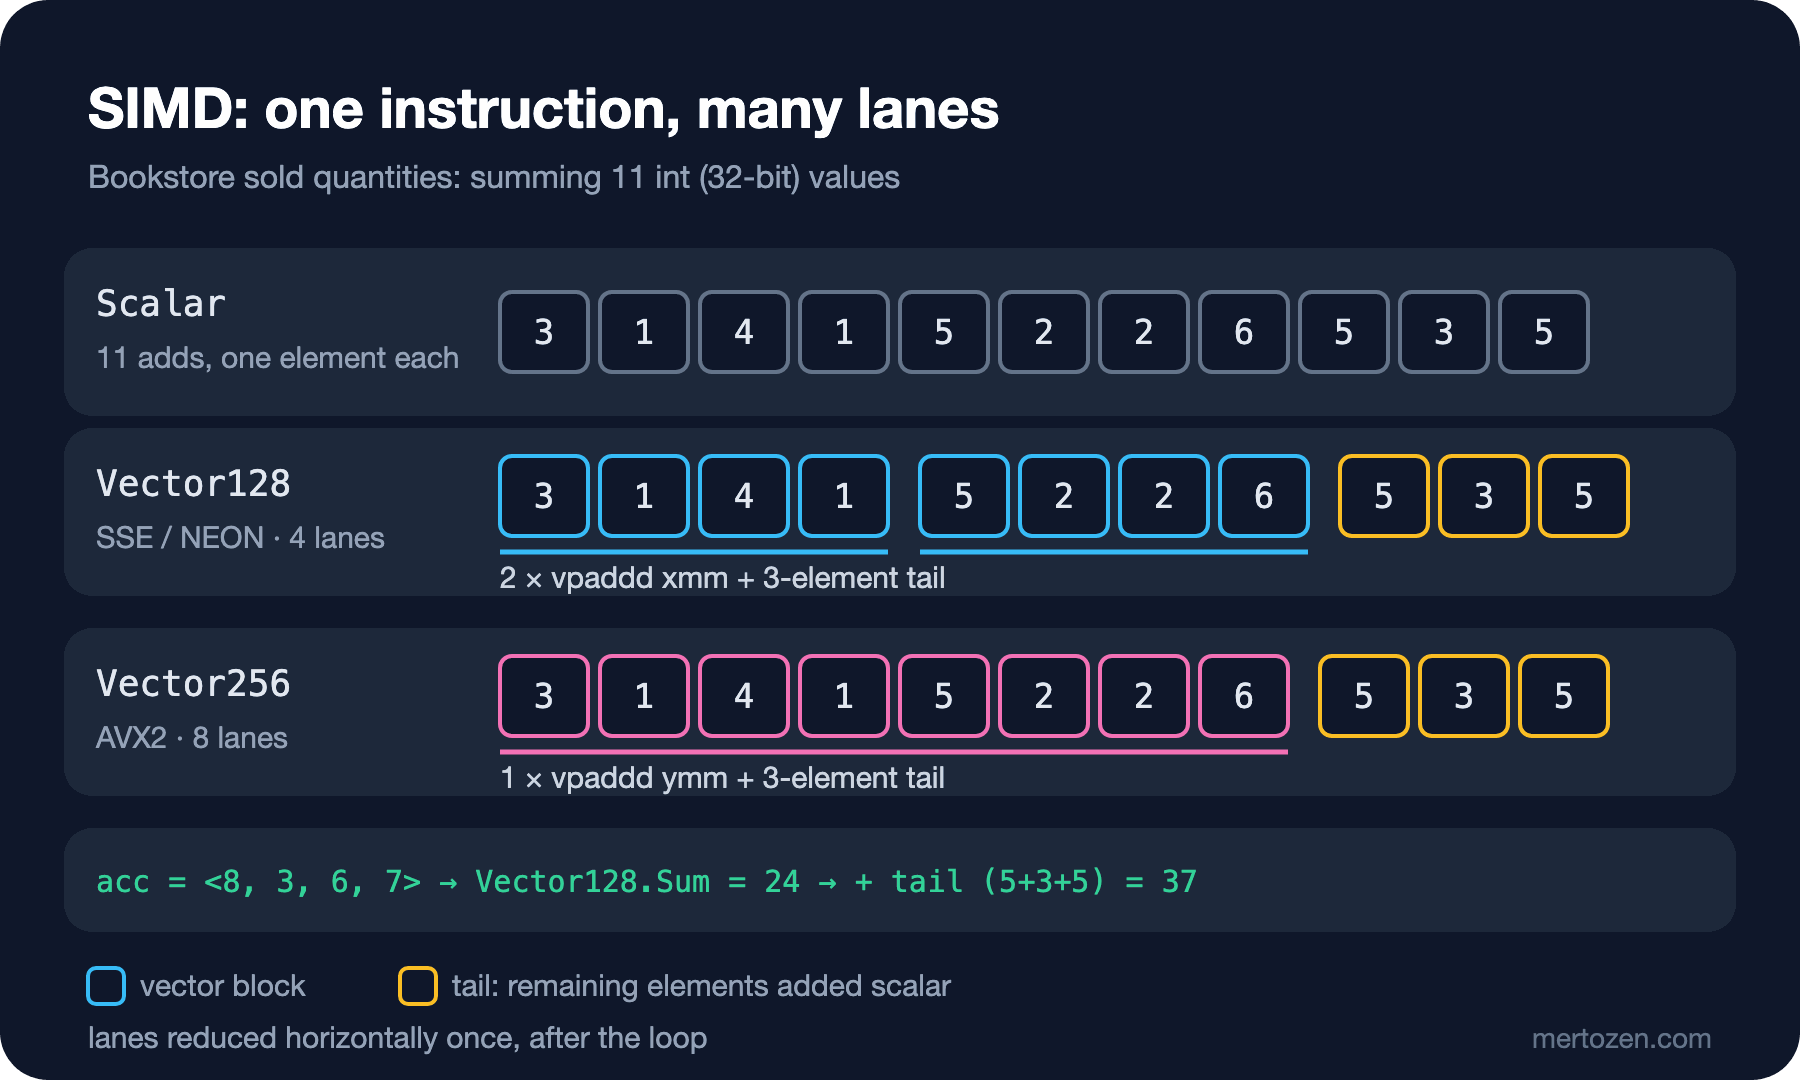
Register width depends on the ISA. On x64, SSE uses the 128-bit xmm registers, AVX2, which also brought integer operations to 256 bits, uses the 256-bit ymm registers, and AVX-512 uses the 512-bit zmm registers. On ARM64, the 128-bit NEON is standard; SVE, which leaves the width to the hardware, is a separate model. AVX2 is common on Windows x64 machines; AVX-512 is present on AMD's Zen 4 and later cores and on server Xeons, and disabled on Intel's hybrid client processors (from the 12th-generation Alder Lake onwards).
Asking .NET what is accelerated on your own machine takes a few lines:
using System.Numerics;
using System.Runtime.Intrinsics;
using Bookstore.Simd;

Console.WriteLine($"Architecture             : {System.Runtime.InteropServices.RuntimeInformation.ProcessArchitecture}");
Console.WriteLine($"Vector.IsHardwareAccel.  : {Vector.IsHardwareAccelerated}, Vector<int>.Count = {Vector<int>.Count}");
Console.WriteLine($"Vector128.IsHardwareAccel: {Vector128.IsHardwareAccelerated}");
Console.WriteLine($"Vector256.IsHardwareAccel: {Vector256.IsHardwareAccelerated}");
Console.WriteLine($"Vector512.IsHardwareAccel: {Vector512.IsHardwareAccelerated}");
if (args.Contains("--x86"))
{
    Console.WriteLine($"Avx2.IsSupported         : {System.Runtime.Intrinsics.X86.Avx2.IsSupported}");
    Console.WriteLine($"Avx512F.IsSupported      : {System.Runtime.Intrinsics.X86.Avx512F.IsSupported}");
}
else
{
    Console.WriteLine($"AdvSimd.IsSupported      : {System.Runtime.Intrinsics.Arm.AdvSimd.IsSupported}");
}
The only real hardware I measured on for this post is the Apple M5 from the version note; for the x64 side, which most readers use, I take only feature information and JIT-generated code from a Linux x64 environment that has AVX2 but not AVX-512, never timings. The two outputs:
Architecture             : Arm64
Vector.IsHardwareAccel.  : True, Vector<int>.Count = 4
Vector128.IsHardwareAccel: True
Vector256.IsHardwareAccel: False
Vector512.IsHardwareAccel: False
AdvSimd.IsSupported      : True

Architecture             : X64
Vector.IsHardwareAccel.  : True, Vector<int>.Count = 8
Vector128.IsHardwareAccel: True
Vector256.IsHardwareAccel: True
Vector512.IsHardwareAccel: False
Avx2.IsSupported         : True
Avx512F.IsSupported      : False
Vector<int> has 4 lanes on ARM64 and 8 on x64 with AVX2: the same C# code turns into machine code of different widths depending on where it runs. In the first post of the series we saw the same IL turn into different instructions on two ISAs; with SIMD the difference reaches down to the lane count.
.NET's SIMD Layers and What the JIT Doesn't Do
.NET doesn't offer SIMD as a single API but as stacked layers. Microsoft Learn's SIMD page lists them the same way:
| Layer | Example | When |
|---|---|---|
| Vectorized BCL methods | Span<T>.IndexOf, SequenceEqual, LINQ Sum | Always first; the vectorization is already inside |
| TensorPrimitives | TensorPrimitives.Sum, Add, Dot | Numeric work over spans |
| Variable width | Vector<T> | Portable loops that don't care about the width |
| Fixed width | Vector128<T>, Vector256<T>, Vector512<T> | Vectorizing a new algorithm by hand |
| Platform intrinsics | Avx2.Add, AdvSimd.Add | When you need one instruction the upper layers don't expose |
The BCL row deserves underlining, because it's the most important row in the table. Look at what happens to a loop you write yourself. A plain foreach sum:
[MethodImpl(MethodImplOptions.NoInlining)]
public static int SumScalar(ReadOnlySpan<int> quantities)
{
    int total = 0;
    foreach (int q in quantities)
    {
        total += q;
    }
    return total;
}
The loop part of its tier-1 (fully optimized) JIT output on x64:
G_M000_IG04:                ;; offset=0x000C
       add      eax, dword ptr [rdi+rcx]
       add      rcx, 4
       dec      esi
       jne      SHORT G_M000_IG04
A clean four-instruction loop with no bounds check, but it adds one int per iteration. The JIT did not vectorize this loop. Unless you convert the code to SIMD yourself or call a BCL method that uses SIMD, 224 of the 256 bits in the registers sit idle in this loop even on an AVX2 machine. (Which optimizations the JIT performs, and why, is the subject of the Compilers and Programming Languages series.)
Vectorizing by Hand: Vector<T> and Vector128
Vector<T>: let the runtime pick the width
[MethodImpl(MethodImplOptions.NoInlining)]
public static int SumVectorT(ReadOnlySpan<int> quantities)
{
    int i = 0;
    int total = 0;
    if (Vector.IsHardwareAccelerated && quantities.Length >= Vector<int>.Count)
    {
        Vector<int> acc = Vector<int>.Zero;
        int lastBlock = quantities.Length - Vector<int>.Count;
        for (; i <= lastBlock; i += Vector<int>.Count)
        {
            acc += new Vector<int>(quantities.Slice(i));
        }
        total = Vector.Sum(acc);
    }
    for (; i < quantities.Length; i++)
    {
        total += quantities[i];
    }
    return total;
}
The idea is the same as in the figure: keep an accumulator vector, add Vector<int>.Count elements at once on every iteration, reduce the lanes horizontally with Vector.Sum when the loop ends, and finish the remaining elements (the tail) with a scalar loop. Vector<int>.Count is a constant to the JIT; in the x64 tier-1 output it's baked in as 8:
G_M000_IG03:                ;; offset=0x001C
       cmp      ebx, esi
       ja       SHORT G_M000_IG06
       mov      ecx, ebx
       lea      rcx, bword ptr [rdi+4*rcx]
       mov      edx, esi
       sub      edx, ebx
       cmp      edx, 8
       jl       SHORT G_M000_IG07
       vpaddd   ymm0, ymm0, ymmword ptr [rcx]
       add      ebx, 8
       cmp      ebx, eax
       jle      SHORT G_M000_IG03
vpaddd ymm0, ymm0, ymmword ptr [rcx] does the real work: it adds 32 bytes (eight int values) to the accumulator in one instruction. Around it, cmp ebx, esi / ja is the check from Slice(i), and cmp edx, 8 / jl is the length check of the Vector<int> constructor. The loop bound already guarantees both, but the JIT can't prove it, so two checks stay in every iteration.
Vector128 and LoadUnsafe: the shape the BCL uses
[MethodImpl(MethodImplOptions.NoInlining)]
public static int SumVector128(ReadOnlySpan<int> quantities)
{
    int i = 0;
    int total = 0;
    if (Vector128.IsHardwareAccelerated && quantities.Length >= Vector128<int>.Count)
    {
        ref int start = ref MemoryMarshal.GetReference(quantities);
        Vector128<int> acc = Vector128<int>.Zero;
        int lastBlock = quantities.Length - Vector128<int>.Count;
        for (; i <= lastBlock; i += Vector128<int>.Count)
        {
            acc += Vector128.LoadUnsafe(ref start, (nuint)i);
        }
        total = Vector128.Sum(acc);
    }
    for (; i < quantities.Length; i++)
    {
        total += quantities[i];
    }
    return total;
}
LoadUnsafe does no bounds check; you guarantee the loop bound is right. In return the loop shrinks to just the instructions that do the work:
G_M000_IG03:                ;; offset=0x0020
       movsxd   rdx, ecx
       vpaddd   xmm0, xmm0, xmmword ptr [rdi+4*rdx]
       add      ecx, 4
       cmp      ecx, eax
       jle      SHORT G_M000_IG03

G_M000_IG04:                ;; offset=0x002F
       vpsrldq  xmm1, xmm0, 8
       vpaddd   xmm0, xmm1, xmm0
       vpsrldq  xmm1, xmm0, 4
       vpaddd   xmm0, xmm1, xmm0
       vmovd    eax, xmm0
The second block is Vector128.Sum: it shifts the register by 8 and 4 bytes and adds it to itself, reducing the four lanes to one number, once, outside the loop. The price of "Unsafe" is this: if lastBlock is wrong, you don't get an exception, you read outside the array. That's why the xUnit tests try every length from 0 to 70 plus an array of 1,000,003 elements, comparing every implementation with the scalar result. The rules for MemoryMarshal.GetReference and refs are in the C# Advanced series post "Span<T> and Memory<T> in C#: Allocation-Free Parsing, stackalloc and ref struct Rules".
Vector256 and Vector512: IsHardwareAccelerated Is a JIT Constant
SumVector512 is the Vector512 copy of the same method. To see what it produces on readers' machines, I compiled it with crossgen2 for the Windows x64 target as ReadyToRun, ahead of time, twice: x86-64-v3 (AVX2 level) and x86-64-v4 (AVX-512 level). The listings are the FullOpts output of the same optimizer; ReadyToRun only inlines more conservatively (MemoryMarshal.GetReference stays a call). On the x86-64-v3 target, this is the whole method:
G_M000_IG02:                ;; offset=0x0000
       mov      rax, bword ptr [rcx]
       mov      ecx, dword ptr [rcx+0x08]
       xor      edx, edx
       test     ecx, ecx
       jle      SHORT G_M000_IG05

G_M000_IG03:                ;; offset=0x000C
       xor      r8d, r8d

G_M000_IG04:                ;; offset=0x000F
       add      edx, dword ptr [rax+r8]
       add      r8, 4
       dec      ecx
       jne      SHORT G_M000_IG04
The vector code is gone entirely; only the scalar tail loop remains. On an AVX2 machine, Vector512.IsHardwareAccelerated is the constant false at compile time, and the JIT deletes the if block as dead code. The check has no runtime cost, which is why Microsoft's documentation recommends reading the value directly instead of caching it. The same method on the x86-64-v4 target:
G_M000_IG04:                ;; offset=0x0041
       movsxd   rdx, edi
       vpaddd   zmm0, zmm0, zmmword ptr [rax+4*rdx]
       add      edi, 16
       cmp      edi, ecx
       jle      SHORT G_M000_IG04

G_M000_IG05:                ;; offset=0x0052
       vmovaps  zmm1, zmm0
       vextracti32x8 ymm0, zmm0, 1
       vpaddd   ymm0, ymm0, ymm1
The loop now adds 64 bytes, sixteen int values, per iteration. On Windows the parameter arrives in rcx (the Microsoft x64 calling convention); that explains the rdi you see in the Linux listings.
Two details matter directly to x64 readers. First, Vector<T> can stay at 256 bits by default even on an AVX-512 machine; according to the documentation, DOTNET_MaxVectorTBitWidth=512 widens it. If you expect a benefit from 512 bits, you use Vector512<T> explicitly. Second, DOTNET_PreferredVectorBitWidth does the opposite: lowering it makes IsHardwareAccelerated return false for the wider types. That's the easy way to compare the 256- and 512-bit paths in the same benchmark on an AVX-512 machine. These settings only affect code the JIT compiles; they don't touch code precompiled with ReadyToRun.
The platform intrinsics at the bottom of the table (such as Avx2.Add) each correspond to a single instruction; checking Avx2.IsSupported before calling them is mandatory, otherwise you get PlatformNotSupportedException.
Measurement: Loop, LINQ, Vector and TensorPrimitives
The answer to the guessing question. As the version note says, the measurements are from the Apple M5; the vector width here is 128 bits, half of an x64 machine with AVX2:
| Method      | N       | Mean         | StdDev      | Ratio |
|------------ |-------- |-------------:|------------:|------:|
| Scalar      | 4096    |   1,193.0 ns |   169.28 ns |  1.02 |
| Linq        | 4096    |     562.4 ns |    61.23 ns |  0.48 |
| VectorT     | 4096    |     576.4 ns |    47.75 ns |  0.49 |
| Vector128   | 4096    |     481.3 ns |    21.55 ns |  0.41 |
| Vector128x4 | 4096    |     140.2 ns |     2.46 ns |  0.12 |
| Vector256   | 4096    |     231.5 ns |     3.70 ns |  0.20 |
| Tensor      | 4096    |     442.3 ns |     5.38 ns |  0.38 |
|             |         |              |             |       |
| Scalar      | 1000000 | 264,012.2 ns | 4,181.78 ns |  1.00 |
| Linq        | 1000000 | 136,211.2 ns | 5,029.75 ns |  0.52 |
| VectorT     | 1000000 | 128,259.4 ns | 1,599.08 ns |  0.49 |
| Vector128   | 1000000 | 131,554.4 ns | 5,236.24 ns |  0.50 |
| Vector128x4 | 1000000 |  40,617.4 ns | 1,378.11 ns |  0.15 |
| Vector256   | 1000000 |  64,600.0 ns | 1,564.89 ns |  0.24 |
| Tensor      | 1000000 | 124,925.5 ns | 2,161.10 ns |  0.47 |
I trimmed the columns (no row allocates). Other work was running on the machine during the measurement (load average 8–11), so I kept the StdDev column; that's where the wide deviation in the 4096 scalar row comes from.
LINQ Sum finishes in half the time of the plain loop: for int[] it already uses SIMD internally, with overflow checking on top. Vector<T>, Vector128 and TensorPrimitives land in the same place, around 0.4–0.5. There are four lanes but the gain is two times. Why not four?
The answer is the instruction-level parallelism from the series post "CPU Pipelines and Branch Prediction". In a loop with a single accumulator, every acc += … waits for the previous addition to finish; that's a dependency chain. Judging by the measurement, waiting for a vector add's result takes longer than waiting for a scalar add on this machine; half of the gain from the lanes goes into that waiting. The fix is independent accumulators; the example on Microsoft's SIMD page also unrolls the loop with four. The loop of SumVector128x4:
Vector128<int> acc0 = Vector128<int>.Zero;
Vector128<int> acc1 = Vector128<int>.Zero;
Vector128<int> acc2 = Vector128<int>.Zero;
Vector128<int> acc3 = Vector128<int>.Zero;
int lastBlock = quantities.Length - Vector128<int>.Count * 4;
for (; i <= lastBlock; i += Vector128<int>.Count * 4)
{
    acc0 += Vector128.LoadUnsafe(ref start, (nuint)i);
    acc1 += Vector128.LoadUnsafe(ref start, (nuint)(i + 4));
    acc2 += Vector128.LoadUnsafe(ref start, (nuint)(i + 8));
    acc3 += Vector128.LoadUnsafe(ref start, (nuint)(i + 12));
}
total = Vector128.Sum((acc0 + acc1) + (acc2 + acc3));
Same 128-bit registers, same instructions; the only difference is that the four chains don't wait for each other. The result is 0.12–0.15 of scalar, 6.5–8.5 times faster. Most of that gain comes not from the lanes but from keeping the pipeline full.
The odd row in the table is Vector256. On this machine Vector256.IsHardwareAccelerated is false and SumVector256 deliberately has no check, yet it's twice as fast as the single-accumulator Vector128. The ARM64 tier-1 output shows why:
G_M000_IG03:                ;; offset=0x0028
            sbfiz   x4, x2, #2, #32
            add     x4, x0, x4
            ldp     q18, q19, [x4]
            add     v16.4s, v16.4s, v18.4s
            add     v17.4s, v17.4s, v19.4s
            add     w2, w2, #8
            cmp     w2, w3
            ble     G_M000_IG03
The .NET 10 JIT split the unaccelerated Vector256 into two Vector128 halves: it reads 32 bytes with a single ldp and adds them into two separate registers (v16, v17). In other words, we wrote a two-accumulator loop without realizing it. On an x64 machine with AVX2, the same code really uses the 256-bit vpaddd ymm; but the single accumulator's dependency chain applies there too, and the multiple-accumulator technique works regardless of width.
TensorPrimitives and the Order of Floating Point
The Tensor row in the table is a one-line call, and it finishes in the same time as the single-accumulator Vector128 loop; on top of that, it handles the 256-bit path on an AVX2 machine, the 512-bit path on an AVX-512 machine, the tail and the length checks on its own. The package offers dozens more span operations such as Add, Multiply, Dot and CosineSimilarity; look here before writing a loop by hand.
Now the second half of the guessing question. The revenue report sums a million double amounts (between 5.00 and 59.99); the decimal sum of the same amounts is computed for comparison:
decimal (exact) : 32447311.90
scalar double   : 32447311.899999037
TensorPrimitives: 32447311.899999812
difference      : -7.748603820800781E-07
Which one is wrong? Both are correct; only the order of addition differs. The scalar loop adds the amounts from left to right into one total; the vectorized sum keeps a separate partial sum in each lane and combines them at the end. In floating point every intermediate step rounds, so where the parentheses go changes the result; here the vectorized result is closer to the exact value, but that's not a guarantee. Why IEEE 754 addition isn't associative is covered in the Number Systems and Data Representation series post "How Floating Point Works: IEEE 754, 0.1 + 0.2, NaN and double vs decimal".
The real surprise: the order depends on the hardware. In the x64 container (AVX2, 256 bits) the TensorPrimitives line becomes 32447311.89999982; with DOTNET_EnableHWIntrinsic=0 it's exactly the scalar result, 32447311.899999037. Same data, same code, three different last digits on three execution paths. That's why the first test I wrote, Assert.NotEqual(scalar, tensor), broke with intrinsics turned off; I changed it to a comparison with a tolerance. Money needs decimal, which has no SIMD counterpart (see the TotalPrice listing in the first post of the series). For an analytics report, double and SIMD are acceptable; for an invoice, they're not.
On the speed side, the scalar sum of a million double values took 583.1 µs and TensorPrimitives.Sum took 247.7 µs (ratio 0.42); only two double values fit in 128 bits, so the gain is smaller than with int.
What about the GPU?
SIMD means 4, 8 or 16 lanes inside one CPU core. A GPU takes the same idea to thousands of lanes, but it's sensitive to branching and to copying data between the CPU and the GPU. Model training, made of large matrix multiplications, fits the GPU very well; summing an array of a few thousand elements doesn't pay for the copy and stays on the CPU. The machine learning side is in the Introduction to Machine Learning series.
.NET 11: Lane Construction APIs and Half in Hardware
The .NET 11 runtime what's-new page (updated for the GA release) lists new methods on Vector64/128/256/512 and Vector<T> that build vectors lane by lane and move lanes around: CreateGeometricSequence, CreateAlternatingSequence, CreateHarmonicSequence, the Zip/Unzip family, Concat* and Reverse. In a net11.0 project:
using System.Runtime.Intrinsics;

// Each lane is twice the previous one
Vector128<int> batchSizes = Vector128.CreateGeometricSequence(1, 2);
Console.WriteLine($"Geometric : {batchSizes}");

// Interleave book ids and stock counts into (id, stock) pairs
Vector128<int> bookIds = Vector128.Create(101, 102, 103, 104);
Vector128<int> stock = Vector128.Create(10, 20, 30, 40);
(Vector128<int> lower, Vector128<int> upper) = Vector128.Zip(bookIds, stock);
Console.WriteLine($"Zip lower : {lower}");
Console.WriteLine($"Zip upper : {upper}");

(Vector128<int> ids, Vector128<int> back) = Vector128.Unzip(lower, upper);
Console.WriteLine($"Unzip     : {ids} {back}");
Geometric : <1, 2, 4, 8>
Zip lower : <101, 10, 102, 20>
Zip upper : <103, 30, 104, 40>
Unzip : <101, 102, 103, 104> <10, 20, 30, 40>Zip interleaves two vectors lane by lane and Unzip separates them again: the portable way to split data laid out as (id, stock, id, stock…) into its fields. On .NET 10 this usually took Shuffle or a platform-specific intrinsic.
According to the same page, the .NET 11 JIT uses hardware FP16 instructions for Half when the processor supports them: on x64, arithmetic uses AVX10.1 and conversions use F16C; on ARM64, the optional FP16 extension; no code changes are needed. The .NET 10 Avx10v2 intrinsics, on the other hand, are disabled by default, because no AVX10.2 hardware existed when .NET 10 shipped.
In Production
Measure on the target hardware. The ratios in this post come from 128-bit NEON; on a Windows machine with AVX2 the registers are twice as wide, and on an ARM64 server the 256-bit paths aren't accelerated.
Log Vector<int>.Count and Vector256/512.IsHardwareAccelerated once at application startup. Virtual machines can hide CPU features; the same physical processor may or may not expose AVX-512 depending on the VM settings.
When the data doesn't fit in cache, the bottleneck shifts to memory bandwidth. The 4 MB of data in the table fits in this machine's cache; with larger data, adding lanes doesn't pay off proportionally (see the series post on the memory hierarchy).
Every vectorized path needs tests. Run the test suite once more with DOTNET_EnableHWIntrinsic=0, and on x64 also with DOTNET_PreferredVectorBitWidth=128 and 256; that exercises the paths the machine wouldn't pick. This post's 74 tests also pass with intrinsics turned off. Since .NET 11 raised the minimum x64 hardware to x86-64-v2, .NET 11 doesn't start at all on an older CPU.
Profiler first: SIMD only pays off in a really hot loop, so find that loop with the tools in the .NET Profiling and Diagnostics series.
Common Pitfalls
Rewriting by hand what the BCL already vectorizes. LINQ Sum, Span<T>.IndexOf, SequenceEqual and TensorPrimitives use SIMD internally; hand-written code stays only if it's measurably faster.
Not noticing that overflow behavior changes. LINQ Sum checks for overflow; SIMD sums silently wrap:
[Fact]
public void Linq_checks_overflow_but_simd_sums_wrap()
{
    int[] q = [int.MaxValue, 1, 0, 0, 0, 0, 0, 0];
    Assert.Throws<OverflowException>(() => SalesMath.SumLinq(q));
    Assert.Equal(int.MinValue, SalesMath.SumVector128(q));
    Assert.Equal(int.MinValue, SalesMath.SumTensor(q));
}
When you replace LINQ with a SIMD loop, you get a negative total instead of an OverflowException. If the total can overflow, widen to long or check for overflow separately.
Testing floating point results with exact equality: a vectorized sum changes in the last digits from machine to machine, so tests should use a tolerance.
Ignoring unaligned data. LoadUnsafe reads from any address, but if a 16- or 32-byte read lands on the boundary between two cache lines, it touches both lines. Microsoft's documentation notes that the random alignment of allocations adds noise to benchmark results and points to NativeMemory.AlignedAlloc for stable measurements. The mechanics of the cache line are in the series post "How CPU Caches Work".
Relying on a width that isn't accelerated. On this machine the Vector256 loop without an IsHardwareAccelerated check came out fastest, but that's a JIT detail, not a contract. The documentation tells you to check each width separately; an if chain that steps down from the widest path to the narrowest is the one that's both correct and portable.
Vectorizing tiny inputs: on an array of a few elements, the checks, the reduction and the tail eat the gain. Measure with your real input sizes.
A Small Experiment
★☆☆ Run the feature probe on your own Windows machine. What is Vector<int>.Count? Then run it again in PowerShell with $env:DOTNET_PreferredVectorBitWidth="128": which lines change, and does Vector<int>.Count change?
★★☆ Add N = 64_000_000 (256 MB) to SumBenchmarks. What happens to the Vector128x4/Scalar ratio compared with 4096? Explain the result in terms of memory bandwidth; does the gap between Vector256 and Vector128x4 remain on your machine?
★★★ Write "count the order lines whose total is greater than 100" branch-free and vectorized with Vector128.GreaterThan, ExtractMostSignificantBits and BitOperations.PopCount. Finish the tail with scalar code, add an xUnit test comparing it with the scalar version for every length from 0 to 70, and measure it with the sorted/shuffled data from the series post "CPU Pipelines and Branch Prediction": does sorting make a difference for the SIMD version?
The How Computers Work series ends here. We've followed a line of C# down to instructions, then the pipeline, the memory hierarchy, the cache line, sharing between cores and finally SIMD. Finding the hot loop is covered in the .NET Profiling and Diagnostics series, the correctness side of memory shared between cores in the Concurrency Theory series, how the JIT produced this code in the Compilers and Programming Languages series, and where vectorized math goes at scale in the Introduction to Machine Learning series.