

The Memory Hierarchy: Latency Numbers from Registers to SSD and Locality
Memory is not one flat thing: from registers and L1 down to DRAM, SSD and the network, every layer is bigger and slower, and a DRAM read takes about 90 times as long as an L1 read. Summing a 256 MB array in shuffled order is 13.4x slower, you can measure latency on your own machine with pointer chasing, stack and heap are the same RAM, and a struct array scans 6x faster than a List<Book>.
Version note: The code in this post was built and run with .NET 10 (C# 14); measurements were taken with BenchmarkDotNet 0.15.8 on an Apple M5 / macOS 27 / .NET 10.0.13, and tests were run with xUnit v3 4.0.3.
Guess First
Bookstore's nightly stock report sums an array of 64 million ints, which is 256 MB. You sum the same array twice: once in index order, and once following a shuffled order of the same indexes. Both loops do the same 64 million additions, both are O(n), and both touch every element exactly once. How much slower is the shuffled order: 10 percent, twice as slow, ten times?
Second question: in the time the CPU waits for one value from RAM, how many times could it read the same value from the nearest cache? In the "What Big-O Doesn't Tell You: Constants, Cache and Measuring with BenchmarkDotNet" post of the Big-O and Complexity series, we explained LinkedList being 3.8x slower than an array with two words: "cache and pointer chasing". This post opens up the hardware behind those words by measuring it.
From Registers to the Network: The Steps of the Hierarchy
From the program's point of view, memory is one flat address space. In hardware it is a stack of layers, and each layer is smaller and faster than the one below it: fast memory is expensive and takes up room on the chip, large memory is cheap but far away. One of the core ideas of Bryant and O'Hallaron's Computer Systems: A Programmer's Perspective (3rd edition) is exactly this: each layer acts as a cache for the data of the layer below.
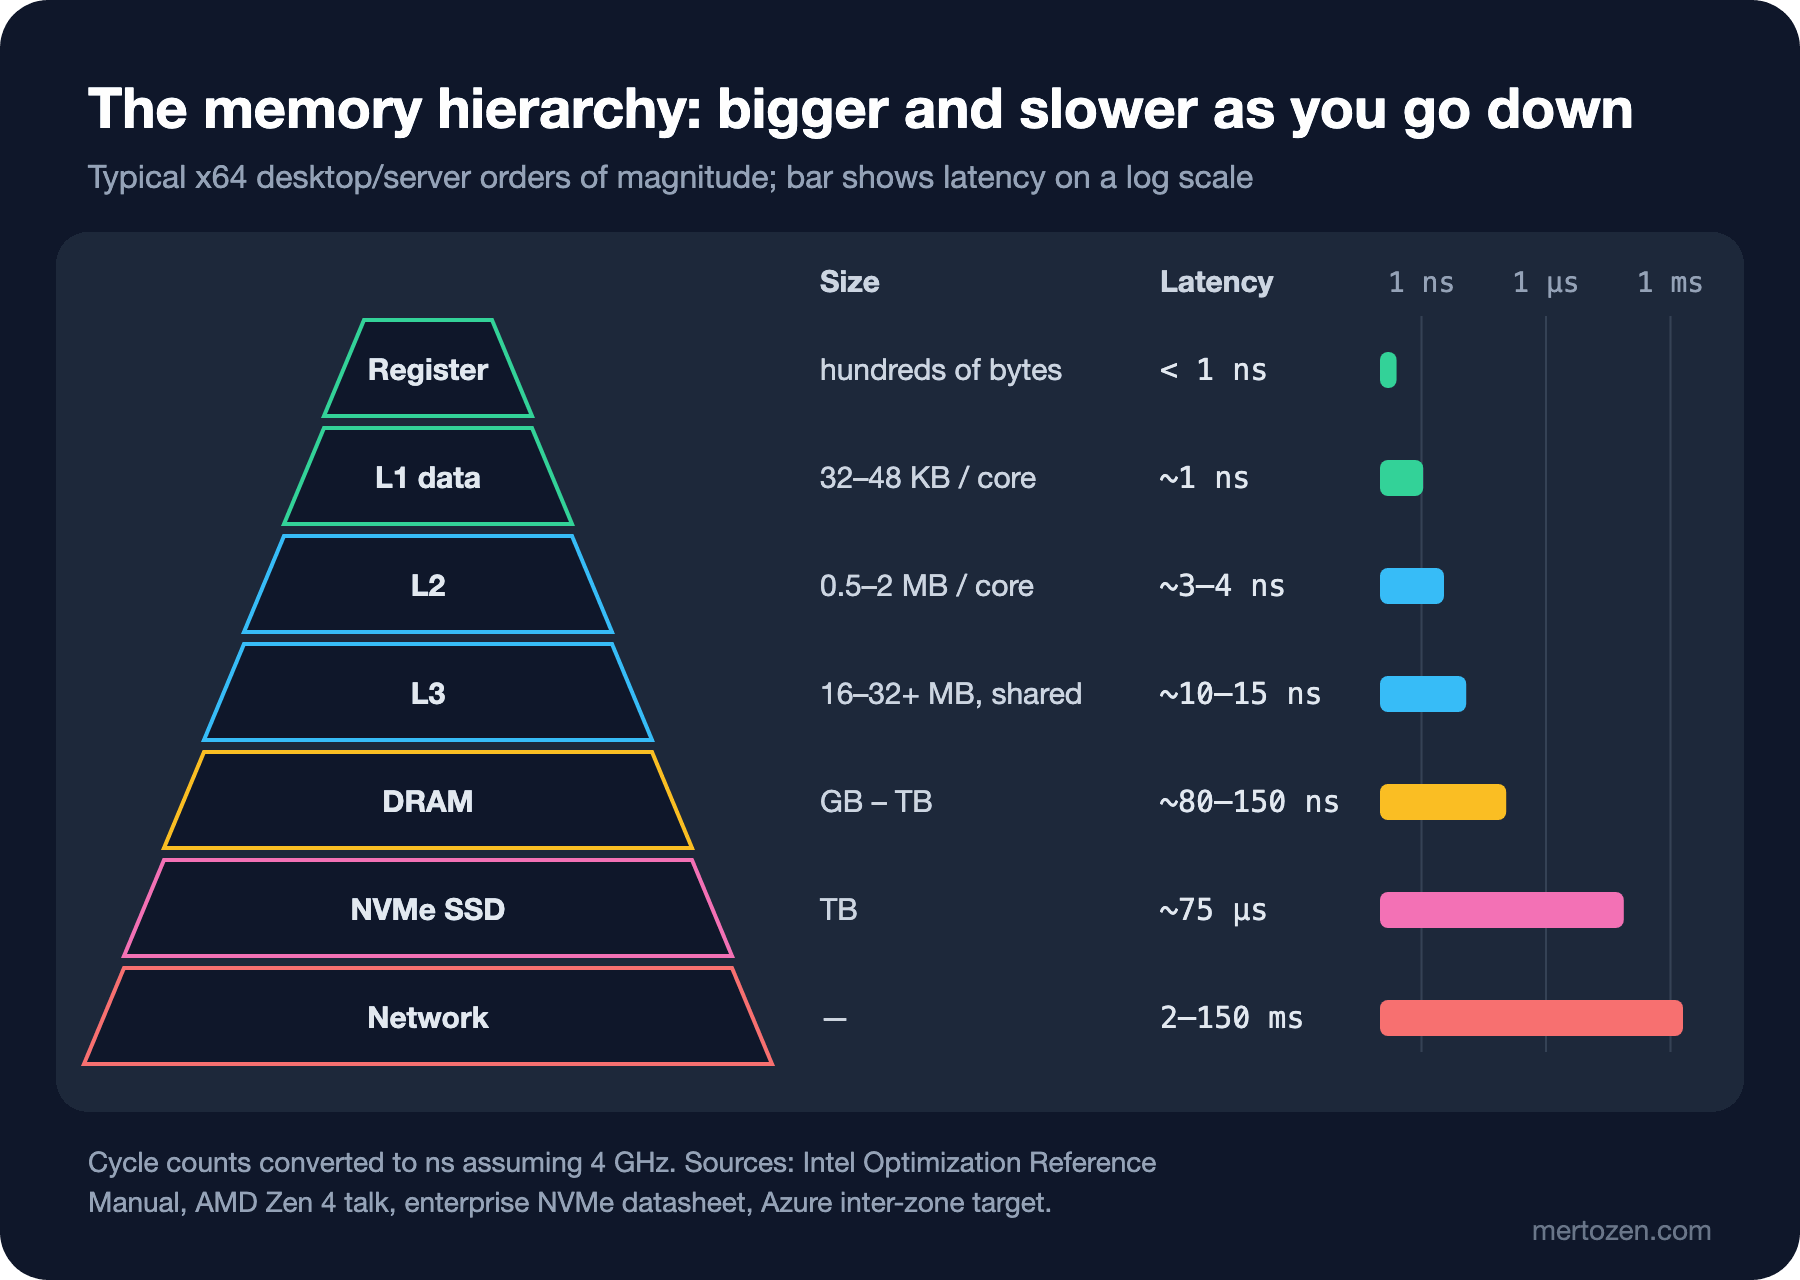
The values in the figure are orders of magnitude for typical x64 desktop and server processors, not exact numbers. Intel's Optimization Reference Manual (October 2026 edition) gives, for the Skylake client core, a 32 KB L1 data cache at 4 cycles in the best case, a 256 KB L2 at 12 cycles, and a shared L3 of up to 2 MB per core at 44 cycles; the newer Golden Cove has a 48 KB L1 and an L2 of 1.25 MB on client parts and 2 MB on server parts. AMD's GDC 2024 talk lists 32 KB of L1 data, 1 MB of L2 and 32 MB of L3 per eight-core complex for Zen 4. At 4 GHz one cycle is 0.25 ns, so L1 comes to about 1 ns, L2 to 3–4 ns and L3 to 10–15 ns.
Caches are built from SRAM cells, main memory from DRAM cells. According to Ulrich Drepper's What Every Programmer Should Know About Memory (2007), an SRAM cell needs six transistors, while a DRAM cell is just one transistor and one capacitor and has to be refreshed constantly. In Intel's manual, the idle latency measured on a two-socket Xeon server is about 82 ns for the local socket's memory and about 153 ns for the other socket's. For NVMe SSDs, Seagate's Nytro 5550 datasheet gives an average of 75 µs for a single 4 KB read. For the network, Microsoft aims to keep round trips between availability zones of the same Azure region under about 2 ms; an intercontinental round trip takes hundreds of milliseconds.
I took the measurements on the only real hardware I have, an Apple M5; this chip has no L3, and its performance cores use a 128 KB L1 data cache and a shared 16 MB L2 (sysctl hw.perflevel0). The x64 numbers come from the documents above; how to take the same measurement on Windows is in the In Production section.
Turning Nanoseconds into Human Time
The nanosecond is a unit that intuition does not handle well. If one L1 read took one second and every other layer were scaled by the same ratio, the table would look like this (ratios from the sources above, the arithmetic is mine):
| Layer | Real latency | If L1 took one second |
|---|---|---|
| L1 data cache | ~1 ns | 1 second |
| L2 | ~3–4 ns | 3–4 seconds |
| L3 | ~10–15 ns | 10–15 seconds |
| DRAM | ~80–150 ns | 1.5–2.5 minutes |
| NVMe SSD, 4 KB read | ~75 µs | about 21 hours |
| Round trip between zones of one region | ~2 ms | about 23 days |
| Intercontinental round trip | ~150 ms | about 4.8 years |
From the CPU's point of view, a DRAM read is a very long wait: at 4 GHz, 100 ns is 400 cycles, and a core that can retire several instructions per cycle could have run hundreds of instructions in that time. A single network call added to an HTTP request is tens of thousands of times more expensive than a memory read. Before asking "how many operations does this code do", ask "which layer does this code's data live in".
Measure on Your Own Machine: A Latency Ladder with Pointer Chasing
The classic way to measure your own machine's numbers is pointer chasing: an array in which every element holds the index of the next step, built with Sattolo's algorithm so that it forms one big cycle:
public static class PointerChase
{
    // Sattolo's algorithm: produces a single cycle that visits every element
    public static int[] CreateCycle(int count, int seed)
    {
        int[] next = AccessPatterns.SequentialIndexes(count);
        Random random = new(seed);
        for (int i = count - 1; i > 0; i--)
        {
            int j = random.Next(i);
            (next[i], next[j]) = (next[j], next[i]);
        }
        return next;
    }

    // Every read waits for the previous one: the CPU cannot guess the next address
    public static int Walk(int[] next, int steps)
    {
        int current = 0;
        for (int i = 0; i < steps; i++)
        {
            current = next[current];
        }
        return current;
    }
}
Every read in Walk depends on the previous one: you don't know the next address until next[current] arrives. The CPU cannot overlap the reads and the prefetcher cannot predict a random order, so the time per step equals the latency of the layer the array fits in. As the array grows, the data moves down a layer:
[SimpleJob(warmupCount: 5, iterationCount: 10)]
[HideColumns(Column.Error)]
public class LatencyLadder
{
    private const int Steps = 1_000_000;
    private int[] _next = [];

    [Params(32, 1_024, 8_192, 65_536, 262_144)]
    public int SizeKb { get; set; }

    [GlobalSetup]
    public void Setup() => _next = PointerChase.CreateCycle(SizeKb * 1024 / sizeof(int), seed: 7);

    [Benchmark(OperationsPerInvoke = Steps)]
    public int DependentLoad() => PointerChase.Walk(_next, Steps);
}
With OperationsPerInvoke, BenchmarkDotNet divides the time by one million steps and reports the time per step. Setting up BenchmarkDotNet and its pitfalls are covered in the "Performance in C#: Allocations, Structs and Measuring with BenchmarkDotNet" post of the Advanced C# series, so I won't repeat them here. The result:
| Method        | SizeKb | Mean      | StdDev    |
|-------------- |------- |----------:|----------:|
| DependentLoad | 32     |  1.035 ns | 0.0712 ns |
| DependentLoad | 1024   |  2.912 ns | 0.0228 ns |
| DependentLoad | 8192   | 14.084 ns | 2.0706 ns |
| DependentLoad | 65536  | 88.633 ns | 3.0130 ns |
| DependentLoad | 262144 | 96.118 ns | 1.1849 ns |
32 KB fits in L1 and a step takes 1 ns. 1 MB is in L2, at 2.9 ns. On paper 8 MB still fits in the 16 MB L2, but it climbs to 14 ns because the L2 is shared by all cores and the cost of address translation kicks in. 64 MB and 256 MB are in DRAM, at 89–96 ns. That answers the second question: one DRAM read takes as long as about 90 L1 reads. With large data sets part of the time comes from TLB misses; that topic is the "Virtual Memory: Pages, Page Tables, the TLB and Page Faults" post of the Operating System Fundamentals series. This Mac uses 16 KB pages while Windows and Linux on x64 default to 4 KB, so that share can be different on x64. What matters is not the absolute numbers but the ratios between layers.
Locality: Temporal and Spatial
The hierarchy works because programs don't use memory randomly. Temporal locality: data you just used is likely to be used again soon, like loop variables or the "bestsellers" list Bookstore reads on every request. Spatial locality: if you used an address, you are likely to use its neighbours soon, like scanning an array from start to end.
The cache itself captures temporal locality: data that was used stays up there for a while. Spatial locality has two mechanisms. First, memory moves not byte by byte but in blocks called cache lines: Intel's manual gives 64 bytes on x64, and on this Mac hw.cachelinesize says 128 bytes. When you read one int, its 15 neighbours (31 on this Mac) come along at no extra cost. Second, the hardware prefetcher notices sequential or constant-stride access and fetches the next lines ahead of time; AMD's GDC talk lists separate stream and stride prefetchers at L1 and L2 for Ryzen. The details of cache lines and associativity are in the next post of the series.
"RAM Is Not Random Access": Sequential vs Shuffled Access
Now let's measure the first question. We sum the same values array with two different index lists. Both lists contain the same numbers in a different order; in both cases the loop reads the index list in order, and the only difference is how we access values:
public static long SumAt(int[] values, int[] indexes)
{
    long sum = 0;
    foreach (int index in indexes)
    {
        sum += values[index];
    }
    return sum;
}

[SimpleJob(warmupCount: 5, iterationCount: 10)]
[HideColumns(Column.Error, Column.RatioSD)]
public class SequentialVsRandom
{
    private int[] _values = [];
    private int[] _sequential = [];
    private int[] _shuffled = [];

    [Params(4_096, 262_144, 4_194_304, 67_108_864)]
    public int N { get; set; }

    [GlobalSetup]
    public void Setup()
    {
        _values = AccessPatterns.ShuffledIndexes(N, seed: 1);
        _sequential = AccessPatterns.SequentialIndexes(N);
        _shuffled = AccessPatterns.ShuffledIndexes(N, seed: 2);
    }

    [Benchmark(Baseline = true)]
    public long Sequential() => AccessPatterns.SumAt(_values, _sequential);

    [Benchmark]
    public long Shuffled() => AccessPatterns.SumAt(_values, _shuffled);
}
xUnit tests verify that both orders give the same sum, so the only difference we measure is the access order:
| Method     | N        | Mean           | StdDev         | Ratio |
|----------- |--------- |---------------:|---------------:|------:|
| Sequential | 4096     |       1.064 us |      0.0094 us |  1.00 |
| Shuffled   | 4096     |       1.132 us |      0.0140 us |  1.06 |
|            |          |                |                |       |
| Sequential | 262144   |      71.196 us |      2.5728 us |  1.00 |
| Shuffled   | 262144   |     119.891 us |      0.3331 us |  1.69 |
|            |          |                |                |       |
| Sequential | 4194304  |   1,188.452 us |     20.5597 us |  1.00 |
| Shuffled   | 4194304  |   2,836.390 us |    152.9758 us |  2.39 |
|            |          |                |                |       |
| Sequential | 67108864 |  19,054.474 us |    548.8265 us |  1.00 |
| Shuffled   | 67108864 | 255,293.365 us | 43,998.4974 us | 13.41 |
The answer: at 256 MB the shuffled order is 13.4x slower; at 16 KB there is no difference because the data is already in L1. Per element, sequential access stays at about 0.28 ns for every size: the prefetcher is one step ahead and every cache line it brings in is used in full. Shuffled access climbs to 0.46, 0.68 and finally 3.8 ns; every access brings in a new line and uses a single int from it.
The interesting part is that 3.8 ns is far less than the 96 ns DRAM latency we measured on the ladder. The difference is dependency. Here the address of every read comes from the index array, not from the result of the previous read, so the CPU can send dozens of reads on their way at once and wait for them in parallel. Intel's manual says this capacity was increased in Golden Cove, to 16 fill buffers at L1 and 48 outstanding misses at L2. Pointer chasing gets none of that parallelism. The "random access" in RAM's name says you can go directly to any address, not that every address arrives in the same time. The real problem is not random access as such but misses that depend on each other: linked lists, trees, object graphs.
Stack and Heap Are the Same RAM
"The stack is fast, the heap is slow" is half true. Stack and heap are both regions of the process's virtual address space, and both end up in the same physical DRAM and the same caches. The stack's advantage comes from elsewhere: allocation is as cheap as moving a pointer, memory is reclaimed automatically when the method returns, and the top of the stack is almost always in L1 because the same region is used over and over (temporal locality). To separate these, I did the same 256-int job in three places:
public static int SumOnStack(int count)
{
    Span<int> prices = stackalloc int[count];
    return Fill(prices);
}

public static int SumOnNewArray(int count)
{
    int[] prices = new int[count];
    return Fill(prices);
}

public static int SumOnReusedArray(int[] prices) => Fill(prices);
| Method | Mean | StdDev | Ratio | Gen0 | Allocated | Alloc Ratio |
|------------ |---------:|---------:|------:|-------:|----------:|------------:|
| Stackalloc | 216.4 ns | 7.25 ns | 1.00 | - | - | NA |
| NewArray | 217.2 ns | 16.95 ns | 1.00 | 0.1249 | 1048 B | NA |
| ReusedArray | 191.5 ns | 7.50 ns | 0.89 | - | - | NA |The stack and the new heap array run in the same time; the 1 KB of data is in L1 in both cases. The difference is in the Allocated column: the heap version leaves 1048 bytes behind on every call (1024 bytes of data and a 24-byte array header). The 0.1249 under Gen0 means roughly one gen0 GC collection every 8,000 calls; that cost is paid when the GC runs. The reused array being 11 percent ahead comes from not preparing new, zeroed memory on every call; by default C# zeroes stackalloc memory too. The rules of stackalloc are in the "Span<T> and Memory<T> in C#: Allocation-Free Parsing, stackalloc and ref struct Rules" post of the Advanced C# series, and how the GC works is in the "Object Lifetime in C#: the Garbage Collector, IDisposable and using" post of the C# Object-Oriented Programming series.
Book[] of Structs vs List<Book>: One Level of Indirection
In real code, the data structure you choose decides locality more than anything else. Bookstore's stock report sums the Stock of one million books. A book can be a class or a record struct; we fill both with the same data:
public sealed class BookEntity(string isbn, string title, decimal price, int stock)
{
    public string Isbn { get; } = isbn;
    public string Title { get; } = title;
    public decimal Price { get; } = price;
    public int Stock { get; } = stock;
}

public readonly record struct BookRow(string Isbn, string Title, decimal Price, int Stock);

public static long TotalStock(List<BookEntity> books)
{
    long total = 0;
    foreach (BookEntity book in books)
    {
        total += book.Stock;
    }
    return total;
}

public static long TotalStock(BookRow[] books)
{
    long total = 0;
    foreach (BookRow book in books)
    {
        total += book.Stock;
    }
    return total;
}
Books are loaded from the database in Id order. One version of the report walks this list, another walks the same objects in a list sorted by Title, and the third works on a BookRow[]:
| Method           | Mean       | StdDev    | Ratio |
|----------------- |-----------:|----------:|------:|
| StructArray      |   533.6 us |  17.73 us |  1.00 |
| ClassListById    | 3,337.9 us |  93.15 us |  6.26 |
| ClassListByTitle | 4,240.4 us | 410.09 us |  7.95 |
The struct array is 6.3x ahead. BookRow is 40 bytes (I measured it with Unsafe.SizeOf) and the million rows sit back to back, so the scan is a plain sequential read. The array inside List<BookEntity> holds only 8-byte references, and every Stock read goes to a different object. In a small address measurement, two consecutive objects in Id order were 160 bytes apart on average, because each book's two strings were allocated together with it; every book means a new cache line, but the regular stride lets the prefetcher help. In Title order the distance between neighbouring objects averages 50 MB, the prefetcher can't keep up, and the time grows by 27 percent. GC compaction closes gaps, but it does not reorder objects to match your list.
There is no dependent chain here: the addresses come in order from the list's array, so the CPU can request many objects at once; LinkedList was the dependent version. We saw the strength of contiguous memory in the "Arrays and Dynamic Arrays in C#: Contiguous Memory, Indexing and Writing Your Own List" post of the Algorithms and Data Structures series. The practical decision: for reports and calculations that scan thousands of rows, copying the rows into a struct array or a Span<T> usually pays off; entities with identity and changing state stay classes.
In Production
It is very easy to measure RAM while you think you are measuring the disk. This method, which writes a 256 MB file and then immediately reads random 4 KB blocks from it, ran on a real SSD:
public static void Run(string path)
{
    const int FileSize = 256 * 1024 * 1024;
    const int BlockSize = 4096;
    const int Reads = 20_000;

    byte[] block = new byte[BlockSize];
    using (FileStream writer = File.Create(path))
    {
        Random.Shared.NextBytes(block);
        for (int written = 0; written < FileSize; written += BlockSize)
        {
            writer.Write(block);
        }
    }

    using Microsoft.Win32.SafeHandles.SafeFileHandle handle = File.OpenHandle(path);
    Random random = new(42);
    long[] offsets = new long[Reads];
    for (int i = 0; i < Reads; i++)
    {
        offsets[i] = (long)random.Next(FileSize / BlockSize) * BlockSize;
    }

    // Warm-up pass, then the measurement
    foreach (long offset in offsets.AsSpan(0, 1_000))
    {
        RandomAccess.Read(handle, block, offset);
    }
    Stopwatch watch = Stopwatch.StartNew();
    foreach (long offset in offsets)
    {
        RandomAccess.Read(handle, block, offset);
    }
    watch.Stop();

    double microseconds = watch.Elapsed.TotalMicroseconds / Reads;
    Console.WriteLine($"File: {FileSize / 1024 / 1024} MB, just written");
    Console.WriteLine($"Random 4 KB reads: {Reads:N0}, average {microseconds:F2} us");
}
File: 256 MB, just written
Random 4 KB reads: 20,000, average 0.61 us0.61 µs is more than a hundred times faster than the 75 µs in the datasheet. What we measured is not the SSD but the operating system's page cache: the file's pages were in RAM from the moment they were written, and every read was a system call plus a memory copy. The page cache is covered in the "How File Systems Work: Inodes, File Descriptors, the Page Cache and fsync" post of the Operating System Fundamentals series. To see real disk latency, the file has to be larger than RAM or the cache has to be cold.
Second rule: measure on the target hardware. On a Windows machine, Sysinternals' Coreinfo and WMI are enough to see the cache sizes and which cores share which cache, and the latency ladder runs from the same project. The commands below were written from Microsoft's documentation and were not run for this post:
# Cache levels, sizes, line size and sharing map
coreinfo64 -l

# L2/L3 sizes (KB) and core counts
Get-CimInstance Win32_Processor | Select-Object Name, NumberOfCores, NumberOfLogicalProcessors, L2CacheSize, L3CacheSize

# Run the latency ladder on your own machine
dotnet run -c Release -- --filter "*LatencyLadder*"
Third, a server is not a laptop. On a two-socket server, the other socket's memory is roughly twice as far away according to the Intel measurement above; this NUMA effect is covered in the "Multi-Core, Hyper-Threading and False Sharing" post of this series. In cloud VMs the L3 is shared with other workloads, and as they fill the cache your data gets evicted. The measurements in this post were also taken on a loaded machine, which is why I left StdDev in the tables. Proving in production that a problem comes from memory takes a profiler; those tools are the subject of the .NET Profiling and Diagnostics series.
Common Pitfalls
Treating a memorized latency table as absolute. The table in Peter Norvig's "Teach Yourself Programming in Ten Years" gives 0.5 ns for L1, 100 ns for main memory and 8 ms for a disk seek. The orders of magnitude are still instructive, but the table has no L3 or SSD row and its disk row belongs to the era of spinning platters. What is worth remembering today is the ratios between layers, not the numbers; always measure the numbers on your own hardware.
Letting the benchmark data fit in the cache. In the 16 KB test, shuffled access was as fast as sequential access; conclude "access order doesn't matter" from that and the 2 GB of production data will surprise you. Measure several sizes together with [Params] and put at least one well above the L3.
Moving everything to stackalloc because "the stack is fast". Read speed is the same; the only gain is on the allocation and GC side. The stack is a limited region measured in megabytes, and if it overflows the process dies with a StackOverflowException that cannot be caught. Use the stack for small buffers of known size, and ArrayPool<T> or a reused array for the rest.
A Small Experiment
★☆☆ Add 128, 512, 2,048, 4,096, 16,384 and 32,768 KB to the [Params] of LatencyLadder. Find the sizes where the time per step jumps and compare them with the L1, L2 and L3 sizes coreinfo64 -l reports on Windows. Do the jumps happen exactly at the cache size or slightly before?
★★☆ Write a variant of ShuffledIndexes: split the array into blocks of 16 elements (64 bytes), shuffle the order of the blocks but keep the order inside each block. At 256 MB, where does the ratio of 13.4 drop to? What happens when the block size grows to 1,024 elements? Explain the result with spatial locality and the prefetcher.
★★★ Add a Next reference to BookEntity and link the books into a chain in Title order. Compare a version that computes total stock by following this chain with ClassListByTitle. Both read the same objects in the same order; explain the difference with the latency ladder and with independent misses being waited on in parallel.
The next post, "How CPU Caches Work: Cache Lines, Associativity and Cache-Friendly C#", opens up the cache itself: which set an address falls into, the difference between walking a 2D array by rows or by columns, and the choice between Array of Structs and Struct of Arrays for a report that only scans Price.