

Multi-Core, Hyper-Threading and False Sharing: Why More Cores Don't Scale Linearly

More cores don't scale performance linearly because cores share cache lines, memory bandwidth and execution units. In a four-worker Bookstore counter, a shared Interlocked counter runs 15x slower, adjacent per-worker slots can't beat a single thread because of false sharing, padding and local variables fix it, Environment.ProcessorCount follows container CPU limits, and Hyper-Threading and P/E cores change the picture.
Version note: The code in this post was built and run with .NET 10 (C# 14); measurements were taken with BenchmarkDotNet 0.15.8 and tests with xUnit v3 4.0.3 on an ARM64 Apple M5 / macOS 27 / .NET 10.0.13. The x64 assembly listings come from code generated by the .NET 10.0.15 JIT in a Linux x64 container.
Guess First
Bookstore's nightly order-processing job runs with four workers. Each worker processes a slice of 50 million orders and counts how many it has processed. A single thread could do the same 200 million increments. The team has four proposals: everyone increments one shared counter with Interlocked.Increment; each worker gets its own slot in a long[]; the same idea, but each slot is a 128-byte struct; or everyone counts in a local variable and writes once at the end.
Which one is slower than a single thread? Which one finishes in exactly the same time as a single thread? At best, how much faster do four workers make the job? You'll see the answers in the measurement halfway through; I can already tell you two of them are surprises. I took the measurements on the only real hardware I have, Apple's ARM64-based M5; we won't dwell on ARM64 details, and I'll cover the x64 side from Intel and .NET documentation.
How Many Cores Does the Machine Have? Cores, Logical Processors and SMT
First, the hardware itself. On macOS sysctl gives you this information, on Linux lscpu:
$ sysctl hw.ncpu hw.physicalcpu hw.logicalcpu hw.perflevel0.name hw.perflevel0.physicalcpu hw.perflevel1.name hw.perflevel1.physicalcpu hw.cachelinesize
hw.ncpu: 10
hw.physicalcpu: 10
hw.logicalcpu: 10
hw.perflevel0.name: Super
hw.perflevel0.physicalcpu: 4
hw.perflevel1.name: Efficiency
hw.perflevel1.physicalcpu: 6
hw.cachelinesize: 128
A physical core is an independent execution unit with its own pipeline, registers and L1 cache. This machine has 10 of them and shows 10 logical processors, so each core appears to the operating system as one CPU. But the cores are not equal: 4 are high-performance cores (sysctl calls them "Super") and 6 are efficiency cores. The same loop runs at different speeds in these two groups.
On an x64 Windows machine you usually see a different picture: the Performance tab of Task Manager shows the number of cores and the number of logical processors separately, for example 8 and 16. The difference is SMT, simultaneous multithreading, which Intel calls Hyper-Threading. One physical core appears as two logical processors. Each logical processor has its own architectural state (registers, program counter), but the execution units, the L1 and L2 caches and the branch predictor are shared. The idea is that while one thread waits for data from memory, the other thread uses the idle execution units. So two threads on the same core get more total work done, but not twice as much; if both are compute-bound, the gain stays small.
Two more trends from recent years. Since its 12th generation (Alder Lake, 2021), Intel uses a hybrid architecture: P-cores (performance) with Hyper-Threading and E-cores (efficiency) without it on the same chip. Intel's Lunar Lake and the desktop Core Ultra 200S (Arrow Lake) families dropped Hyper-Threading from the P-cores altogether. AMD's Zen cores keep SMT. The Apple M series has never used SMT and works with a P/E core split. So "16 logical processors" can mean 16 equal cores, 8 cores × 2 threads, or 6 P + 8 E cores, which are very different things.
Large servers add one more layer: NUMA, non-uniform memory access. In a multi-socket machine each socket has its own memory controller; a core reads RAM attached to its own socket faster than RAM attached to another socket. Windows also splits more than 64 logical processors into "processor groups"; in .NET the DOTNET_Thread_UseAllCpuGroups setting decides whether the thread pool spreads across all groups, and it is enabled by default on Windows 11. The measurements in this post come from a single-socket machine; just add NUMA to the list of reasons why the same core count doesn't behave the same on every machine.
Environment.ProcessorCount and the CPU Limit in a Container
.NET itself tells you how many cores it sees through Environment.ProcessorCount. The thread pool's minimum thread count and Server GC's heap count are derived from this number. A small program:
using System.Runtime.InteropServices;

Console.WriteLine($"OS/Arch        : {RuntimeInformation.OSDescription} / {RuntimeInformation.ProcessArchitecture}");
Console.WriteLine($"ProcessorCount : {Environment.ProcessorCount}");
ThreadPool.GetMinThreads(out int workerThreads, out _);
Console.WriteLine($"ThreadPool min : {workerThreads}");
I ran it directly first, then ran the same compiled dll in a Docker container with different CPU limits:
$ dotnet out/cpuinfo.dll
OS/Arch        : macOS 27 / Arm64
ProcessorCount : 10
ThreadPool min : 10

$ DOTNET_PROCESSOR_COUNT=3 dotnet out/cpuinfo.dll
OS/Arch        : macOS 27 / Arm64
ProcessorCount : 3
ThreadPool min : 3

$ docker run --rm -v "$PWD/out":/app mcr.microsoft.com/dotnet/sdk:10.0 dotnet /app/cpuinfo.dll
OS/Arch        : Ubuntu 24.04.5 LTS / Arm64
ProcessorCount : 10
ThreadPool min : 10

$ docker run --rm --cpus=1.5 -v "$PWD/out":/app mcr.microsoft.com/dotnet/sdk:10.0 dotnet /app/cpuinfo.dll
OS/Arch        : Ubuntu 24.04.5 LTS / Arm64
ProcessorCount : 2
ThreadPool min : 2

$ docker run --rm --cpuset-cpus=0-2 -v "$PWD/out":/app mcr.microsoft.com/dotnet/sdk:10.0 sh -c 'nproc; dotnet /app/cpuinfo.dll'
3
OS/Arch        : Ubuntu 24.04.5 LTS / Arm64
ProcessorCount : 3
ThreadPool min : 3
The rule is on the Microsoft Learn reference page: ProcessorCount is the smallest of three values: the number of logical processors on the machine, the number of processors the process is affinitized to if it has CPU affinity, and the CPU utilization limit rounded up if there is one. That rounding is why --cpus=1.5 turns into 2. The value is computed once when the runtime starts and doesn't change for the life of the process. On Windows this behavior arrived with .NET 6: since then the process affinity and the job object's hard CPU limit are taken into account too. The DOTNET_PROCESSOR_COUNT environment variable overrides all of this and tells the runtime "you have this many CPUs".
Two consequences follow. First, ProcessorCount is not the number of physical cores: on an 8-core laptop with Hyper-Threading it returns 16, and it doesn't show the P/E split at all. Second, the CPU limit you give a container directly changes .NET's thread and GC decisions. We measured the relationship between limits, throttling and the GC in detail in the Kubernetes series post "Resource Requests and Limits: QoS, OOMKilled, CPU Throttling and the .NET GC in Containers".
Cache Coherence: How Do Cores Share the Same Line?
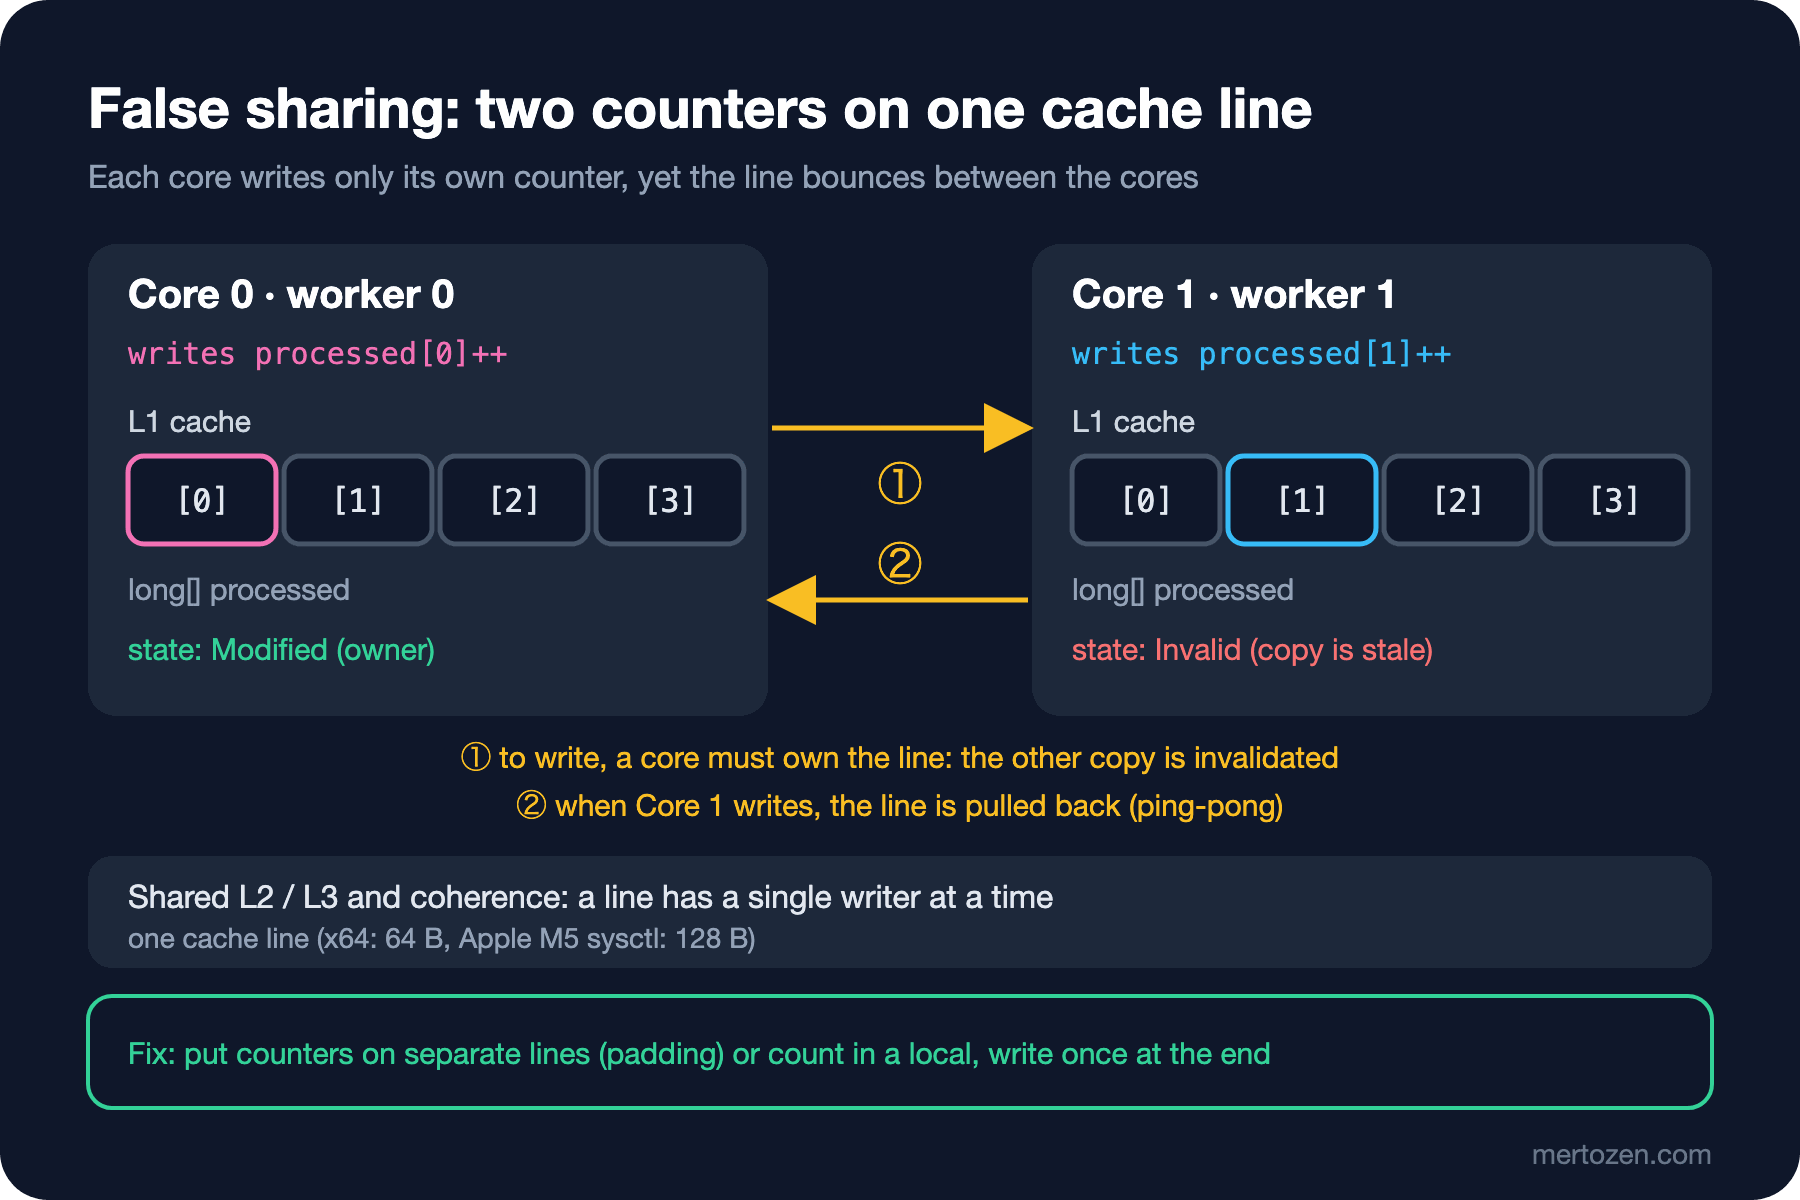
Each core has its own L1 cache; in most x64 designs L2 is per-core as well, while L3 is shared. Memory doesn't arrive in the cache byte by byte but in the cache lines we saw in the series post "How CPU Caches Work: Cache Lines, Associativity and Cache-Friendly C#". If two cores read the same line, there's no problem: each holds a copy. The trouble starts with writes. To write to a line, a core must be its sole owner; the hardware invalidates the copies in other cores. When the other core touches the same line again, it asks for the line back and ownership changes hands.
The family of protocols that manages this handshake is called MESI, after the initials of the states a line can be in: Modified, Exclusive, Shared and Invalid. The intuition we need is this: if several cores take turns writing to the same line, the line bounces between the cores, which is called cache line ping-pong, and every round trip is very expensive compared to an L1 read. The correctness side of the protocol, that is, the order in which writes become visible to other cores and reordering, is the topic of the Concurrency Theory series post "Hardware Memory Models: Reordering, Store Buffers, Cache Coherence and Sequential Consistency". Here we only look at performance.
False Sharing: Sharing Data You Don't Share
The second proposal from the guessing question, the version that gives each worker its own slot:
public static class OrderCounters
{
    // Each worker increments its own slot, but the slots sit side by side: false sharing
    public static long CountAdjacent(int workers, int ordersPerWorker)
    {
        long[] processed = new long[workers];
        Parallel.For(0, workers, w =>
        {
            for (int i = 0; i < ordersPerWorker; i++)
            {
                processed[w]++;
            }
        });
        return processed.Sum();
    }
}
Logically, no data is shared: worker 0 only touches processed[0], worker 1 only processed[1], no lock is needed and the result is always correct. But four longs take 32 bytes in total and sit next to each other in memory; they all fit in a single cache line. Since every processed[w]++ is a write, the line may want to move to another core on every iteration. You are sharing data at the hardware level that you don't share in your code; this is called false sharing.
The inner loop the JIT generates for x64 shows it plainly. Tier1-OSR in the listing is the on-stack replacement version, the optimized code the loop switches to while it is running; the details are in the Compilers and Programming Languages series:
; Assembly listing for method Bookstore.Cores.OrderCounters+<>c__DisplayClass0_0:<CountAdjacent>b__0(int):this (Tier1-OSR)
; Emitting BLENDED_CODE for generic X64 + VEX on Unix
G_M000_IG04:                ;; offset=0x0020
       mov      r8, gword ptr [rax+0x08]
       cmp      ecx, dword ptr [r8+0x08]
       jae      SHORT G_M000_IG06
       lea      r8, bword ptr [r8+8*rsi+0x10]
       inc      qword ptr [r8]
       inc      edx
       cmp      edx, edi
       jl       SHORT G_M000_IG04
inc qword ptr [r8] is a single instruction, but it performs a read-modify-write in memory and writes to that line on every iteration. On ARM64 the same line becomes an ldr, add, str trio; the behavior is the same. I took these listings in a Linux x64 container; on Windows x64 the only difference is which registers the parameters arrive in, the loop body is the same. These listings only show the generated code; the timings come from the measurement machine named in the post.
Measuring: Four Workers, Four Strategies
The other two proposals: one shared counter and a local variable.
// One shared counter: correct, but every core fights over the same line
public static long CountShared(int workers, int ordersPerWorker)
{
    long processed = 0;
    Parallel.For(0, workers, _ =>
    {
        for (int i = 0; i < ordersPerWorker; i++)
        {
            Interlocked.Increment(ref processed);
        }
    });
    return processed;
}

// The real fix: count in a local variable, write once at the end
public static long CountLocal(int workers, int ordersPerWorker)
{
    long[] processed = new long[workers];
    Parallel.For(0, workers, w =>
    {
        long local = 0;
        for (int i = 0; i < ordersPerWorker; i++)
        {
            local++;
        }
        processed[w] = local;
    });
    return processed.Sum();
}
I'll unpack the padded version in the next section; for now, just know that each slot is a 64- or 128-byte struct. The benchmark class calls each strategy with four workers and 50 million orders per worker; the baseline is CountSingleThread, which does the same 200 million increments on a single thread. A separate xUnit test for each strategy verifies that the total is correct.
public class CounterBenchmarks
{
    private const int Workers = 4;
    private const int OrdersPerWorker = 50_000_000;

    [Benchmark(Baseline = true)]
    public long SingleThread() => OrderCounters.CountSingleThread(Workers, OrdersPerWorker);

    [Benchmark]
    public long Shared() => OrderCounters.CountShared(Workers, OrdersPerWorker);

    [Benchmark]
    public long Adjacent() => OrderCounters.CountAdjacent(Workers, OrdersPerWorker);

    [Benchmark]
    public long Padded64() => OrderCounters.CountPadded64(Workers, OrdersPerWorker);

    [Benchmark]
    public long Padded128() => OrderCounters.CountPadded(Workers, OrdersPerWorker);

    [Benchmark]
    public long Local() => OrderCounters.CountLocal(Workers, OrdersPerWorker);
}
BenchmarkDotNet v0.15.8, macOS 27
Apple M5, 1 CPU, 10 logical and 10 physical cores
.NET SDK 10.0.402
[Host] : .NET 10.0.13 (10.0.13, 10.0.1326.50504), Arm64 RyuJIT armv8.0-a
IterationCount=15 WarmupCount=3
| Method | Mean | Error | StdDev | Ratio | RatioSD |
|------------- |------------:|----------:|----------:|------:|--------:|
| SingleThread | 120.38 ms | 24.044 ms | 20.078 ms | 1.04 | 0.29 |
| Shared | 1,792.79 ms | 82.392 ms | 73.038 ms | 15.44 | 3.51 |
| Adjacent | 117.86 ms | 13.318 ms | 12.458 ms | 1.02 | 0.25 |
| Padded64 | 71.86 ms | 1.036 ms | 0.809 ms | 0.62 | 0.14 |
| Padded128 | 69.24 ms | 2.345 ms | 2.193 ms | 0.60 | 0.13 |
| Local | 12.44 ms | 0.255 ms | 0.238 ms | 0.11 | 0.02 |An honest note: the machine wasn't idle during this measurement; uptime showed a load average between 8 and 15 throughout. The parallel rows may therefore be worse than they should be; the ranking and the rough ratios didn't change across several runs.
The answers to the guesses are in the table. The shared counter is 15 times slower than a single thread. On x64, Interlocked.Increment in this loop becomes a lock inc qword ptr [rdx] instruction, and on ARM64 the ldaddal atomic instruction. Every iteration means both an atomic operation and the line changing hands between cores. The result is correct, but the four cores are waiting on each other.
The second surprise: the adjacent-slot version finished in the same time as the single thread (117.9 ms versus 120.4 ms). We bought four cores and gained nothing. The same loop drops to 69 ms once the slots land on separate lines. The real winner is the local variable: the counter lives in a register and the loop never writes to memory; it is roughly 10 times faster than the single thread and 5.6 times faster than the padded version. The most effective fix for false sharing isn't padding, it's not writing to shared memory often.
How Many Bytes of Padding: 64 or 128?
The padded slots are fixed-size structs declared with StructLayout:
// 128 bytes: the value the .NET runtime picks for ARM64; a pair of lines on x64
[StructLayout(LayoutKind.Explicit, Size = 128)]
public struct PaddedCounter
{
    [FieldOffset(0)] public long Value;
}

// Only 64 bytes: the size of an x64 cache line
[StructLayout(LayoutKind.Explicit, Size = 64)]
public struct PaddedCounter64
{
    [FieldOffset(0)] public long Value;
}

public static long CountPadded(int workers, int ordersPerWorker)
{
    PaddedCounter[] processed = new PaddedCounter[workers];
    Parallel.For(0, workers, w =>
    {
        for (int i = 0; i < ordersPerWorker; i++)
        {
            processed[w].Value++;
        }
    });
    long total = 0;
    foreach (PaddedCounter counter in processed)
    {
        total += counter.Value;
    }
    return total;
}
We covered the details of struct layout in the fourth post of the series; what matters here is the distance between two neighboring counters. Instead of guessing it, I pinned it down with a test:
[Fact]
public void Padded_counters_are_a_cache_line_apart()
{
    Assert.Equal(128, Unsafe.SizeOf<PaddedCounter>());
    Assert.Equal(64, Unsafe.SizeOf<PaddedCounter64>());

    PaddedCounter[] counters = new PaddedCounter[2];
    nint distance = Unsafe.ByteOffset(ref counters[0].Value, ref counters[1].Value);
    Assert.Equal(128, (int)distance);
}
On the x64 side, the cache line on Intel and AMD processors is 64 bytes; 64 bytes of padding is enough to put neighbors on separate lines. But Intel's optimization reference manual describes a spatial prefetcher in L2: when a line is brought into L2, it tries to bring along the partner line that completes the 128-byte aligned block. So two hot counters 64 bytes apart can still disturb each other through prefetch traffic if they sit in the same 128-byte block. That is why some libraries pad to 128 bytes on x64 too. .NET's own choice is simpler: the PaddingHelpers.CACHE_LINE_SIZE constant in dotnet/runtime is 128 on ARM64 and LoongArch64 and 64 on the other architectures, x64 included. The PaddedHeadAndTail struct in the segment of ConcurrentQueue<T> separates the Tail written by producers from the Head written by consumers by this constant, and puts padding in front of the first field as well.
So is 64 not enough on the M5, where sysctl says 128? In the benchmark there is no meaningful difference between Padded64 and Padded128 (71.9 ms versus 69.2 ms). To be sure, I wrote a small experiment where two threads write to two counters a given distance apart in native memory aligned to 256 bytes:
using System.Diagnostics;
using System.Runtime.InteropServices;

unsafe
{
    // Native memory aligned to 256 bytes: we decide which line each counter lands on
    long* buffer = (long*)NativeMemory.AlignedAlloc(1024, 256);

    long Run(int distanceBytes, int iterations)
    {
        long* first = buffer;
        long* second = buffer + distanceBytes / sizeof(long);
        *first = 0;
        *second = 0;
        Thread a = new(() =>
        {
            for (int i = 0; i < iterations; i++)
                Volatile.Write(ref *first, Volatile.Read(ref *first) + 1);
        });
        Thread b = new(() =>
        {
            for (int i = 0; i < iterations; i++)
                Volatile.Write(ref *second, Volatile.Read(ref *second) + 1);
        });
        Stopwatch sw = Stopwatch.StartNew();
        a.Start();
        b.Start();
        a.Join();
        b.Join();
        return sw.ElapsedMilliseconds;
    }

    for (int round = 0; round < 3; round++)
    {
        foreach (int d in new[] { 8, 32, 56, 64, 96, 120, 128, 256 })
        {
            Console.Write($"{d}B={Run(d, 100_000_000)}ms ");
        }
        Console.WriteLine();
    }
}
8B=462ms 32B=469ms 56B=444ms 64B=202ms 96B=276ms 120B=212ms 128B=179ms 256B=174ms
8B=467ms 32B=470ms 56B=466ms 64B=168ms 96B=171ms 120B=171ms 128B=174ms 256B=173ms
8B=457ms 32B=463ms 56B=466ms 64B=168ms 96B=168ms 120B=168ms 128B=168ms 256B=169ms The boundary is clearly at 64 bytes: up to 56 bytes the two threads do the same work 2.8 times slower, and at 64 and above the difference disappears (the fluctuation in the first round is warm-up and machine load). So on this chip the line size the operating system reports and the unit coherence actually works on did not turn out to be the same. Apple doesn't document this; the lesson is: don't take a padding value from a table or a single system call, measure on the target hardware. On Windows x64 the safe choice is .NET's 64, or 128 if you suspect the prefetcher effect.
Why Doesn't Performance Scale Linearly With Core Count?
We removed false sharing and the shared counter. What's left is the cleanest version: a local counter, zero sharing. Here the total work is fixed at 400 million increments and only the number of workers changes:
public class ScalingBenchmarks
{
    private const int TotalOrders = 400_000_000;

    [Params(1, 2, 4, 8, 10)]
    public int Workers { get; set; }

    // Total work is fixed, the worker count changes
    [Benchmark]
    public long Local() => OrderCounters.CountLocal(Workers, TotalOrders / Workers);
}
| Method | Workers | Mean | Error | StdDev |
|------- |-------- |----------:|---------:|---------:|
| Local | 1 | 103.60 ms | 3.859 ms | 3.223 ms |
| Local | 2 | 51.72 ms | 1.220 ms | 1.141 ms |
| Local | 4 | 27.98 ms | 2.632 ms | 2.462 ms |
| Local | 8 | 22.03 ms | 2.460 ms | 2.301 ms |
| Local | 10 | 18.47 ms | 4.419 ms | 4.133 ms |From 1 to 2 we get exactly 2x, to 4 we get 3.7x. Then the gains slow down: 8 workers give only 4.7x, 10 workers 5.6x. On this machine the first reason is clear: there are four fast cores, from the fifth worker on the slower E-cores take work, and Parallel.For waits until the slowest worker finishes. The second is the other load on the machine; other processes want the fast cores too.
Add the x64 items I couldn't measure on this machine to the general list. On a machine with Hyper-Threading, ProcessorCount counts logical processors; two compute-bound threads sharing a core compete for the execution units and don't deliver 2x. Many processors lower their clock speed when many cores are active; the turbo frequency they give one core can't be given to all of them. L3 cache and memory bandwidth are shared; memory-bound work hits the bandwidth limit before it runs out of cores. Finally, every parallel piece of code has a serial part (distributing the work, waking threads, collecting results); the ceiling it imposes is calculated with Amdahl's law, explained in the Concurrency Theory series post "Concurrency vs Parallelism: Interleaving, Nondeterminism and Amdahl's Law". Parallel.For itself and when to use it are covered in the C# Asynchronous Programming series post "C# Parallelism".
In Production
False sharing is rarely this naked in real code. Typical places: arrays holding per-thread statistics (request counts, error counts, byte counts), a class carrying two hot fields written by different threads next to each other (a producer's _tail and a consumer's _head), or a field one thread writes constantly living in the same object as a field other threads read constantly. The reading side wants the line too; the writer isn't the only culprit. First try accumulating locally and writing rarely, then ready-made solutions (BCL types such as ConcurrentQueue that already pad), and manual padding last.
Give containers CPU limits deliberately: the limit changes ProcessorCount, which in turn changes the thread pool and Server GC. Use DOTNET_PROCESSOR_COUNT only when you have measured why you need it. Don't tie the worker count to a fixed value like 16; derive it from ProcessorCount and don't go above it, since the excess turns into the operating system taking turns running threads (context switches). How scheduling works is covered in the Operating System Fundamentals series.
Measure on the target hardware. A laptop with hybrid cores, a server with 32 logical processors and Hyper-Threading on, and a pod limited to 2 vCPUs draw three different curves for the same code. Confirming a false sharing suspicion in production needs CPU profiles and hardware counters; those are the subject of the .NET Profiling and Diagnostics series.
Common Pitfalls
- The parallel version being slower than a single thread: one shared counter or a frequently taken lock lines every core up on the same line. In the measurement that meant a 15x slowdown.
- Inflating every counter to 128 bytes: with thousands of counters it wastes memory and cache; apply padding only to the few fields that different threads really write often.
- Forgetting the start of the array: in .NET an array's length sits right before the first element; if you leave the first slot unpadded, threads reading
Lengthand the thread writing the first slot can share a line. That is whyPaddedHeadAndTailalso puts space in front of its first field. - Assuming
ProcessorCountis the number of physical cores: with Hyper-Threading it is twice that, in a container it is the rounded-up limit, and ifDOTNET_PROCESSOR_COUNTis set it is whatever was written there. - Measuring on a laptop and generalizing to the server: core types, turbo behavior, SMT and NUMA differ; the 2.8x false sharing penalty here comes out differently on another chip.
A Small Experiment
★☆☆ Set Workers in CounterBenchmarks to 2 and 8. How does the ratio between Adjacent and Padded128 change? With 8 workers, do eight longs still fit in a single 64-byte line?
★★☆ Run cpuinfo on your own Windows machine, then compare it with Get-CimInstance Win32_Processor | Select-Object NumberOfCores, NumberOfLogicalProcessors in PowerShell. If Hyper-Threading is on, which one does ProcessorCount equal? Run ScalingBenchmarks up to twice the number of physical cores and see where the speedup slows down.
★★★ Run the distance experiment from 8 to 256 bytes on an x64 machine. Is the boundary at 64? Between 64 and 128, do you see a small difference you might expect from the spatial prefetcher? Repeat the experiment with the two threads pinned to the two logical processors of the same physical core: does the false sharing penalty shrink, and why?
In this post we looked for parallelism across cores and ran into the hardware's shared resources. The last post of the series, "SIMD and Vectorization: Processing Many Values at Once with Vector128/256/512 and TensorPrimitives", looks for parallelism inside a single core with SIMD: adding 4, 8 or 16 values with one instruction.