

How a Line of C# Runs on the CPU: From Source to IL, Assembly and Instructions
A line of C# reaches the CPU through two translations: Roslyn turns it into IL, and at run time the JIT turns that into machine code for the machine's ISA, which the CPU runs in a fetch-decode-execute cycle. We read the 30-byte x64 Tier-1 code of TotalQuantity line by line, compare it with its ARM64 version, the 789-byte decimal version and an unoptimized Tier-0 measurement, and explain the x86-64-v2 baseline in .NET 11.
Version note: The code in this post was built and run with .NET 10 (C# 14); tests were written with xUnit v3 4.0.3. The x64 assembly listings come from the .NET 10.0.15 runtime on Linux x64 and from crossgen2 10.0.13 targeting Windows x64; the Arm listings and the measurements were taken with BenchmarkDotNet 0.15.8 on an Apple M5 / macOS 27 / .NET 10.0.13. The .NET 11 details are based on the official documentation for the stable release shipped on 10 November 2026.
Guess First
Bookstore's order service has this line: total += item.Quantity;. It adds up the number of books in an order. Two questions for you. First: how many times is this line translated into another language before it reaches the CPU? Second: when its sibling, total += item.UnitPrice * item.Quantity;, which sums decimal prices, is turned into machine code, how much bigger does it get: two times, five times, twenty times?
And a third, sneakier question: the same dll runs on a Windows x64 server and on an ARM64 laptop. Are the instructions executed on the two machines the same? This post answers all three with real JIT output. Everything we discuss in the rest of the series (the pipeline, caches, multiple cores and SIMD) builds on the picture we set up here.
Layer by Layer: From C# to IL
First, the code we will work with. Bookstore's order line is a record struct, and both methods walk an array in a single pass:
using System.Runtime.CompilerServices;

namespace Bookstore.Disasm;

public readonly record struct OrderItem(string Isbn, decimal UnitPrice, int Quantity);

public static class OrderMath
{
    [MethodImpl(MethodImplOptions.NoInlining)]
    public static decimal TotalPrice(OrderItem[] items)
    {
        decimal total = 0m;
        foreach (OrderItem item in items)
        {
            total += item.UnitPrice * item.Quantity;
        }
        return total;
    }

    [MethodImpl(MethodImplOptions.NoInlining)]
    public static int TotalQuantity(OrderItem[] items)
    {
        int total = 0;
        foreach (OrderItem item in items)
        {
            total += item.Quantity;
        }
        return total;
    }
}
NoInlining is only there for the experiment: it stops the method from being folded into its caller, so we can see it on its own in the JIT output. When you run dotnet build, Roslyn, the C# compiler, does not turn this code into machine code. It turns it into IL, the processor-independent intermediate language of .NET. Opening the compiled dll with ilspycmd 11.2 shows the loop of TotalQuantity like this:
IL_0008: ldloc.1
IL_0009: ldloc.2
IL_000a: ldelem Bookstore.Disasm.OrderItem
IL_000f: stloc.3
IL_0010: ldloc.0
IL_0011: ldloca.s 3
IL_0013: call instance int32 Bookstore.Disasm.OrderItem::get_Quantity()
IL_0018: add
IL_0019: stloc.0
IL_001a: ldloc.2
IL_001b: ldc.i4.1
IL_001c: add
IL_001d: stloc.2
IL_001e: ldloc.2
IL_001f: ldloc.1
IL_0020: ldlen
IL_0021: conv.i4
IL_0022: blt.s IL_0008
IL is a stack machine language: ldloc pushes a local onto the evaluation stack, add pops the top two values and pushes their sum. No registers, no processor, not even how many bytes an element takes in memory. The foreach has been lowered to an index loop, and the property access is still a real call. That is 38 bytes of IL. No CPU understands this, so one more compiler is needed at run time.
The Only Thing a CPU Does: Fetch, Decode, Execute
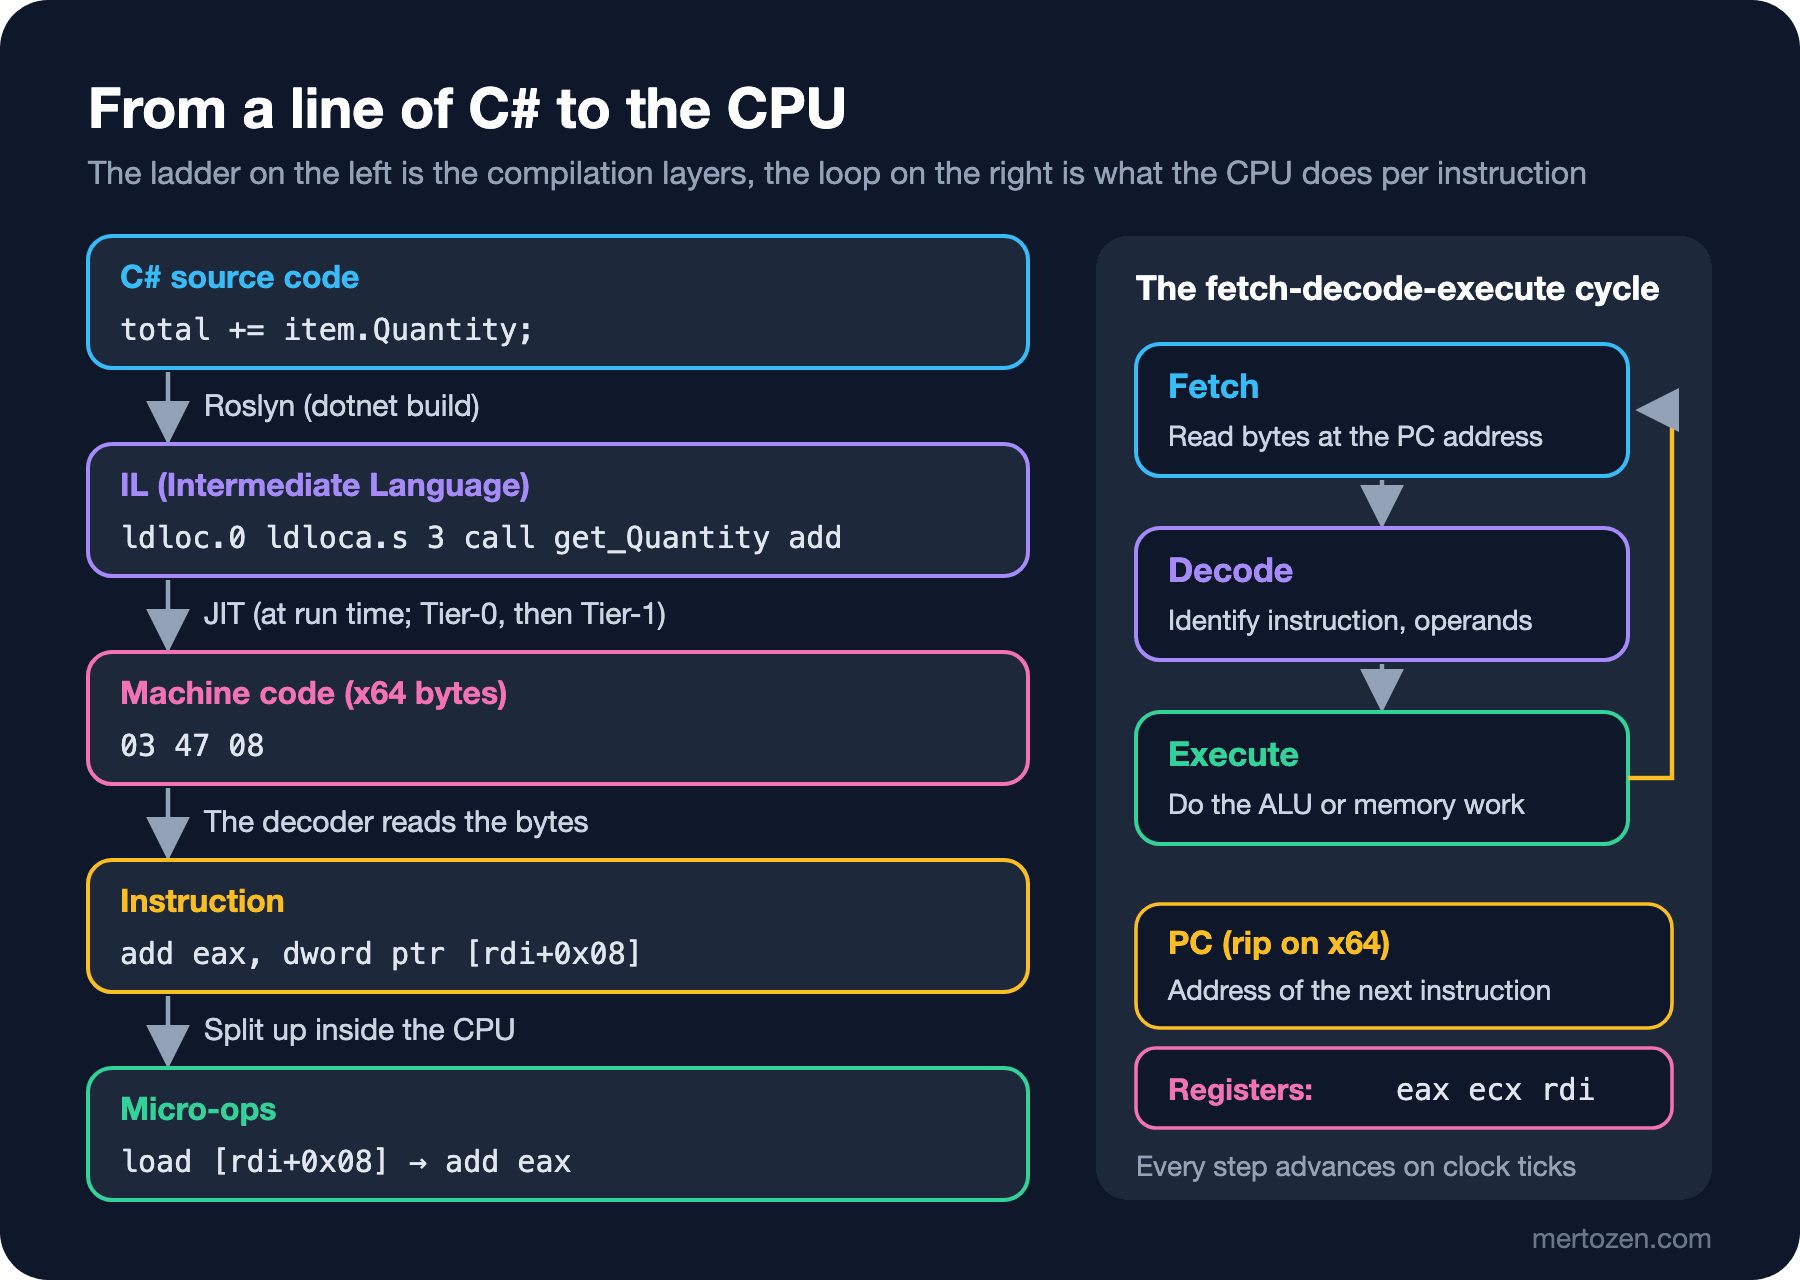
That compiler is the JIT: when a method is called for the first time, it translates the IL into code for that particular machine. What the JIT produces is machine code: bytes written to memory. From the CPU's point of view a program is nothing more than those bytes sitting in one region of memory. The data sits in another region of the same memory. The idea of keeping program and data in the same memory and letting the processor reach both the same way is known as the von Neumann architecture, named after John von Neumann's 1945 report on the EDVAC, one of the first stored-program computer designs.
Inside the CPU there are a few special boxes. Registers are named, tiny and very fast storage slots inside the processor: x64 has 16 general-purpose registers such as rax, rcx and rdi, ARM64 has x0–x30. The program counter (called rip on x64) holds the address of the next instruction. The CPU runs an endless loop: it reads the bytes the program counter points to (fetch), works out which instruction they are and which registers it uses (decode), does the work (execute) and moves the program counter on to the next instruction. A jump instruction is the only thing that breaks this order: it writes a new address into the program counter. Loops, if statements and method calls all come down to this at the machine level.
The clock sets the pace of these steps. On a 4 GHz core one clock cycle takes 0.25 nanoseconds. A modern core can work on more than one instruction in the same cycle; how that works is the subject of the next post in the series, "CPU Pipelines and Branch Prediction: Why Is a Sorted Array Processed Faster?". The model to keep in mind here is simple: read bytes, decode, execute, move on.
One level further down, registers and adders are logic gates (AND, OR, NOT and so on) built from transistors. The Nand2Tetris project, based on The Elements of Computing Systems by Noam Nisan and Shimon Schocken, shows step by step how a whole computer can be built starting from nothing but the NAND gate, and it is the best starting point if you are curious about that layer. This series does not go down there; for us the lowest layer is the instruction.
Seeing the Assembly the JIT Produces
You do not need an extra tool to see what the JIT produces. Since .NET 7 the DOTNET_JitDisasm environment variable also works with the release runtime. First, a small program that calls the methods often enough:
using Bookstore.Disasm;

OrderItem[] items =
[
    new("978-0135957059", 42.50m, 2),
    new("978-1617294532", 39.99m, 1),
    new("978-0321125217", 54.90m, 3),
];

// Call the methods often enough to trigger the Tier-0 to Tier-1 transition
for (int round = 0; round < 3; round++)
{
    for (int i = 0; i < 1_000; i++)
    {
        OrderMath.TotalPrice(items);
        OrderMath.TotalQuantity(items);
    }
    Thread.Sleep(300);
}

Console.WriteLine($"TotalPrice    = {OrderMath.TotalPrice(items)}");
Console.WriteLine($"TotalQuantity = {OrderMath.TotalQuantity(items)}");
On Windows you run it from PowerShell like this (on Linux you put the same variable in front of the command: DOTNET_JitDisasm="TotalQuantity" dotnet run -c Release):
$env:DOTNET_JitDisasm = "TotalQuantity"
$env:DOTNET_JitDisasmWithCodeBytes = "1"
dotnet run -c Release
You will see more than one listing for the same method, because .NET first compiles a method quickly and without optimizations (Tier-0), and once it sees that the method is called a lot, it recompiles it with optimizations in the background (Tier-1). The code that really runs is Tier-1. Here is the Tier-1 code produced by .NET 10.0.15 on Linux x64, with its bytes:
; Assembly listing for method Bookstore.Disasm.OrderMath:TotalQuantity(Bookstore.Disasm.OrderItem[]):int (Tier1)
; Emitting BLENDED_CODE for generic X64 + VEX on Unix
G_M000_IG01:                ;; offset=0x0000
       55                   push     rbp
       488BEC               mov      rbp, rsp
G_M000_IG02:                ;; offset=0x0004
       33C0                 xor      eax, eax
       8B4F08               mov      ecx, dword ptr [rdi+0x08]
       85C9                 test     ecx, ecx
       7E0F                 jle      SHORT G_M000_IG05
G_M000_IG03:                ;; offset=0x000D
       4883C710             add      rdi, 16
G_M000_IG04:                ;; offset=0x0011
       034708               add      eax, dword ptr [rdi+0x08]
       4883C720             add      rdi, 32
       FFC9                 dec      ecx
       75F5                 jne      SHORT G_M000_IG04
G_M000_IG05:                ;; offset=0x001C
       5D                   pop      rbp
       C3                   ret
; Total bytes of code 30
38 bytes of IL became 30 bytes of machine code. Let's read it line by line. xor eax, eax zeroes the total; eax is also the return value register, so total lives in a register from start to finish and is never written to memory. mov ecx, dword ptr [rdi+0x08] reads the array's length: rdi holds the address of the array object, the first 8 bytes are a pointer to its type information and the length sits at byte 8. add rdi, 16 moves the pointer to the first element.
The loop itself is four instructions. add eax, dword ptr [rdi+0x08] reads Quantity from byte 8 of the element straight from memory and adds it to the total. add rdi, 32 moves to the next element: an OrderItem is 32 bytes in memory (a string reference, an int and a 16-byte decimal; why the fields end up in this order is covered under struct layout in the series post "How CPU Caches Work"). dec ecx and jne decrement the counter and jump back if it is not zero. The get_Quantity call is gone, and so is the bounds check that verifies the index stays inside the array: the JIT proved that the counter is derived from the length, so it removed the check.
On Windows x64 the body is the same; only the registers differ. The Microsoft x64 calling convention passes the first four integer arguments in rcx, rdx, r8 and r9, while the System V convention used by Linux and macOS uses rdi, rsi, rdx, rcx. Compiling the same method for Windows x64 with crossgen2 gives a loop of add eax, dword ptr [rcx+0x08], add rcx, 32, dec edx, jne. The Tier-1 listing you get on your own Windows machine should be the counterpart of these four lines.
ISA: The Same IL, Two Different Machine Languages
Which instructions a CPU understands, how they are encoded in bytes and which registers exist are defined by its ISA. Intel and AMD processors speak the x86-64 ISA; the Apple M series, Amazon's Graviton servers and Windows on Arm devices speak ARM64. Run the same dll on an Apple M5 and the JIT produces completely different bytes from the same IL:
G_M000_IG04:                ;; offset=0x0020
        B9400803          ldr     w3, [x0, #0x08]
        0B010061          add     w1, w3, w1
        91008000          add     x0, x0, #32
        51000442          sub     w2, w2, #1
        35FFFF82          cbnz    w2, G_M000_IG04
Two differences stand out. The first is length: on ARM64 every instruction is exactly 4 bytes, while on x64 it ranges from 1 to 15 bytes (above, pop rbp is 1 byte and add rdi, 32 is 4). A fixed length means the decoder knows where the next instruction starts without working it out. A variable length means denser code: the x64 version is 30 bytes, the ARM64 version 64. The second is the division of labour: on x64 a single add both reads from memory and adds. ARM64 is a load/store architecture; arithmetic only works on registers, and reading memory needs a separate ldr.
Textbooks describe this split as CISC, where one instruction does a lot of work, versus RISC, which works with a small number of simple, fixed-size instructions. Today the line is blurry: modern x64 cores break complex instructions into simpler internal steps called micro-ops, and those micro-ops are what actually run. add eax, dword ptr [rdi+0x08] travels through the core as a load and an add, so x64 shows a CISC face to the outside and works much like RISC inside. The practical consequence for us: the same C# code runs on the two machines with different instructions and a different number of steps. You cannot carry a performance result measured on one ISA over to the other as is.
The "compile once, run anywhere" promise of .NET comes from exactly this layer: the dll contains IL, and the JIT on the target machine produces code for its ISA. You can also ask from code which environment you are in:
using System.Runtime.InteropServices;
using System.Runtime.Intrinsics.X86;

Console.WriteLine($"Process arch : {RuntimeInformation.ProcessArchitecture}");
Console.WriteLine($"RID          : {RuntimeInformation.RuntimeIdentifier}");
Console.WriteLine($"Runtime      : {RuntimeInformation.FrameworkDescription}");
Console.WriteLine($"x86-64-v2 (SSE4.2, POPCNT) : {Sse42.IsSupported && Popcnt.IsSupported}");
Console.WriteLine($"x86-64-v3 (AVX2, BMI2, FMA): {Avx2.IsSupported && Bmi2.IsSupported && Fma.IsSupported}");
Console.WriteLine($"x86-64-v4 (AVX-512)        : {Avx512F.IsSupported && Avx512BW.IsSupported}");
The output in a Linux x64 environment that has AVX2 but not AVX-512:
Process arch : X64
RID          : linux-x64
Runtime      : .NET 10.0.15
x86-64-v2 (SSE4.2, POPCNT) : True
x86-64-v3 (AVX2, BMI2, FMA): True
x86-64-v4 (AVX-512)        : False
On the Apple M5 the first line says Arm64, the RID is osx-arm64 and all three x86 lines are False: the types under System.Runtime.Intrinsics.X86 compile on ARM64 but are never supported there.
The CPU Has No decimal: Why TotalPrice Is So Big
Now the second part of the guessing question. The IL of TotalPrice has five calls inside the loop: two property getters, decimal.op_Implicit(int32), decimal.op_Multiply and decimal.op_Addition. The reason is simple: the CPU has no data type called decimal. x64 and ARM64 handle integers and IEEE 754 float/double values in hardware; the 128-bit, base-10 scaled decimal is a type that .NET implements in software, with integer instructions. The details of that representation are in "How Floating Point Works: IEEE 754, 0.1 + 0.2, NaN and double vs decimal" in the Number Systems and Data Representation series.
The header lines of the JIT output put a number on the difference:
; Assembly listing for method Bookstore.Disasm.OrderMath:TotalPrice(Bookstore.Disasm.OrderItem[]):System.Decimal (Tier1)
; Emitting BLENDED_CODE for generic X64 + VEX on Unix
; 2 inlinees with PGO data; 61 single block inlinees; 5 inlinees without PGO data
; Total bytes of code 789
TotalQuantity was 30 bytes, TotalPrice is 789: 26 times bigger. The JIT has inlined the decimal operators and the helpers they call into the method; the listing has more than 200 instructions, five mulx for the 128-bit multiplication, one div and a call to DecCalc.ScaleResult for when the scale overflows. mulx is an interesting detail: it comes with BMI2, an x64 extension for bit manipulation, and the JIT only uses it if the CPU supports it. The same method came out at 684 bytes on ARM64. The unoptimized Tier-0 version, on the other hand, is 394 bytes on x64, so it is smaller, because there the operators stay as real calls instead of being inlined. Small code does not mean fast code.
ISA Levels and the x86-64-v2 Baseline in .NET 11
x86-64 is not one fixed set; since 2003 it has grown with families of instructions added for vector operations, bit manipulation and atomic operations. Because asking which of them every CPU supports one by one is tedious, four levels were added to the x86-64 psABI, the document that defines the x64 binary interface on Unix systems, in 2020: v1 describes the original 64-bit set (CMOV, SSE, SSE2); v2 adds SSE3, SSSE3, SSE4.1, SSE4.2, POPCNT and CMPXCHG16B; v3 adds AVX, AVX2, BMI1, BMI2, FMA, LZCNT and MOVBE; and v4 adds the core subsets of AVX-512. The row labels of the program above come from these levels.
.NET 11 made the concept concrete. According to the official "What's new in .NET 11 runtime" page, the minimum x64 hardware for the JIT and Native AOT moved from x86-64-v1 to x86-64-v2 on Windows, Linux and macOS. The ReadyToRun target, the code compiled ahead of time when an app is published, became x86-64-v3 on Windows and Linux; on a supported machine that does not meet that level the precompiled code cannot be used, so startup can pay extra JIT cost. The page gives as the reason that Windows 11 already requires this level and that every chip Intel and AMD still support meets it; the last older chips went out of support around 2013. On a machine below v2 a .NET 11 app does not start, and according to the documentation it prints something like this:
The current CPU is missing one or more of the baseline instruction sets.In practice you are most likely to see this message on an old virtualization host or with a VM setting that hides CPU features; if the hypervisor does not expose SSE4.2 to the virtual CPU, the app will not start even if the physical hardware is new. On the ARM64 side the Windows baseline now includes LSE, Arm's atomic memory operations extension, while the minimum hardware for Apple and Linux did not change.
Production Notes
Check which tier the assembly you are looking at comes from. To see what measuring Tier-0 code means, I measured the same two methods with BenchmarkDotNet in two separate jobs; in the second one DOTNET_JITMinOpts=1 makes every method compile to unoptimized, Tier-0-like code:
public class TierConfig : ManualConfig
{
    public TierConfig()
    {
        AddJob(Job.Default.WithIterationCount(15).WithId("Optimized"));
        // Compile every method with unoptimized, Tier-0-like code
        AddJob(Job.Default.WithIterationCount(15).WithId("MinOpts")
            .WithEnvironmentVariables(new EnvironmentVariable("DOTNET_JITMinOpts", "1")));
    }
}
The result on an array of 10,000 order items:
| Method        | Job       | EnvironmentVariables | Mean       | Error      | StdDev     |
|-------------- |---------- |--------------------- |-----------:|-----------:|-----------:|
| TotalQuantity | MinOpts   | DOTNET_JITMinOpts=1  |  21.328 us |  0.4494 us |  0.3508 us |
| TotalPrice    | MinOpts   | DOTNET_JITMinOpts=1  | 138.744 us | 22.7329 us | 21.2644 us |
| TotalQuantity | Optimized | Empty                |   3.083 us |  0.2866 us |  0.2393 us |
| TotalPrice    | Optimized | Empty                |  55.284 us |  7.8430 us |  7.3364 us |
The only real hardware available for this post was an Apple M5 (ARM64), so the measurements were taken there, on a loaded machine that was running other work as well. Across repeated runs the optimized TotalPrice moved between 34 and 55 µs, but the ratio stayed in the same place: unoptimized code is about 7 times slower for TotalQuantity and 2.5–3 times slower for TotalPrice. The absolute numbers will be different on your Windows x64 machine; the direction will not. Also note that the decimal sum is 15–18 times slower than the int sum: 26 times more code, plus 128-bit arithmetic on every step.
Three rules follow for production. First, right after a service starts, the first requests are served by Tier-0 code; that is why p99 latency in the first seconds after startup is high, and it is what ReadyToRun is for. The details are in the Compilers and Programming Languages series. Second, the architecture of the container image matters: put a linux/amd64 image on an ARM64 node and it either does not run at all or runs slowly under emulation; logging RuntimeInformation.ProcessArchitecture at startup is cheap insurance. Third, before moving to .NET 11, check old virtualization hosts and VM CPU settings against x86-64-v2.
Common Pitfalls
Measuring a Debug build. In a Debug build Roslyn does not optimize the IL, and the JIT also produces debugger-friendly, unoptimized code; the numbers come out several times higher than Release. That is why BenchmarkDotNet refuses to measure a non-optimized assembly by default. Setting it up, and other measurement mistakes, are covered in "Performance in C#: Allocations, Structs and Measuring with BenchmarkDotNet" in the Advanced C# series, and the gap between Big-O and measurement in "What Big-O Doesn't Tell You: Constants, Cache and Measuring with BenchmarkDotNet" in the Big-O and Complexity series.
Reading the first listing and drawing conclusions. The first code you see in the DOTNET_JitDisasm output is Tier-0. The Tier-0 version of TotalQuantity is 206 bytes; it writes locals to the stack on every step, really calls get_Quantity, does a bounds check on every element and bumps a counter for PGO. Do not draw performance conclusions from a listing whose header does not say Tier1. Online tools such as SharpLab are very handy for looking at IL and JIT output side by side, but there too, pay attention to the mode you compile in.
Optimizing by looking at IL. The call get_Quantity in the IL does not exist in the machine code; code that looks short in IL can be long on the machine, and code that looks long in IL can be short. Base performance decisions on the Tier-1 assembly and on measurement, not on IL.
Generalizing a listing from one ISA to another. Work that takes two instructions on ARM64 is a single instruction on x64, and a multiplication done with mulx on x64 is done with other instructions on a CPU without BMI2. Always get the assembly for the target platform.
A Small Experiment
★☆☆ Change TotalQuantity to return long and look at the Tier-1 listing again. How did the add instruction and the register names change? Which register appeared instead of eax?
★★☆ Write for (int i = 0; i < items.Length; i++) instead of foreach, then change the condition to i < 3. Why is there no bounds check in the first case, and why does it come back in the second? Hint: search the listing for CORINFO_HELP_RNGCHKFAIL.
★★★ On your Windows x64 machine, get the Tier-1 listing with DOTNET_JitDisasm="TotalPrice" and check whether it contains mulx. Then try again with DOTNET_EnableAVX2=0: which instructions does the JIT use for the multiplication, and how many bytes does the code change by? (In .NET 10 this setting also turns off BMI2; when I tried DOTNET_EnableBMI2=0 on its own, it did not change the code.)
We now know which path a line of C# takes down to the CPU: Roslyn produces IL, the JIT writes machine code for that machine's ISA, and the CPU processes those bytes one by one in the fetch, decode, execute cycle. Real cores, however, overlap this cycle by starting the next instruction before the previous one has finished. Branches are where we pay for that. The next post in the series, "CPU Pipelines and Branch Prediction: Why Is a Sorted Array Processed Faster?", measures exactly that.