

CPU Pipelines and Branch Prediction: Why Is a Sorted Array Processed Faster?
A sorted array is processed faster because the ifs inside the loop become predictable and the CPU doesn't have to flush its pipeline. A 9.4x gap on one million orders, why the JIT won't emit cmov inside a loop, branchless summing with a bit mask, dependency chains and ILP, and why Spectre exists.
Version note: The code in this post was built and run with .NET 10 (C# 14); tests used xUnit v3 4.0.3 and measurements were taken with BenchmarkDotNet 0.15.8 on Apple M5 / macOS 27 / .NET 10.0.13. The x64 assembly listings come from the .NET JIT compiler: the Windows x64 ones via crossgen2 10.0.13, the tier-1 listing from .NET 10.0.15 in a Linux x64 container.
Guess First
Every night the Bookstore reporting team scans one million order amounts and adds up the orders above 100. The code is a single foreach with a single if. You feed it the same million amounts twice: first in random order, then sorted ascending. Same numbers, same element count, same loop, same Big-O: O(n). How much faster do you think the sorted array is processed? No difference, 10 percent, or more?
Second question: if you run the same loop over a small 10,000-element array, does the gap stay the same? The answers are hidden in how real CPUs overlap the fetch-decode-execute cycle we met in the previous post of the series, "How a Line of C# Runs on the CPU".
The Pipeline: Five Stops for Every Instruction
If you picture fetch-decode-execute as a machine that never starts the next instruction before the current one finishes, most of the CPU sits idle most of the time: while the decoder works, the fetch unit waits; while execute runs, both wait. A pipeline fills that gap the way a laundromat does. One machine washes while another dries, and each stage does its share of the work for a different instruction.
The classic textbook model has five stages: fetch (IF) brings the instruction from memory, decode (ID) decodes it and reads registers, execute (EX) does the computation in the arithmetic logic unit, memory (MEM) accesses memory if needed, and write back (WB) writes the result to a register. Bryant and O'Hallaron's Computer Systems: A Programmer's Perspective builds the same idea with similar stages on its own teaching instruction set architecture. If every stage takes one clock cycle, a single instruction still needs five cycles, but one instruction completes every cycle. Latency stays the same; throughput goes up five times.
Modern x64 cores go far beyond this model: many more stages, instructions split into micro-ops (µops), a µop cache. But the whole story of this post comes from one question that already shows up in the five-stage model: when a conditional branch such as jle is fetched, from which address should the next instruction come?
Branch Prediction: The CPU Guesses Instead of Waiting
Here is the Bookstore report code:
public static class OrderTotals
{
    public const int Threshold = 100;

    [MethodImpl(MethodImplOptions.NoInlining)]
    public static long SumExpensive(int[] orderAmounts)
    {
        long sum = 0;
        foreach (int amount in orderAmounts)
        {
            if (amount > Threshold)
            {
                sum += amount;
            }
        }
        return sum;
    }
}
NoInlining is only there so the method shows up on its own in the JIT output. This is what the JIT generates for Windows x64 (a Windows-targeted crossgen2 build, trimmed):
; Assembly listing for method Bookstore.Branching.OrderTotals:SumExpensive(int[]):long (FullOpts)
; Emitting BLENDED_CODE for generic X64 on Windows
; ReadyToRun compilation
G_M000_IG02:                ;; offset=0x0000
       xor      eax, eax
       mov      edx, dword ptr [rcx+0x08]
       test     edx, edx
       jle      SHORT G_M000_IG07
G_M000_IG03:                ;; offset=0x0009
       add      rcx, 16
G_M000_IG04:                ;; offset=0x000D
       mov      r8d, dword ptr [rcx]
       cmp      r8d, 100
       jle      SHORT G_M000_IG06
G_M000_IG05:                ;; offset=0x0016
       mov      r8d, r8d
       add      rax, r8
G_M000_IG06:                ;; offset=0x001C
       add      rcx, 4
       dec      edx
       jne      SHORT G_M000_IG04
G_M000_IG07:                ;; offset=0x0024
       ret
; Total bytes of code 37
The heart of the loop is IG04: load the amount into r8d, compare it with 100, and if it's less than or equal (jle), skip the addition. rcx holds the array address; in the Windows x64 calling convention the first argument arrives there. To get the same output from the runtime on your own Windows machine:
# PowerShell: print the code the JIT generates to the console
$env:DOTNET_JitDisasm="SumExpensive"
dotnet run -c Release
The tier-1 code you see at runtime may reorder blocks using Dynamic PGO data; the tier-1 output I captured in a Linux x64 container had the same cmp edx, 100 / jle pair, only with a different block layout. How tiering and PGO work is the subject of the Compilers and Programming Languages series.
Here's the problem: whether jle jumps is known only once cmp has gone through the execute stage. If the fetch unit sat idle until then, the pipeline's gain would vanish at every branch. Instead of waiting, the CPU guesses and keeps fetching, and even executing, along the path it predicted. The branch predictor is a hardware table that keeps the history of each branch (and the shared history of recent branches). If the guess is right, nothing is lost. If it's wrong, everything taken from the wrong path is discarded and the core restarts from the correct address. This is called a pipeline flush.
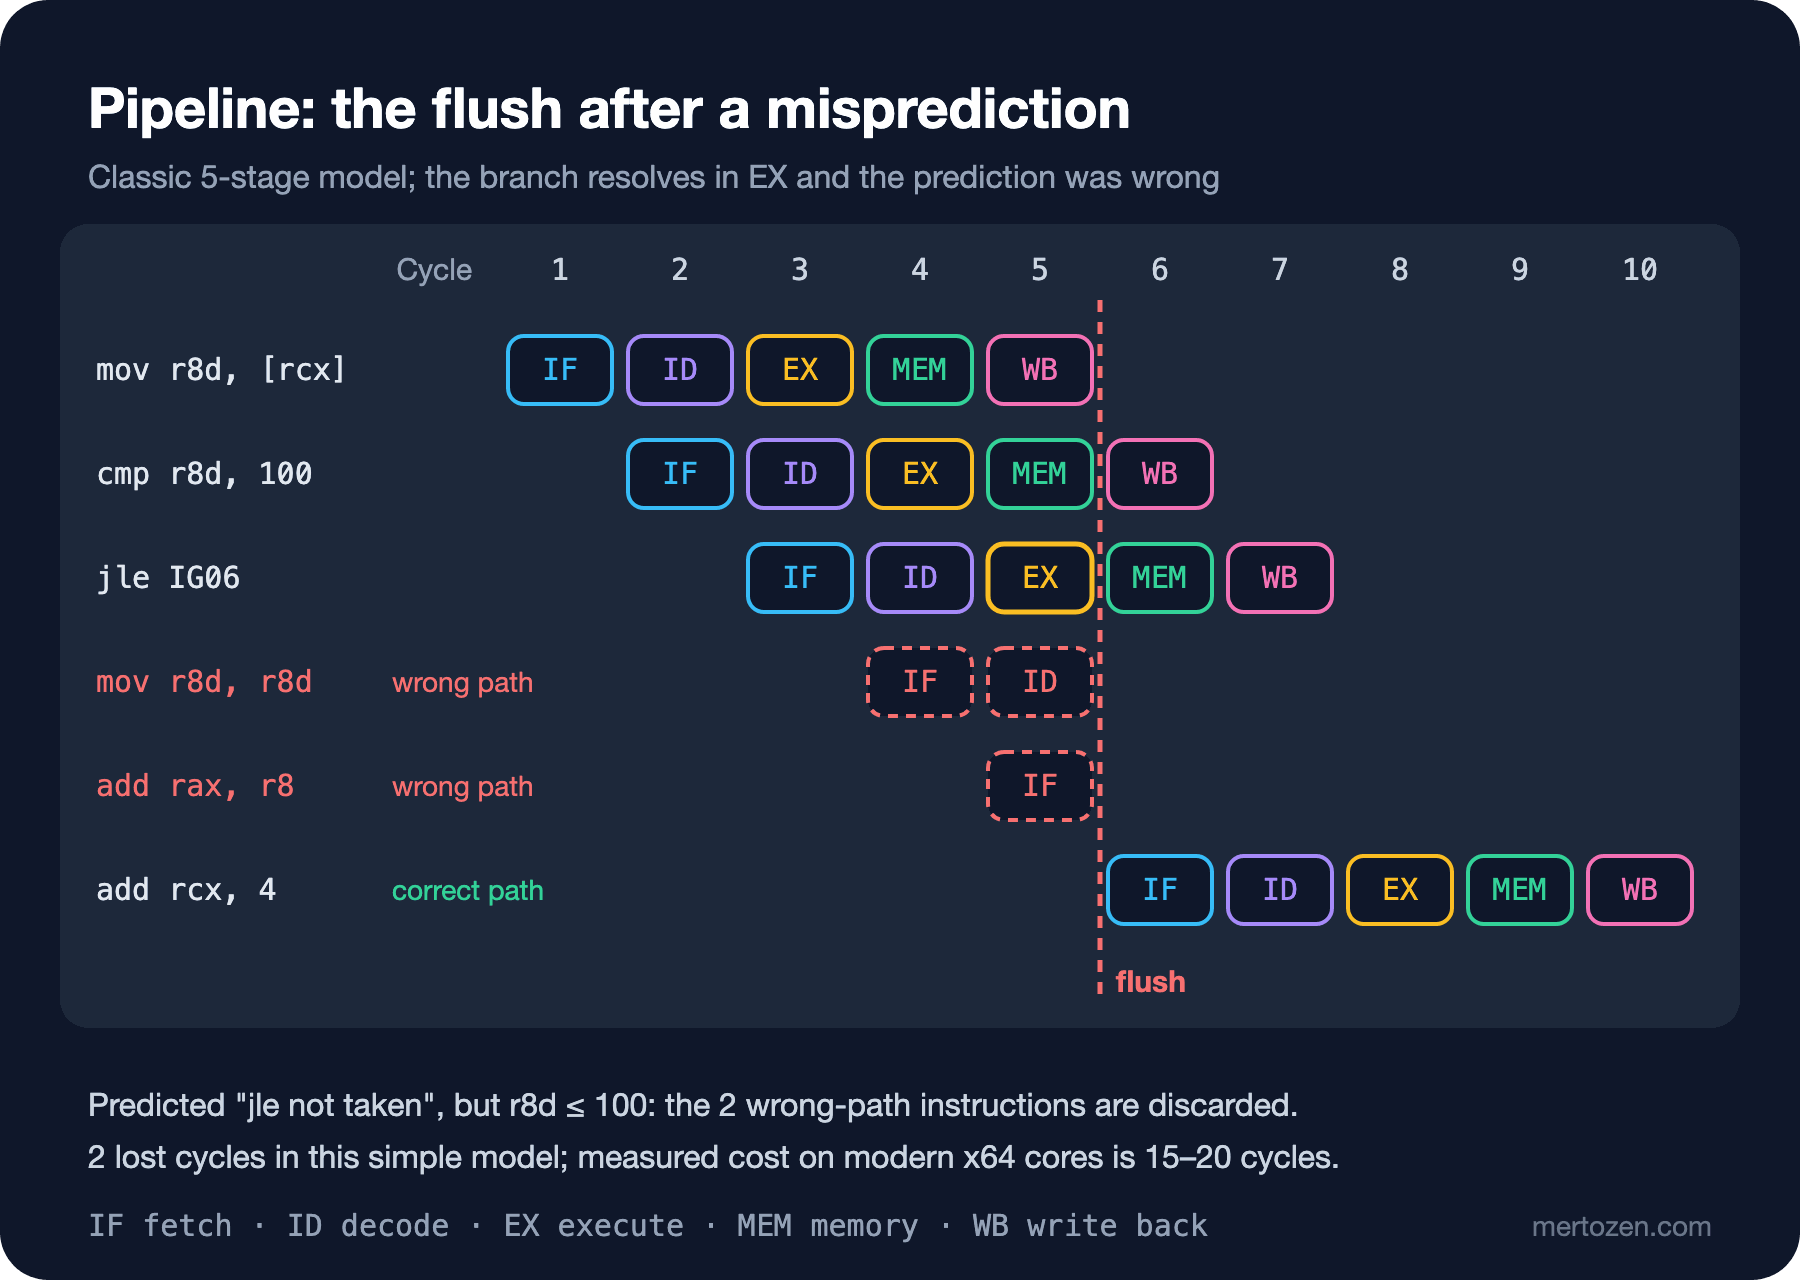
In the five-stage model the loss is two cycles. Real cores have much deeper pipelines, so the price is higher: in Agner Fog's microarchitecture manual the measured misprediction penalty is 15–20 cycles for Intel Haswell through the Skylake family, about 18 cycles on average for AMD Zen 1–3, and 15–25 cycles for Zen 5.
Measuring: Sorted and Shuffled Orders
The amounts are random between 0 and 199, so for each element the chance of exceeding 100 is roughly fifty-fifty. On shuffled data that's a coin toss. On sorted data the first half is always "skip" and the second half always "add": the easiest pattern a predictor can get.
public static class OrderData
{
    public static int[] Create(int count, bool sorted, int seed = 42)
    {
        Random random = new(seed);
        int[] amounts = new int[count];
        for (int i = 0; i < amounts.Length; i++)
        {
            amounts[i] = random.Next(0, 200);
        }
        if (sorted)
        {
            Array.Sort(amounts);
        }
        return amounts;
    }
}

[SimpleJob(warmupCount: 5, iterationCount: 15)]
public class BranchBenchmarks
{
    private int[] _amounts = [];

    [Params(10_000, 1_000_000)]
    public int N { get; set; }

    [Params(false, true)]
    public bool Sorted { get; set; }

    [GlobalSetup]
    public void Setup() => _amounts = OrderData.Create(N, Sorted);

    [Benchmark(Baseline = true)]
    public long Branchy() => OrderTotals.SumExpensive(_amounts);

    [Benchmark]
    public long Ternary() => OrderTotals.SumExpensiveTernary(_amounts);

    [Benchmark]
    public long Mask() => OrderTotals.SumExpensiveMask(_amounts);
}
BenchmarkDotNet setup is covered in the C# Advanced series post "Performance in C#: Allocations, Structs and Measuring with BenchmarkDotNet". The only real hardware I could measure on is an Apple M5, an ARM64 chip, so the tables come from that machine; I explain the x64 side with the JIT's real x64 output and published measurements for Intel and AMD. We'll get to the Ternary and Mask rows shortly:
| Method  | N       | Sorted | Mean         | Error      | StdDev     | Ratio | RatioSD |
|-------- |-------- |------- |-------------:|-----------:|-----------:|------:|--------:|
| Branchy | 10000   | False  |     6.852 us |  0.5513 us |  0.5157 us |  1.01 |    0.10 |
| Ternary | 10000   | False  |     6.225 us |  0.0584 us |  0.0518 us |  0.91 |    0.07 |
| Mask    | 10000   | False  |     3.319 us |  0.0139 us |  0.0108 us |  0.49 |    0.03 |
|         |         |        |              |            |            |       |         |
| Branchy | 10000   | True   |     2.390 us |  0.0203 us |  0.0180 us |  1.00 |    0.01 |
| Ternary | 10000   | True   |     2.836 us |  0.0082 us |  0.0077 us |  1.19 |    0.01 |
| Mask    | 10000   | True   |     3.379 us |  0.0359 us |  0.0318 us |  1.41 |    0.02 |
|         |         |        |              |            |            |       |         |
| Branchy | 1000000 | False  | 2,339.447 us | 22.4815 us | 17.5521 us |  1.00 |    0.01 |
| Ternary | 1000000 | False  | 2,394.782 us | 67.2474 us | 56.1546 us |  1.02 |    0.02 |
| Mask    | 1000000 | False  |   340.638 us |  1.6100 us |  1.5060 us |  0.15 |    0.00 |
|         |         |        |              |            |            |       |         |
| Branchy | 1000000 | True   |   248.656 us |  0.9305 us |  0.8249 us |  1.00 |    0.00 |
| Ternary | 1000000 | True   |   280.845 us |  4.7008 us |  3.6701 us |  1.13 |    0.01 |
| Mask    | 1000000 | True   |   337.169 us |  2.3824 us |  2.2285 us |  1.36 |    0.01 |
With one million orders, shuffled data takes 2,339 µs and sorted data 249 µs: 9.4 times. That's 2.34 ns per element against 0.25 ns. On sorted data the loop flows with almost no missed branches; on shuffled data the predictor is wrong on every other element and the pipeline drains. A rough calculation: half a million mispredictions explain the 2.1 ms gap, about 4 ns per wrong guess. The vendor doesn't publish this machine's clock or pipeline depth, so I don't convert that to cycles; the 15–20 cycles on the x64 side land in the same range on a 4–5 GHz core.
At 10,000 elements the table tells a different story: shuffled data is only 2.9 times slower. The reason belongs not to the next section but to Common Pitfalls; first, let's see how to get rid of the branch.
Superscalar and Out-of-Order: Several Things at Once
A pipeline promises to complete one instruction per cycle. Modern cores go further. A superscalar core decodes several instructions per cycle and dispatches them to several execution units. Out-of-order execution runs whichever instruction has its inputs ready, regardless of program order, and still "commits" the results in program order. What the two exploit together is called instruction-level parallelism: instructions that don't depend on each other run at the same time.
A dependency chain kills that parallelism. Two versions that add up shipping weights:
public static class ShippingWeights
{
    [MethodImpl(MethodImplOptions.NoInlining)]
    public static double TotalOneChain(double[] weights)
    {
        double total = 0;
        for (int i = 0; i < weights.Length; i++)
        {
            // Every addition waits for the previous result
            total += weights[i];
        }
        return total;
    }

    [MethodImpl(MethodImplOptions.NoInlining)]
    public static double TotalFourChains(double[] weights)
    {
        double a = 0, b = 0, c = 0, d = 0;
        int i = 0;
        for (; i <= weights.Length - 4; i += 4)
        {
            // Four independent chains: the CPU can overlap all four
            a += weights[i];
            b += weights[i + 1];
            c += weights[i + 2];
            d += weights[i + 3];
        }
        for (; i < weights.Length; i++)
        {
            a += weights[i];
        }
        return (a + b) + (c + d);
    }
}
| Method | Mean | Error | StdDev | Ratio | RatioSD |
|----------- |---------:|---------:|---------:|------:|--------:|
| OneChain | 59.62 us | 1.314 us | 1.229 us | 1.00 | 0.03 |
| FourChains | 16.83 us | 0.942 us | 0.882 us | 0.28 | 0.02 |100,000 double values, the same number of additions, a 3.5x difference. A floating point addition takes several cycles; in the single chain every total += waits for the previous one to finish, so the CPU's idle adders are of no use. With four chains the out-of-order engine keeps four additions in flight at once. Agner Fog's manual likewise recommends avoiding long dependency chains in performance-critical code wherever possible.
The price: the order of additions changed. Floating point addition isn't associative, so for [1e16, 1.0, -1e16, 1.0] the single chain returns 1 and the four chains return 0; I pinned that down in an xUnit test. Why this happens is covered in the floating point post of the Number Systems and Data Representation series. It's also one reason to use decimal for money.
The link to branch prediction: the out-of-order engine executes dozens of instructions ahead along the path the predictor chose. If the guess is right, that work comes for free; if it's wrong, all of it is thrown away. That's what makes a misprediction expensive on a deep, wide core.
Branchless Code: cmov, csel and Bit Masks
The way out of an unpredictable branch is to turn it into a data dependency. The cmov instruction on x64 and csel on ARM64 pick one of two values based on a condition; there is no jump and nothing to predict. First attempt, a ternary:
[MethodImpl(MethodImplOptions.NoInlining)]
public static long SumExpensiveTernary(int[] orderAmounts)
{
    long sum = 0;
    foreach (int amount in orderAmounts)
    {
        sum += amount > Threshold ? amount : 0;
    }
    return sum;
}

[MethodImpl(MethodImplOptions.NoInlining)]
public static int KeepIfExpensive(int amount) => amount > Threshold ? amount : 0;
The Ternary rows in the table behave just like Branchy: 2.4 ms again on shuffled data. The JIT output shows why: the ternary in the loop is still compiled to cmp + jle. The same expression outside a loop, in a method of its own, is branchless:
; Assembly listing for method Bookstore.Branching.OrderTotals:KeepIfExpensive(int):int (FullOpts)
; Emitting BLENDED_CODE for generic X64 on Windows
G_M000_IG02:                ;; offset=0x0000
       xor      eax, eax
       cmp      ecx, 100
       cmovg    eax, ecx
G_M000_IG03:                ;; offset=0x0008
       ret
; Total bytes of code 9
ARM64 produces the equivalent in its own instruction set for the same method:
; Assembly listing for method Bookstore.Branching.OrderTotals:KeepIfExpensive(int):int (Tier1)
; Emitting BLENDED_CODE for generic ARM64 on Apple
G_M000_IG02:                ;; offset=0x0008
            cmp     w0, #100
            csel    w0, w0, wzr, gt
; Total bytes of code 24
Why not in the loop? In the .NET runtime source, the if-conversion phase (where the JIT turns a conditional jump into a "select" operation) deliberately skips blocks inside loops. The reason is in the code comment: loop-carried dependencies can cause significant stalls after if-conversion. Because cmov waits for both values, it can be slower than a well-predicted branch. So the JIT is cautious in loops, and the sorted rows in the table prove it right.
If you really want branchless code in a loop, you can write it with arithmetic:
[MethodImpl(MethodImplOptions.NoInlining)]
public static long SumExpensiveMask(int[] orderAmounts)
{
    long sum = 0;
    foreach (int amount in orderAmounts)
    {
        // If amount > 100, (100 - amount) is negative: mask = -1 (all bits set), otherwise 0
        int mask = (Threshold - amount) >> 31;
        sum += amount & mask;
    }
    return sum;
}
; Assembly listing for method Bookstore.Branching.OrderTotals:SumExpensiveMask(int[]):long (Tier1)
; Emitting BLENDED_CODE for generic X64 + VEX on Unix
G_M000_IG04: ;; offset=0x0020
mov edx, dword ptr [rdi]
mov esi, edx
neg esi
add esi, 100
sar esi, 31
and edx, esi
movsxd rdx, edx
add rax, rdx
add rdi, 4
dec ecx
jne SHORT G_M000_IG04The only branch left is the loop's own jne, and since it always goes the same way, it's almost never missed. The result is in the table: Mask takes about 340 µs for a million elements regardless of the data's order. On shuffled data that's a 6.9x win. On sorted data, though, the branchy version is faster at 249 µs, because a well-predicted branch is effectively free while the arithmetic version runs a few more instructions per element. Branchless code is insurance: it improves the worst case and makes the best case slightly worse.
How a right shift replicates the sign bit (arithmetic shift) and two's complement are topics of the Number Systems and Data Representation series. Here it's enough to know that (100 - amount) >> 31 is -1 if amount is greater than 100 and 0 otherwise.
Speculative Execution and Spectre
The CPU doesn't just fetch the predicted path, it executes it too. This is called speculative execution, and the results of a wrong path are never committed to registers. From the program's point of view, no trace is left. From the microarchitecture's point of view, there is one: a load that ran speculatively may have brought data into the cache.
Spectre (a family of vulnerabilities disclosed in 2018) was born exactly from this gap. The attacker trains the predictor so that the victim speculatively reads data it would normally never touch, then infers which cache line got warm by measuring time. According to the page of the researchers who disclosed Spectre, the attack was verified on Intel, AMD and Arm processors; the cause isn't a software bug but the design of modern processors that keep many instructions in flight. That's why the fix didn't come as a single patch but in layers:
- Operating systems and CPU microcode received updates that limit how much the predictor is shared between kernel and user code.
- Compilers gained options that can place speculation-stopping instructions behind sensitive bounds checks.
- Browsers moved each site into its own process and reduced timer precision: according to MDN,
performance.now()returns with 100 µs resolution on pages that aren't cross-origin isolated and 5 µs on isolated pages.
As a .NET developer, what you usually need to do is not switch these layers off: an up-to-date OS, an up-to-date runtime, an up-to-date browser. These mitigations cost some performance, so be skeptical of "turn them off to go faster" advice. Kernel-side details are in the Operating System Fundamentals series.
In Production
Most branches in real code are already well predicted: null checks, error paths, feature flags that almost never change. The optimization opportunity lies in conditions inside a hot loop that depend on the data itself and split roughly half and half: filters, classifications, threshold checks. The way to find them is to measure, not guess. BenchmarkDotNet's [HardwareCounters(HardwareCounter.BranchMispredictions, HardwareCounter.BranchInstructions)] attribute reports the misprediction count directly on Windows; according to its documentation it needs the BenchmarkDotNet.Diagnostics.Windows package, Event Tracing for Windows and admin rights, and Unix support isn't there yet. Since I took this post's measurements on macOS, I can't show those counters here. Finding which method is hot in production is the job of the .NET Profiling and Diagnostics series.
Sorting the data for the branch's sake looks like an option too, but sorting is O(n log n) and comes with branches of its own. If the data already arrives sorted for another reason (for example, orders read in date order), you win for free; sorting just for the branch rarely pays off.
Common Pitfalls
Generalizing a micro-benchmark result. The 10,000-element row in the table is a live example: shuffled data is only 2.9 times slower, not 9.4. BenchmarkDotNet processes the same array thousands of times, and because modern predictors keep long histories they can partly memorize a repeating pattern. Agner Fog also notes for the Skylake family that very long repeating jump patterns are predicted with few or no mispredictions. To check this I fed 100 different 10,000-element arrays in turn:
| Method         | Mean      | Error     | StdDev    | Ratio | RatioSD |
|--------------- |----------:|----------:|----------:|------:|--------:|
| SameArray      |  6.841 us | 0.4437 us | 0.4151 us |  1.00 |    0.08 |
| RotatingArrays | 28.454 us | 1.5892 us | 1.4088 us |  4.17 |    0.31 |
Same size, same distribution, a fourfold difference. Unless you process the same 10,000 orders every night in production, the second row is the real cost. (Other work was running on the machine during this measurement; the absolute values wobble a bit, the ratio is clear.)
"Optimizing" code the JIT already makes branchless. Turning a small ternary like KeepIfExpensive into a bit trick gains nothing; the JIT already emits cmov there. Look at the JIT output first, then decide.
Sacrificing readability. (Threshold - amount) >> 31 only makes sense with a comment, and if amount could be a very small negative number (e.g. int.MinValue), the subtraction would overflow and give a wrong result. That's why it has a test. Write this kind of code for a measured bottleneck, with tests and a comment; everywhere else a plain if is the right choice.
Measuring a Debug build or Tier-0 code. As we saw in the previous post of the series, Tier-0 code writes to and reads from the stack instead of registers; branch costs get lost in that noise. Always measure Release, warmed-up code.
A Small Experiment
★☆☆ Change the range in OrderData.Create from random.Next(0, 200) to random.Next(0, 1000). Now 90 percent of amounts exceed 100. How does the gap between Branchy and Mask on shuffled data change? What does "mostly the same direction" mean to a predictor?
★★☆ Add a SortThenSum benchmark: it copies the shuffled array, sorts it with Array.Sort and calls SumExpensive. Is the total time shorter than shuffled Branchy? When would sorting pay off?
★★★ On Windows, as an administrator, add [HardwareCounters(HardwareCounter.BranchMispredictions, HardwareCounter.BranchInstructions)] to BranchBenchmarks. With a million shuffled elements, is the misprediction count close to half a million? Divide the time difference by the misprediction count to work out how many ns your own processor pays per wrong guess, and compare it with Agner Fog's 15–20 cycles.
In this post we saw how the CPU overlaps instructions and why a wrong guess is expensive. But our loops always ran over small arrays; the data fit in the cache. In the next post of the series, "The Memory Hierarchy: Latency Numbers from Registers to SSD and Locality", we'll look at what happens when data spills out of the cache: the same sum, with sequential and random indexes, will get many times slower, this time because of memory rather than branches.