

How CPU Caches Work: Cache Lines, Associativity and Cache-Friendly C#

The CPU reads cache lines, not bytes (64 bytes on x64), and looks up an address by splitting it into tag, index and offset and searching a single set; how fast your code runs depends on whether it fits that structure. Walking a 4096 × 4096 table by columns 6.5x slower, a loop 4.6x faster once 16 columns remove the conflict misses, a 5x win from Struct of Arrays, and a struct shrinking from 40 to 24 bytes by field order.
Version note: The code in this post was built and run with .NET 10 (C# 14); tests use xUnit v3 4.0.3, measurements were taken with BenchmarkDotNet 0.15.8 on Apple M5 / macOS 27 / .NET 10.0.13, and the x64 outputs (struct layout and JIT assembly) come from a Linux x64 container running .NET 10.0.15.
Guess First
Bookstore's warehouse screen sums the stock movements in a 4096 × 4096 int[,] table. There are two ways to write the same two loops: rows outside and columns inside, or columns outside and rows inside. Both read 16,777,216 elements exactly once, and both are O(n²). How big is the difference? And if you shrink the table to 256 × 256, does the gap grow or shrink?
Second question: if you widen the table from 4096 to 4112 columns and only walk it column by column, adding 16 elements of extra work per row, does the loop get slower or faster?
The previous post of the series, "The Memory Hierarchy: Latency Numbers from Registers to SSD and Locality", measured the latency of each level. This post goes one level deeper: how the CPU cache finds an address, why it evicts data even when it has free space, and how to write C# with that in mind.
Cache Lines: The CPU Reads Blocks, Not Bytes
When you read an int, the CPU does not fetch 4 bytes from memory. Caches hold and move data in fixed-size blocks called cache lines. According to the cache chapter of Intel's Software Developer's Manual, Volume 3A, L1, L2 and L3 cache lines are 64 bytes on the Core and Atom microarchitectures; AMD processors also use 64-byte lines. So when you touch one int, the 15 neighbours in the same aligned 64-byte block come along for free.
The machine I measured on is an Apple M5, an ARM64 Apple Silicon chip; every timing table in this post comes from it, because it is the only real hardware I have here. Its line size is different:
$ sysctl hw.cachelinesize hw.perflevel0.l1dcachesize hw.perflevel0.l2cachesize hw.perflevel1.l1dcachesize hw.perflevel1.l2cachesize
hw.cachelinesize: 128
hw.perflevel0.l1dcachesize: 131072
hw.perflevel0.l2cachesize: 16777216
hw.perflevel1.l1dcachesize: 65536
hw.perflevel1.l2cachesize: 6291456
128 KB L1d and 16 MB L2 on the performance cores, 128-byte lines. On Windows, Sysinternals Coreinfo's coreinfo -l prints the size, associativity and line size of every cache (I did not run it on this machine); the Intel Core Ultra 7 165U sample on Microsoft's Coreinfo page shows a 48 KB / 12-way L1d, a 2 MB / 16-way L2 and a 12 MB / 12-way L3 for a performance core, all with 64-byte lines. AMD's EPYC 9004 architecture overview gives a 32 KB / 8-way L1d for Zen 4. From code the same data is in the CACHE_RELATIONSHIP structure returned by GetLogicalProcessorInformationEx (Associativity, LineSize, CacheSize), and a summary is in Task Manager's Performance tab.
The practical consequence: the unit of memory traffic is the line. Code that uses 4 bytes of a line and throws the rest away uses one sixteenth of the bandwidth.
How an Address Is Split: Tag, Index, Offset and Set-Associative Caches
When the cache looks up an address, it splits it into three parts. The lowest bits are the offset: they select the byte inside the line, 6 bits for a 64-byte line. The middle bits are the index: they say which set of the cache the line goes to. The remaining upper bits are the tag: they are stored so the cache can tell whether the line sitting in the set is really the one you asked for.
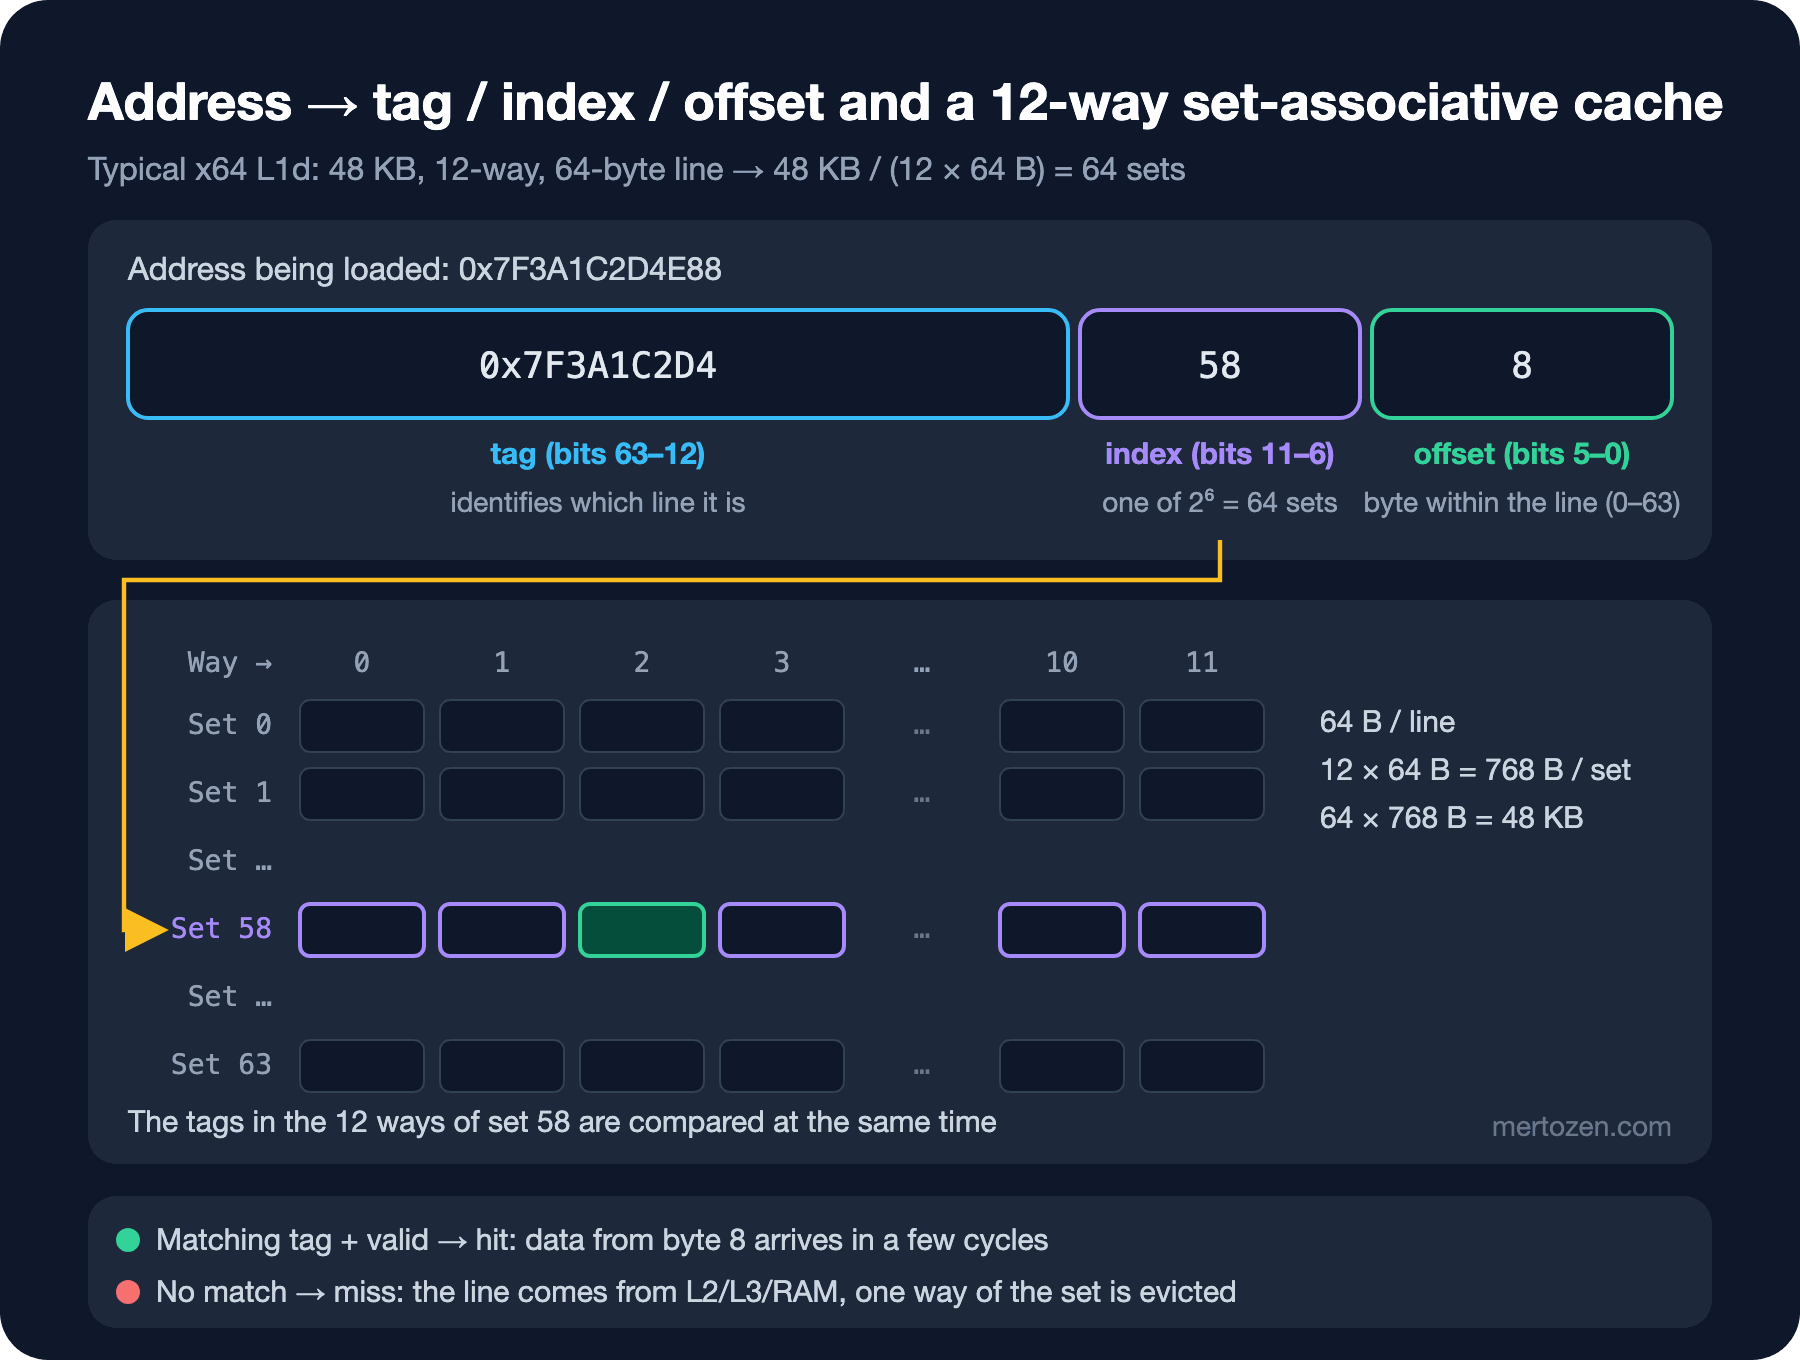
Let's do the math for the 48 KB, 12-way, 64-byte-line L1d from the Coreinfo sample: 48 KB / (12 × 64 B) = 64 sets, so the index is 6 bits. Bits 0–5 of an address are the offset, bits 6–11 the index, the rest the tag. On a load the cache picks one set with the index and compares the tags of its 12 lines in parallel. A match is a hit; otherwise it is a miss: the line comes from the level below and one line of the set is evicted according to a replacement policy (usually close to LRU).
Associativity is the knob of this design. In a 1-way (direct-mapped) cache every address has exactly one place, and two addresses mapping to it keep evicting each other; in a fully associative cache a line can go anywhere, but comparing every tag on every lookup is expensive. Real L1/L2 caches sit in between: N-way set-associative. The consequence to remember: with a 6-bit index and a 6-bit offset, addresses that differ by a multiple of 4096 bytes land in the same set.
The classic way to classify misses is the "3C" model Mark Hill introduced in the late 1980s. A compulsory miss: the line is touched for the first time, and even an infinitely large cache would miss. A capacity miss: the working set does not fit in the cache. A conflict miss: the cache has room, but the set the line maps to is full. In the next post of the series we will see a fourth kind that appears on multiple cores: misses caused by coherence.
On the write side modern CPUs are write-back: a store only updates the line in the cache and marks it "dirty"; memory is updated only when the line is evicted. On a store miss the line is read in first, so even a loop that only writes generates read traffic. The helper on the read side is the prefetcher: hardware that recognises sequential or constant-stride access and fetches the next lines ahead of time; it can do nothing for random access.
Demo 1: Walk a 2D Array by Rows or by Columns?
Here is the code for the first question. We compute the same sum four ways: on an int[,] and on a jagged int[][], walking row-major and column-major:
namespace Bookstore.Cache;

public static class GridSum
{
    public static long RowMajor(int[,] grid)
    {
        int rows = grid.GetLength(0), cols = grid.GetLength(1);
        long sum = 0;
        for (int r = 0; r < rows; r++)
            for (int c = 0; c < cols; c++)
                sum += grid[r, c];
        return sum;
    }

    public static long ColumnMajor(int[,] grid)
    {
        int rows = grid.GetLength(0), cols = grid.GetLength(1);
        long sum = 0;
        for (int c = 0; c < cols; c++)
            for (int r = 0; r < rows; r++)
                sum += grid[r, c];
        return sum;
    }

    public static long JaggedRowMajor(int[][] grid)
    {
        long sum = 0;
        foreach (int[] row in grid)
            foreach (int value in row)
                sum += value;
        return sum;
    }

    public static long JaggedColumnMajor(int[][] grid)
    {
        int cols = grid[0].Length;
        long sum = 0;
        for (int c = 0; c < cols; c++)
            for (int r = 0; r < grid.Length; r++)
                sum += grid[r][c];
        return sum;
    }
}
An xUnit test checks that all four methods return the same result on a random 300 × 300 table. The BenchmarkDotNet result:
| Method            | N    | Mean         | Error        | StdDev       | Ratio | RatioSD |
|------------------ |----- |-------------:|-------------:|-------------:|------:|--------:|
| RowMajor          | 256  |     33.50 us |     6.526 us |     5.095 us |  1.02 |    0.20 |
| ColumnMajor       | 256  |     48.87 us |     3.295 us |     2.179 us |  1.49 |    0.20 |
| JaggedRowMajor    | 256  |     19.96 us |     0.953 us |     0.744 us |  0.61 |    0.08 |
| JaggedColumnMajor | 256  |     22.37 us |     2.372 us |     1.715 us |  0.68 |    0.10 |
|                   |      |              |              |              |       |         |
| RowMajor          | 4096 |  8,307.33 us |   361.699 us |   261.532 us |  1.00 |    0.04 |
| ColumnMajor       | 4096 | 53,866.05 us | 4,743.503 us | 3,429.864 us |  6.49 |    0.44 |
| JaggedRowMajor    | 4096 |  4,322.25 us |    10.187 us |     6.738 us |  0.52 |    0.02 |
| JaggedColumnMajor | 4096 | 30,913.83 us | 1,414.672 us | 1,104.483 us |  3.72 |    0.17 |
At 4096, walking column by column is 6.5 times slower. The reason is memory layout: ECMA-335, the CLI standard published by Ecma International, requires the elements of a multidimensional array to be laid out in row-major order. grid[r + 1, c] is 16 KB away from grid[r, c]. The row loop uses 16 ints (on x64) from every line; the column loop asks for a new line at every step, takes a single int from it, and the line is evicted before it is used again. Every step also lands on a different 4 KB page, so the TLB suffers; that part belongs to the Operating System Fundamentals series.
At 256 × 256 the gap shrinks to 1.5x: the 256 KB table fits in L2 and the prefetcher recognises the constant stride. This is the hardware side of the warning in the Big-O and Complexity series post "What Big-O Doesn't Tell You: Constants, Cache and Measuring with BenchmarkDotNet".
The table has one more surprise: walked row by row, the jagged array is twice as fast as int[,]. That gap comes from the code the JIT generates, not from the cache. Here are the inner loops of the tier-1 x64 code (an excerpt from the output of DOTNET_JitDisasm="RowMajor JaggedRowMajor" in a Linux x64 container):
; RowMajor(int[,]) - Tier1, inner loop
G_M000_IG08:                ;; offset=0x0037
       mov      r11d, r9d
       cmp      r11d, r10d
       jae      SHORT G_M000_IG09
       mov      ebx, dword ptr [rdi+0x14]
       imul     r11d, ebx
       mov      r15d, r8d
       sub      r15d, dword ptr [rdi+0x1C]
       cmp      r15d, ebx
       jae      SHORT G_M000_IG09
       add      r11d, r15d
       movsxd   r11, dword ptr [rdi+4*r11+0x20]
       add      rdx, r11
       inc      r8d
       cmp      r8d, ecx
       jl       SHORT G_M000_IG08

; JaggedRowMajor(int[][]) - Tier1, inner loop
G_M000_IG05:                ;; offset=0x0020
       movsxd   r8, dword ptr [rdx]
       add      rax, r8
       add      rdx, 4
       dec      esi
       jne      SHORT G_M000_IG05
The int[,] loop performs two bounds checks (cmp/jae), a lower-bound subtraction and an imul for the row offset per element, and it re-reads the dimension data from the object ([rdi+0x14], [rdi+0x1C]) on every iteration. The loop over a jagged row is five instructions: load, add, advance the pointer, decrement the counter, branch. Being cache-friendly is necessary but not sufficient; in a hot loop, a jagged array or a one-dimensional array indexed as r * cols + c usually produces better code than int[,].
Conflict Misses: A Loop That Gets 4.6x Faster When the Row Grows by 16
The second question. We walk a 2048-row table column by column only; the one thing that changes is the row width:
[SimpleJob(warmupCount: 3, iterationCount: 12)]
public class StrideBenchmarks
{
    private int[,] _grid = null!;

    [Params(4096, 4112)]
    public int Columns { get; set; }

    [GlobalSetup]
    public void Setup() => _grid = new int[2048, Columns];

    [Benchmark]
    public long ColumnMajor() => GridSum.ColumnMajor(_grid);
}
| Method | Columns | Mean | Error | StdDev |
|------------ |-------- |----------:|---------:|---------:|
| ColumnMajor | 4096 | 30.848 ms | 5.725 ms | 4.470 ms |
| ColumnMajor | 4112 | 6.631 ms | 1.480 ms | 1.156 ms |The table grew by 0.4 percent and the loop got 4.6 times faster. Remember the math from the figure: in an L1d with 64 sets, addresses that differ by a multiple of 4096 bytes land in the same set. A row of 4096 columns is 16 KB, so all 2048 elements of a column go to the same set, and that set has only 12 ways. While the rest of the cache sits empty, every new row evicts a line that will be needed again for the next column: a textbook conflict miss. The same happens in L2: in a 2 MB, 16-way L2 the sets repeat every 128 KB, a 16 KB stride visits only 8 sets, and 2048 lines get 8 × 16 = 128 slots. With 4112 columns a row is 16,448 bytes; each row shifts to the next set and the lines spread across all sets. The 2048 lines fetched for one column don't fit in L1, but they stay in L2, and the next 15 columns read them from there.
The measurement was taken on the M5; its geometry is different (128-byte lines, and Apple does not document the set and way counts), but a large power-of-two stride falls into the same trap on any set-associative cache; only the critical stride changes. Part of the 6.5x in the 4096 case of the 2D demo was conflict misses too. That is why padding the row width by a few elements on purpose is common in matrix and image code.
Demo 2: Array of Structs vs Struct of Arrays
Bookstore's catalogue report scans a million books. The classic layout is Array of Structs (AoS): all fields of a book next to each other. The alternative is Struct of Arrays (SoA): each field in its own array.
namespace Bookstore.Cache;

// Array of Structs: all fields of a book side by side
public readonly record struct BookRow(
    Guid Id, decimal Price, int AuthorId, int Stock, DateTime PublishedAt, long Flags);

// Struct of Arrays: each field in its own array
public sealed class BookColumns(int count)
{
    public Guid[] Ids { get; } = new Guid[count];
    public decimal[] Prices { get; } = new decimal[count];
    public int[] AuthorIds { get; } = new int[count];
    public int[] Stocks { get; } = new int[count];
    public DateTime[] PublishedAts { get; } = new DateTime[count];
    public long[] Flags { get; } = new long[count];
    public int Count => Prices.Length;
}

public static class PriceReport
{
    public static decimal TotalAos(ReadOnlySpan<BookRow> books)
    {
        decimal total = 0m;
        foreach (ref readonly BookRow book in books)
            total += book.Price;
        return total;
    }

    public static decimal TotalSoa(ReadOnlySpan<decimal> prices)
    {
        decimal total = 0m;
        foreach (decimal price in prices)
            total += price;
        return total;
    }

    public static long StockAos(ReadOnlySpan<BookRow> books)
    {
        long total = 0;
        foreach (ref readonly BookRow book in books)
            total += book.Stock;
        return total;
    }

    public static long StockSoa(ReadOnlySpan<int> stocks)
    {
        long total = 0;
        foreach (int stock in stocks)
            total += stock;
        return total;
    }
}
BookRow is 56 bytes (a test checks this with Unsafe.SizeOf). The price report reads the 16-byte decimal of each book, the stock report the 4-byte int. With AoS the CPU still has to move all 56 bytes through the lines; with SoA every byte moved is useful.
| Method              | Books   | Mean         | Error       | StdDev      | Ratio | RatioSD |
|-------------------- |-------- |-------------:|------------:|------------:|------:|--------:|
| ArrayOfStructs      | 10000   |    46.269 us |   2.6048 us |   1.8834 us |  1.00 |    0.06 |
| StructOfArrays      | 10000   |    35.581 us |   1.7298 us |   1.3505 us |  0.77 |    0.04 |
| StockArrayOfStructs | 10000   |     5.813 us |   0.7828 us |   0.6112 us |  0.13 |    0.01 |
| StockStructOfArrays | 10000   |     3.083 us |   0.5745 us |   0.4486 us |  0.07 |    0.01 |
|                     |         |              |             |             |       |         |
| ArrayOfStructs      | 1000000 | 4,814.026 us | 338.9734 us | 224.2099 us |  1.00 |    0.06 |
| StructOfArrays      | 1000000 | 3,802.322 us | 157.4546 us | 113.8500 us |  0.79 |    0.04 |
| StockArrayOfStructs | 1000000 | 1,260.297 us |  94.3486 us |  73.6612 us |  0.26 |    0.02 |
| StockStructOfArrays | 1000000 |   249.763 us |   1.5641 us |   1.1310 us |  0.05 |    0.00 |
For the stock report SoA is 5 times faster on a million books: it reads 4 MB instead of 56 MB. At ten thousand books the gap drops to 1.9x, because the 560 KB of AoS data also stays in L2. The real lesson is in the price report: SoA gains only 20 percent, and in an earlier run the ratio came out at 1.07; the difference is at noise level. Adding decimals is not a single hardware instruction but an operation done in software (its inner structure is covered in the Number Systems and Data Representation series); the loop is waiting on the CPU, not on memory. A layout change only pays off when the bottleneck is memory traffic; measure that first.
The price of SoA: reading one book touches six arrays, inserts and deletes happen in six places. In practice a middle ground is common: keep the few fields the hot report reads separate and leave the rest as AoS.
Demo 3: Struct Layout, Alignment and Padding
How many elements fit in a line depends on the size of the struct, and the size depends on field order. The CLR places fields at their natural alignment: a long starts at an offset that is a multiple of 8. The gaps in between are padding.
using System.Runtime.InteropServices;

namespace Bookstore.Cache;

// Fields in a "logical" order, small and large fields mixed
[StructLayout(LayoutKind.Sequential)]
public struct StockEntrySequential
{
    public bool IsActive;
    public long BookId;
    public byte Warehouse;
    public long Quantity;
    public bool IsReserved;
}

// Same fields, ordered from largest to smallest
[StructLayout(LayoutKind.Sequential)]
public struct StockEntryOrdered
{
    public long BookId;
    public long Quantity;
    public byte Warehouse;
    public bool IsActive;
    public bool IsReserved;
}

// Let the runtime choose the order
[StructLayout(LayoutKind.Auto)]
public struct StockEntryAuto
{
    public bool IsActive;
    public long BookId;
    public byte Warehouse;
    public long Quantity;
    public bool IsReserved;
}

// Same data as a class: header + method table pointer are added
public sealed class StockEntryClass
{
    public bool IsActive;
    public long BookId;
    public byte Warehouse;
    public long Quantity;
    public bool IsReserved;
}
Here is the x64 output of a small console app that measures sizes with Unsafe.SizeOf<T>(), field offsets with Unsafe.ByteOffset, and the class's heap size via the GC.GetAllocatedBytesForCurrentThread difference across a thousand instances (the output is identical on ARM64):
Arch: X64
StockEntrySequential : 40 bytes
StockEntryOrdered    : 24 bytes
StockEntryAuto       : 24 bytes
BookRow              : 56 bytes
Sequential offsets   : IsActive=0, BookId=8, Warehouse=16, Quantity=24, IsReserved=32
Auto offsets         : IsActive=16, BookId=0, Warehouse=17, Quantity=8, IsReserved=18
StockEntryClass      : 40 bytes per object on the heap
The same five fields, the same 19 bytes of data: 40 bytes in declaration order, 24 bytes when ordered from largest to smallest. With Sequential there are 7 bytes of padding after each bool/byte. For a stock array of a million records that is the difference between 40 MB and 24 MB. With LayoutKind.Auto the runtime does the ordering itself and arrives at the same 24 bytes.
C# structs are Sequential by default because they can be shared with native code, where the order is part of the contract. For structs that never go to interop and live in millions of copies, ordering fields from largest to smallest or using Auto is a free win.
.NET Specifics: Object Header, Method Table and GC Compaction
StockEntryClass taking 40 bytes is the hidden cost of classes. In a 64-bit .NET process every object first carries an 8-byte object header (the sync block index field) and an 8-byte method table pointer. Field layout for classes is already automatic, so the 19 bytes of data are rounded up to 24 and 16 bytes come on top. As a struct in an array it is 24 bytes; as a class it is 40 bytes on the heap plus an 8-byte reference in the array.
In a class array only the references sit next to each other; we measured the pointer chasing cost of that with List<Book> in the previous post of the series. One detail to add: the GC places new objects one after another in an allocation region, and compaction slides survivors together while preserving their order. Objects created together therefore often stay next to each other. How the GC works is covered in the C# Object-Oriented Programming series post "Object Lifetime in C#: the Garbage Collector, IDisposable and using" and in the GC post of the Compilers and Programming Languages series.
The common language for contiguous data in .NET is Span<T>: the reports above work with an array, a stackalloc buffer, or the backing array of a List<T> via CollectionsMarshal.AsSpan; foreach (ref readonly ...) reads the 56-byte struct without copying it. Details are in the C# Advanced series post "Span<T> and Memory<T> in C#: Allocation-Free Parsing, stackalloc and ref struct Rules".
In Production
These techniques are for hot loops; if an HTTP request spends its time in the database, field order helps nobody. First find the hot path with a profiler (the .NET Profiling and Diagnostics series covers those tools), then figure out whether that loop is bound by memory or by computation. The price report is live proof: the same layout change was worth 5x for an int and noise for a decimal.
Measure on a machine similar to your production hardware: on an M5 core with a 16 MB L2 and an x64 core with a 2 MB L2, the answer to "does the data fit in the cache" changes at different values of n. Don't hard-code the line size or the number of sets; even .NET's own source code defines the padding constant it uses against false sharing as 128 bytes so that it covers all the common cache line sizes. False sharing itself is the topic of the next post in the series.
When processing large data, split it into blocks (tiling): walking a 4096 × 4096 matrix in 64 × 64 tiles keeps each tile in L1/L2. Matrix multiplication, image processing and large file transformations are the classic places for this technique.
Common Pitfalls
Turning every class into a struct. Passing a 56-byte struct by value copies 56 bytes on every call, and assigning it to an interface boxes it. The measurements and rules are in the C# Advanced series post "Performance in C#: Allocations, Structs and Measuring with BenchmarkDotNet".
The data set fitting in the cache during a benchmark. The gap that looks like 1.5x at 256 × 256 is 6.5x at 4096 × 4096. Measure at least two sizes: one that fits in the cache and one that doesn't.
The prefetcher hiding the difference. With constant-stride access, code you thought was "cache-unfriendly" can turn out fast; random access (hash tables, trees) gets no such help. Your benchmark's access pattern must match the real code's.
Power-of-two sizes. Tables 1024, 2048 or 4096 wide, buffers of the same sizes, and hot fields a multiple of 4 KB apart are an invitation for conflict misses. Widening by one line is often enough.
Deleting padding with Pack = 1. It brings longs that straddle line boundaries and unaligned access; unless the byte layout is imposed from outside (a network protocol, a file format), field order is the right tool.
A Small Experiment
★☆☆ Add N = 1024 and N = 1040 to GridBenchmarks. Why is the ColumnMajor ratio worse for the power-of-two width? Run the same measurement on your x64 Windows machine and compare it with the L1d and L2 sizes in the coreinfo -l output.
★★☆ Rewrite RowMajor with a one-dimensional int[] and an r * cols + c index instead of int[,]. Does it catch up with JaggedRowMajor? Use DOTNET_JitDisasm to count the bounds checks in the inner loop.
★★★ Write a TiledTranspose that walks the matrix in 32 × 32, 64 × 64 and 128 × 128 tiles (transposing into a new array). Measure the naive transpose and the tile sizes at 4096 × 4096; which tile size wins the most, and how does that relate to the L1d size of your machine?
So far we have talked about a single core. The next post of the series, "Multi-Core, Hyper-Threading and False Sharing: Why More Cores Don't Scale Linearly", measures what happens when two cores share the same line, and how two counters sitting next to each other can make parallel code slower than a single thread.