

Scheduling: Which Thread Runs When? Context Switches, Priorities and Linux EEVDF
The scheduler runs more threads than there are cores in short slices and makes a context switch at every handoff; since 6.6 Linux does this with EEVDF, sharing fairly by nice weights. We count context switches through /proc, measure their cost, and show that nice 10 gets a tenth of the CPU, that Process.PriorityClass affects only the main thread on Linux, and that a --cpus=0.5 container is throttled in 30 of 31 periods.
Version note: The code in this post was built and run with .NET 10; tests use xUnit v3 4.0.3. Measurements were taken in mcr.microsoft.com/dotnet/sdk:10.0 containers, Ubuntu 24.04 on a Linux 6.x kernel with cgroup v2, using Docker's --cpuset-cpus and --cpus limits. Windows scheduling details come from Microsoft Learn; the Linux side comes from the kernel documentation and source code.
Guess First
Bookstore, the online bookstore used as the shared example across this site's series, produces its nightly reports on the same machine as the API. So that the report does not slow the API down, the team starts the report process with nice -n 10. Both processes use the CPU flat out and share a single core. What share of the CPU does the report get: half, a third, a tenth? And if you did the same from inside the code with Process.PriorityClass = ProcessPriorityClass.BelowNormal, would all of the process's threads slow down on Linux?
Third question: you run Bookstore in a container limited with --cpus=0.5. What does Environment.ProcessorCount return, and how many times is a job that uses the CPU with two threads for 3 seconds stopped in those 3 seconds? We measure all of it in this post.
Preemptive Scheduling, Time Slices and Context Switches
A core runs one thread at a time. When there are more processes and threads than cores, the scheduler decides which one runs when. Some older systems were cooperative: another program got its turn only when the running one gave up the CPU itself, and a program stuck in an infinite loop locked up the whole machine. Linux, Windows and macOS are preemptive: the kernel takes control back at regular intervals with a timer interrupt and, if needed, stops the running thread and puts another one in its place. The time a thread gets in one go is called a time slice, or a quantum in the Windows documentation.
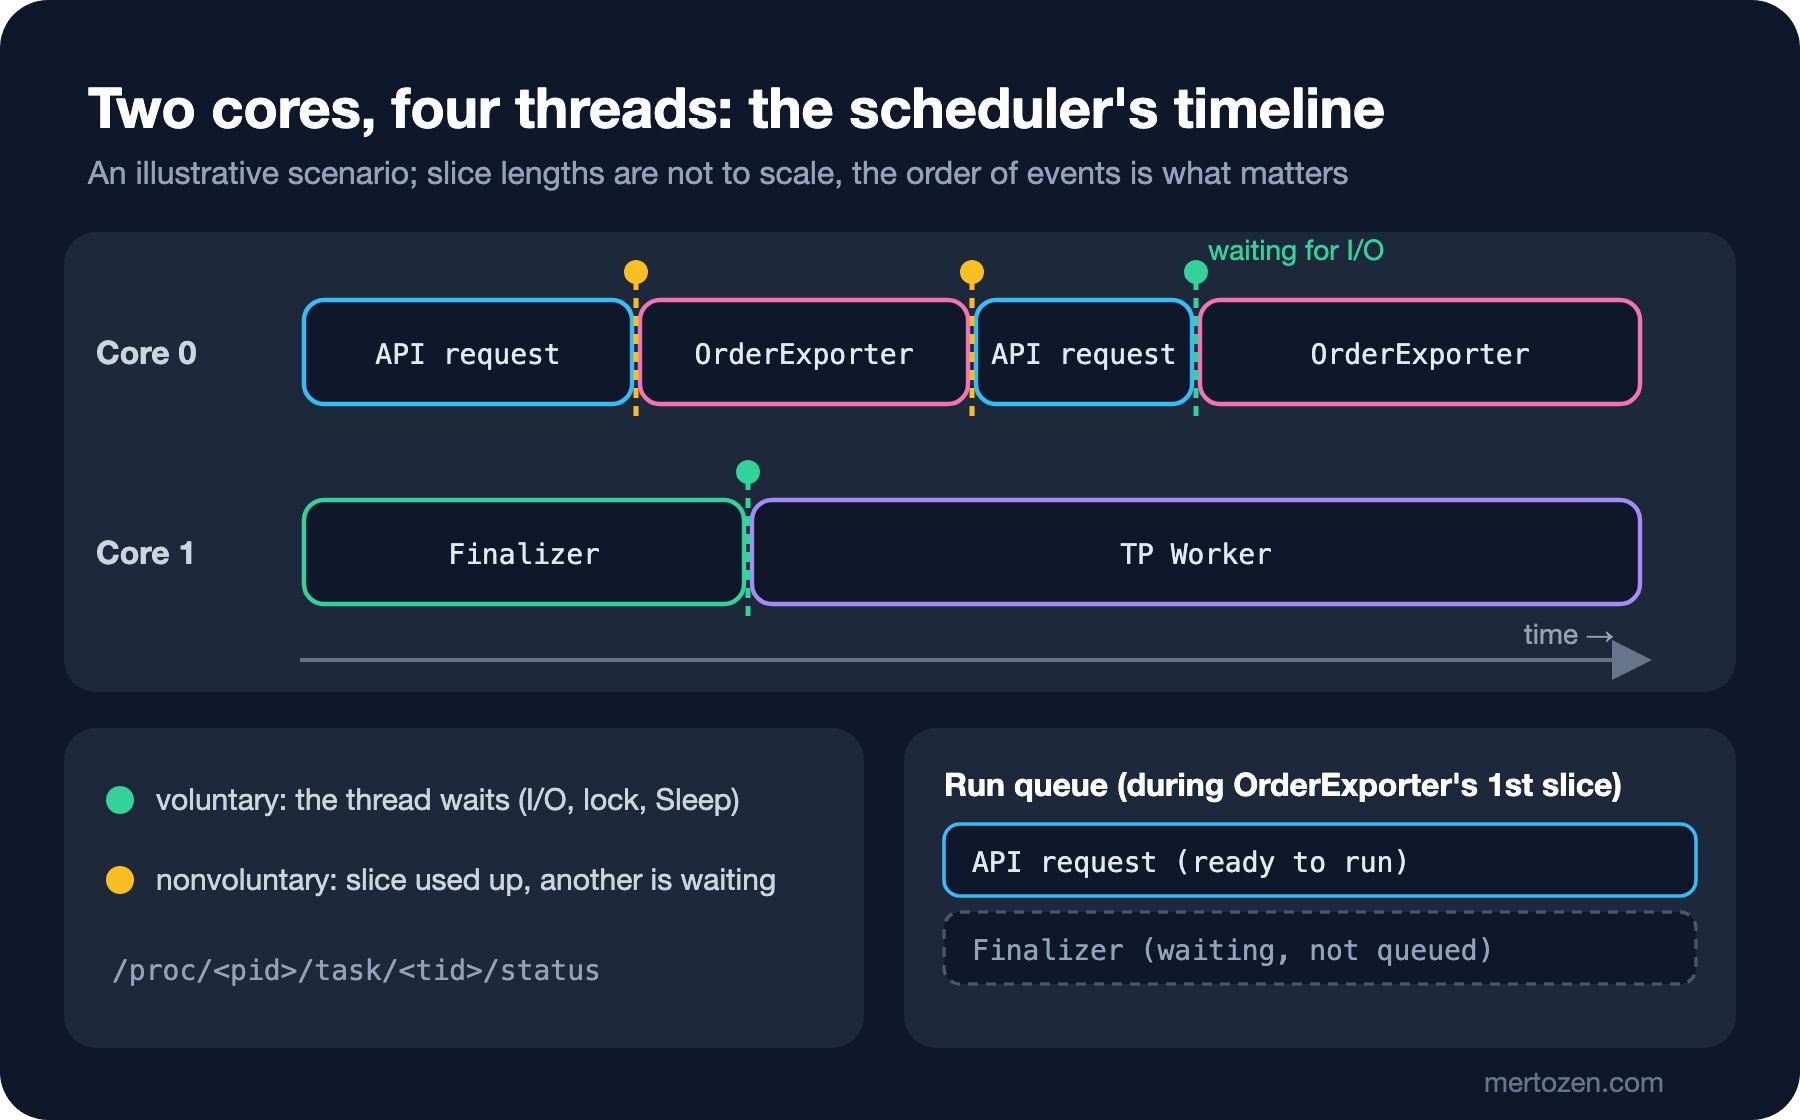
Moving from one thread to another is called a context switch. Microsoft's documentation lists the steps plainly: the context, that is the registers, of the thread that was preempted or gave up the processor is saved; if it is still ready to run it goes to the end of the queue for its priority; the highest-priority non-empty queue is found; and the context of the first thread there is restored and run. There are three common reasons for a switch: the slice expired and another thread of the same priority is ready; a higher-priority thread became ready; or the running thread had to wait. Linux keeps this distinction in two counters: switches that happen because the thread started waiting are voluntary, and switches where the scheduler takes the CPU away and gives it to someone else are nonvoluntary.
Seeing and Measuring Context Switches
These counters live in /proc/thread-self/status for every thread. I added workers that never give up the CPU to the lab application; each one reads its own counters when it finishes:
// Work that never gives up the CPU, it only increments a counter
public static long Spin(TimeSpan duration)
{
    long iterations = 0;
    Stopwatch sw = Stopwatch.StartNew();
    while (sw.Elapsed < duration)
    {
        for (int i = 0; i < 10_000; i++)
        {
            iterations++;
        }
    }
    return iterations;
}

// /proc/thread-self/status: this thread's voluntary and nonvoluntary context switch counters
public static (long Voluntary, long Involuntary) ContextSwitches()
{
    if (!OperatingSystem.IsLinux())
    {
        return (-1, -1);
    }
    long voluntary = 0, involuntary = 0;
    foreach (string line in File.ReadLines("/proc/thread-self/status"))
    {
        if (line.StartsWith("voluntary_ctxt_switches:"))
            voluntary = long.Parse(line.Split(':')[1]);
        else if (line.StartsWith("nonvoluntary_ctxt_switches:"))
            involuntary = long.Parse(line.Split(':')[1]);
    }
    return (voluntary, involuntary);
}
To squeeze four workers onto a single core I started the container with --cpuset-cpus=0:
dotnet publish src/Bookstore.OsLab -c Release -o out
docker run --rm -it --cpuset-cpus=0 -v ${PWD}/out:/app -w /app mcr.microsoft.com/dotnet/sdk:10.0 bash
dotnet Bookstore.OsLab.dll cpu-info
dotnet Bookstore.OsLab.dll workers 4 3
ProcessorCount=1
cpu.max=max 100000
worker-0: 2,897 M iterations, voluntary=0, nonvoluntary=268
worker-1: 2,902 M iterations, voluntary=0, nonvoluntary=258
worker-2: 2,904 M iterations, voluntary=0, nonvoluntary=267
worker-3: 2,920 M iterations, voluntary=0, nonvoluntary=254The four workers shared one core for 3 seconds and did almost the same amount of work. None of them gave up the CPU voluntarily, voluntary is 0; each was stopped by the scheduler about 260 times. Around a thousand switches in total over 3 seconds shows that the slices are on the order of a few milliseconds.
To see how long one switch takes, a ping-pong where two threads wake each other in turn is enough. AutoResetEvent does not spin while waiting; it blocks in the kernel directly, so every round is two real switches:
// Two threads wake each other in turn; AutoResetEvent blocks without spinning
public static (TimeSpan Elapsed, long Voluntary) PingPong(int rounds)
{
    using AutoResetEvent ping = new(false), pong = new(false);
    long ponger = 0;
    Thread other = new(() =>
    {
        for (int i = 0; i < rounds; i++)
        {
            ping.WaitOne();
            pong.Set();
        }
        ponger = ContextSwitches().Voluntary;
    });
    other.Start();

    long before = ContextSwitches().Voluntary;
    Stopwatch sw = Stopwatch.StartNew();
    for (int i = 0; i < rounds; i++)
    {
        ping.Set();
        pong.WaitOne();
    }
    sw.Stop();
    other.Join();
    return (sw.Elapsed, ContextSwitches().Voluntary - before + ponger);
}
# --cpuset-cpus=0 (one core)
100,000 round trips in 239 ms (2.39 us each), voluntary switches=217,161
# --cpuset-cpus=0,1 (two cores)
100,000 round trips in 1967 ms (19.67 us each), voluntary switches=200,779On one core a round takes 2.4 microseconds and contains two voluntary switches; so one wake-up and switch, including the kernel's wait mechanism, costs a little over a microsecond. On two cores the same work is eight times slower. The main reason is that the thread to be woken waits on another core: that core has to be brought out of its idle state and the signal has to travel between cores. These numbers were measured in the Linux VM Docker uses; they are smaller on bare metal, but the idea of the ratio stays. The real cost of a context switch is not only this time either: the new thread's data is not in the CPU caches, so its first microseconds run slowly. The cache side is a topic for the upcoming How Computers Work series.
Classic Policies: Between Interactive and Batch Work
The problem the scheduler solves is really a dilemma. A request to the Bookstore API is short but expects an answer immediately; the nightly report is long, but nobody minds if it starts a few seconds late. The first idea is FIFO, running jobs in arrival order: when a long report starts first, the short requests behind it have to wait. Round Robin gives each job a small slice in turn and reduces waiting for short jobs; but if the slice is too small most of the time goes to context switches, and if it is too large the system feels unresponsive. MLFQ, the multi-level feedback queue where jobs move between queues based on their behavior, tries to combine the two: it treats a job that gives up the CPU often as interactive and keeps it at high priority, and treats a job that uses its whole slice as batch and moves it down. Every real scheduler is an answer to this dilemma.
Linux: From CFS to EEVDF, and nice
From 2.6.23 until 6.6 Linux used CFS, the Completely Fair Scheduler, which tries to give every thread a fair share of the CPU according to its weight. The idea is simple: each thread has a weighted virtual runtime, and the one that has run least is picked. EEVDF, Earliest Eligible Virtual Deadline First, which Linux started moving to with 6.6, keeps the same fairness goal but chooses differently. According to the kernel documentation every thread has a lag: the difference between the share it deserves and the share it has received. Threads with zero or positive lag are eligible, and among them the one with the earliest virtual deadline runs. A thread that asks for a shorter slice gets an earlier deadline; applications can request this with sched_setattr(). This way latency-sensitive work can get onto the CPU more often without breaking fairness. The documentation also notes that how to handle the lag of sleeping threads is still under discussion.
The weight comes from the nice value: between -20 and 19, where a larger value means a smaller share. The table in the kernel source gives a weight of 1024 for nice 0 and 110 for nice 10, and according to the comment next to it each nice level changes the CPU share by about 10 percent. I measured the opening question on one core:
nice -n 10 dotnet Bookstore.OsLab.dll spin 5 & dotnet Bookstore.OsLab.dll spin 5; waitpid=37 Normal 15,761 M iterations
pid=36 Normal 1,991 M iterationsProcess 36 was started with nice -n 10 and did 11 percent of the total work; the weights predict 110 / 1134, or 9.7 percent. The difference comes from the two processes not starting at exactly the same moment. The report's share is not a half or a third, but about a tenth.
Windows Priorities and PriorityClass in .NET
On Windows every thread has a priority between 0 and 31. According to Microsoft's documentation this value comes from combining the process's priority class, Idle, BelowNormal, Normal, AboveNormal, High or RealTime, with the thread's level within that class; the base priority of a normal thread in the Normal class is 8. The scheduler hands out slices in turn to the highest-priority ready threads, and when a higher-priority thread becomes ready it stops the lower one without waiting for its slice to end. Unlike Linux's weighted fairness this is strict priority; the documentation says to use the High class with care and almost never to use RealTime, because it gets ahead of the system threads that handle keyboard, mouse and disk flushing.
In .NET, Process.PriorityClass changes this class directly on Windows. On Linux, according to the dotnet/runtime source, it is translated into a nice value: BelowNormal 10, Idle 19, AboveNormal -6, High -11, RealTime -19. Negative values require root privileges. There is a trap here. First I did the same measurement from inside the code; the spin command writes its second argument to Process.PriorityClass:
dotnet Bookstore.OsLab.dll spin 5 BelowNormal & dotnet Bookstore.OsLab.dll spin 5; waitpid=53 Normal 16,087 M iterations
pid=52 BelowNormal 1,752 M iterationsAs expected. But in this measurement the work ran on the main thread. Now let's look at the nice values of all of the process's threads:
case "nice":
{
    await Task.Run(() => { }); // make sure thread pool threads exist
    using (Process self = Process.GetCurrentProcess())
    {
        self.PriorityClass = ProcessPriorityClass.BelowNormal;
    }
    Thread late = new(() => Thread.Sleep(500)) { Name = "created-after" };
    late.Start();
    foreach ((string tid, string name, int nice) in SchedLab.ThreadNiceValues())
    {
        Console.WriteLine($"{tid,6} {name,-16} nice={nice}");
    }
    late.Join();
    break;
}
15024 dotnet nice=10
15105 .NET SynchManag nice=0
15106 .NET EventPipe nice=0
15107 .NET DebugPipe nice=0
15108 .NET Debugger nice=0
15109 .NET Finalizer nice=0
15110 .NET Tiered Com nice=0
15111 .NET TP Worker nice=0
15112 .NET TP Gate nice=0
15113 .NET TP Worker nice=0
15114 created-after nice=0Only the main thread became nice 10. The thread pool workers stayed at nice 0; the created-after thread we opened after the change also started at 0 in this measurement. The reason is Linux itself: the setpriority(2) man page notes that the nice value, which POSIX says belongs to the process, is a per-thread attribute on Linux. That is why the setpriority(PRIO_PROCESS, pid) call .NET uses only affects the thread whose TID equals the PID, the main thread. In an ASP.NET Core application that does its work on the thread pool, changing PriorityClass on Linux does practically nothing. Starting the process from outside with nice -n 10 does work: when I started the threads command that way in the same container, all twelve threads were at nice 10.
CPU in a Container: cpuset, Quota and Throttling
There are two ways to put a CPU limit on a container. --cpuset-cpus pins the process to specific cores; the measurements above were made this way, and Environment.ProcessorCount returned 1. --cpus limits time, not cores: it writes "at most this many microseconds per period" into the cpu.max file of cgroup v2. According to the kernel documentation, when a group uses up its quota within a period, its threads are throttled until the next period, meaning they are held back even if they are ready to run:
docker run --rm -it --cpus=0.5 -v ${PWD}/out:/app -w /app mcr.microsoft.com/dotnet/sdk:10.0 bash
dotnet Bookstore.OsLab.dll cpu-info
time dotnet Bookstore.OsLab.dll workers 2 3
cat /sys/fs/cgroup/cpu.stat
ProcessorCount=1
cpu.max=50000 100000
worker-0: 2,570 M iterations, voluntary=8, nonvoluntary=35
worker-1: 2,480 M iterations, voluntary=58, nonvoluntary=33
real 0m3.023s
user 0m1.515s
sys 0m0.005s
usage_usec 1544766
user_usec 1534876
system_usec 9889
nice_usec 0
nr_periods 31
nr_throttled 30
throttled_usec 4505300
nr_bursts 0
burst_usec 050000 100000: 50 ms of CPU in every 100 ms period. The two threads wanted to run for 3 seconds but could only get 1.5 seconds of CPU in total; the group was throttled in 30 of 31 periods. For an API inside this container that means requests are processed in the first half of every 100 ms and may all wait in the second half, which can add tens of milliseconds to the p99 latency. ProcessorCount returned 1 with the 0.5 limit; according to Microsoft's documentation the value is the smallest of the machine's core count, the affinity and the CPU limit rounded up, and it is fixed when the process starts. With --cpus=2 it returned 2, and with DOTNET_PROCESSOR_COUNT=4 I could set it to 4 by hand. The GC heap count and the thread pool's starting size look at this value; we covered how requests and limits relate to them in Kubernetes in the resource requests and limits post of the published Kubernetes series.
Production Notes
If you set a CPU limit on a container, watch nr_throttled and throttled_usec in cpu.stat; these numbers explain why latency fluctuates while the CPU usage graph sits flat at 50 percent. For APIs that need high CPU for short bursts, a low limit means throttling even when average usage is low.
Watching the context switch count helps too. The two counters in /proc/<pid>/status give the total for the process; if the nonvoluntary count grows quickly there is more work than CPU, and if the voluntary count is very high the threads may be constantly waiting for a lock or for each other. Giving blocking work to the thread pool increases both.
Common Pitfalls
Treating priority as a performance setting. Raising a job's priority does not make the total work faster; it only changes the order. In Windows' strict priority model, a high-priority thread that never gives up the CPU may never let lower-priority ones run at all, which is starvation. When a high-priority thread waits for a lock held by a low-priority thread, you get priority inversion. The theory behind both problems is a topic for the upcoming Concurrency Theory series.
"Fixing" things with Thread.Sleep(0) or Thread.Yield(). According to the .NET documentation, Thread.Yield gives way only to another ready thread on the same core; if nobody is waiting, nothing happens. Adding Yield to a loop does not fix a race condition; it only changes its timing and makes it show up less often. If you need to wait, use a real synchronization primitive.
Relying on Process.PriorityClass on Linux. As we saw above, it only affects the main thread. If you want to slow background work down, start it as a separate process with nice, or give it its own CPU limit in a container.
Taking ProcessorCount in a container for the machine's core count. When you size parallelism, channels or worker counts, use Environment.ProcessorCount, not your own guess; when the limit changes, the value changes too.
A Small Experiment
★☆☆ In the single-core container run workers 2 3, workers 4 3 and workers 8 3. Put the total iteration count and the nonvoluntary switches per thread into a table and see how they change.
★★☆ Race two spin processes on the same core with nice -n 5 and nice -n 15. Compare the result with the ratio you compute from the kernel's weight table: 335 for nice 5 and 36 for nice 15.
★★★ Run an ASP.NET Core Minimal API in a --cpus=0.5 container and write an endpoint that spends 30 ms of CPU on every request. Load it with 10 requests per second, measure p99 latency and nr_throttled, then repeat the experiment with --cpus=1.
In this post we saw how threads share the CPU. The second big shared resource is memory. In the next post we look at virtual memory: how can the 17 GB VmSize and the 27 MB VmRSS from the second post belong to the same process, what do the page table and the TLB do, and what difference does it make whether a page fault is minor or major?