

What Does an Operating System Do? Kernel Mode, User Mode and System Calls

An operating system virtualizes the CPU and memory, shares and protects resources between processes and makes data persistent; when your application needs something from it, it makes a system call that switches from user mode to kernel mode. We trace the seven syscalls behind File.ReadAllText with strace, see .NET's System.Native layer, and measure that writing a log by reopening the file for every line is 38 times slower than buffered writing.
Version note: The code in this post was built and run with .NET 10; tests use xUnit v3 4.0.3 and measurements BenchmarkDotNet 0.15.8. Linux observations were made with strace 6.8 in a mcr.microsoft.com/dotnet/sdk:10.0 container based on Ubuntu 24.04, on a Linux 6.x kernel. The macOS and Windows tools are described from their official documentation.
Guess First
Bookstore, the online bookstore used as the shared example across this site's series, reads its catalog from a small JSON file at startup: File.ReadAllText("data/catalog.json"). The file is 460 bytes and holds four books. How many times does that single line call into the operating system: once, three times, seven times? And how many times does the dotnet process running it enter the kernel from start to exit: a hundred, a thousand?
Second question: how much faster is code that writes the order log through a StreamWriter than code that calls File.AppendAllText for every line? We will answer with real strace output and a BenchmarkDotNet measurement. The question for the whole series stays the same: why does my application behave this way, and what does that look like at the operating system level?
What Does an Operating System Do for an Application?
When you run the Bookstore API, your code behaves as if it were alone on the machine, with its own CPU, its own memory and its own disk. In reality SQL Server, a reverse proxy and maybe a few hundred other processes run on the same machine. The operating system is what makes that picture possible. From an application developer's point of view it does three jobs.
The first is virtualization. It shares a few CPU cores among hundreds of threads in very short slices and gives each of them the feeling that it runs all the time; how it does that is the topic of scheduling, the fourth post in this series. It also shows every process physical memory as if it had a private address space of its own, which is the topic of virtual memory in the fifth post. The second job is sharing and protection. CPU time, memory, files and network connections are divided among processes, and no process may touch another one's memory or files without permission. Direct access to hardware is concentrated in one place, the kernel. The third job is persistence. Data that must survive a power cut is written to disk through a file system, so the file holding the price of Dune is still there tomorrow morning.
It offers all of this through abstractions: files instead of disk sectors, sockets instead of network cards, processes instead of running code.
The inner structure of the kernel differs between systems. Linux is a monolithic kernel: the scheduler, memory management, file systems, the network stack and drivers all run in kernel mode in the same address space. The microkernel approach keeps the kernel small and runs services such as file systems and drivers as separate processes that exchange messages. Windows NT is usually classified as hybrid: it was influenced by microkernel ideas, but its executive and drivers run in kernel mode. XNU, the macOS kernel, is hybrid as well; Apple's documentation describes it as Mach, BSD and the I/O Kit living together. For an application developer the difference is small: on all three, your application makes a system call when it wants something from the kernel.
User Mode, Kernel Mode and Privilege Rings
Protection starts in hardware. A CPU supports at least two privilege levels and keeps the current one in a register. On x86 these levels are called rings and there are four of them, 0 to 3; Linux and Windows use only two: ring 0 for the kernel and ring 3 for applications. On ARM the equivalent is exception levels; applications run at EL0 and the kernel at EL1.
Code running in user mode cannot execute certain instructions, such as disabling interrupts, changing the page table or writing to I/O ports directly. If it tries, the CPU raises an exception and control passes to the kernel. Memory has the same split: pages that belong to the kernel cannot be read from user mode. According to Microsoft's driver documentation, every user mode application gets a private virtual address space and handle table, while all kernel mode code shares a single address space. That is why a NullReferenceException in Bookstore only takes down the process, while a faulty driver can bring down the whole system.
System Calls: The Only Way to Ask the Kernel for Something
If code in ring 3 cannot write to the disk, how does File.ReadAllText work? The answer is a system call, or syscall. The application puts the number of the requested operation and its arguments into registers and executes a special instruction: syscall on x86-64, svc on ARM64. At that point the CPU switches to ring 0 and jumps to a fixed entry point the kernel set up at boot. The application cannot jump to an arbitrary address inside the kernel; this door is the only way in.
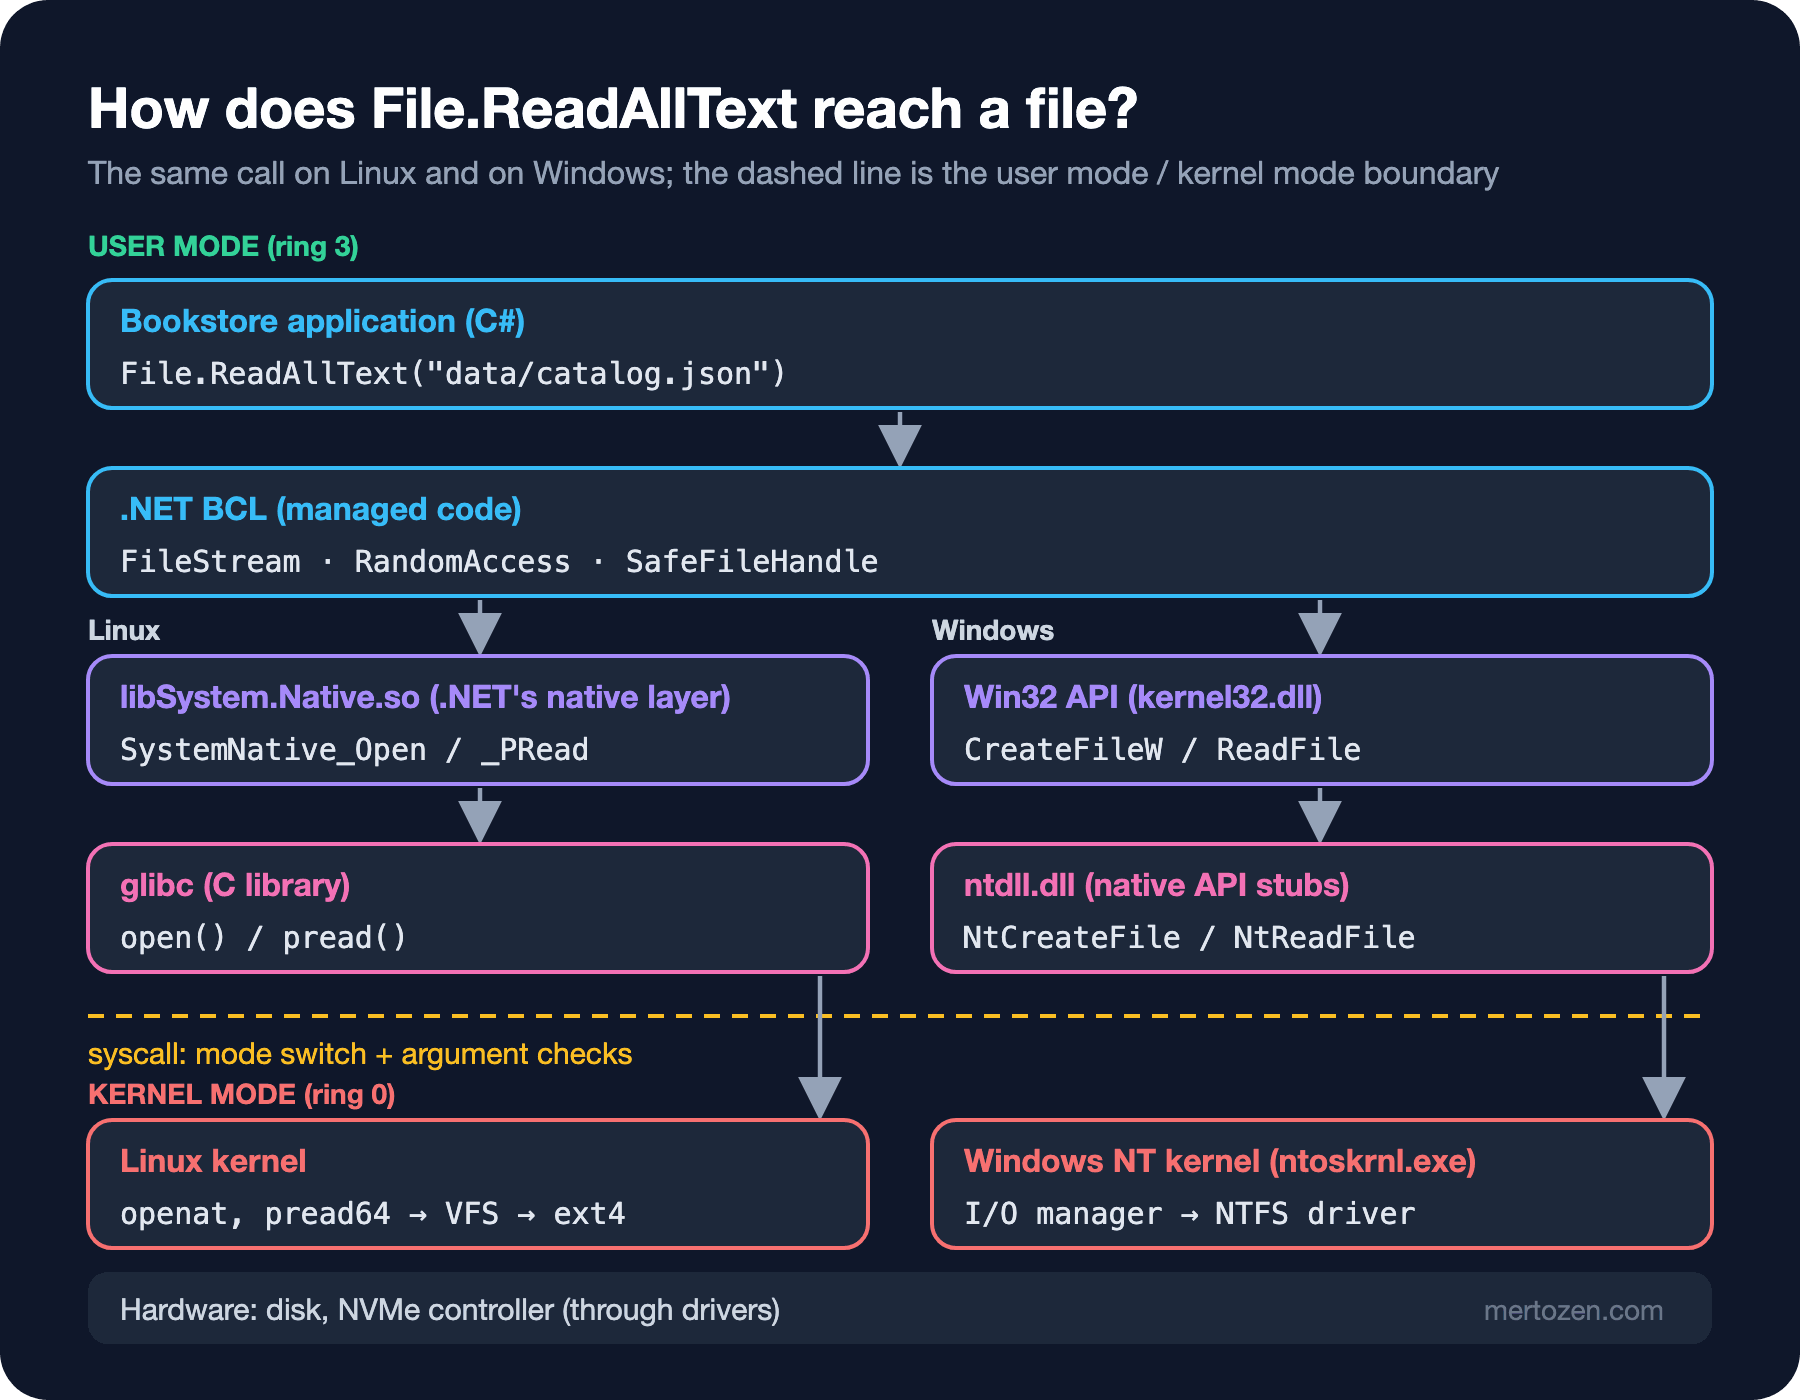
Once inside, the kernel does not trust the application. Microsoft's documentation on native system services says parameters coming from user mode are treated as untrusted and validated thoroughly before use, including checking that a supplied buffer really lies in the caller's memory. Linux does the same: is the file descriptor valid, does the pointer point into user space, may this process read this file? When the work is done the kernel writes the result into a register and returns to ring 3. On Linux an error comes back as a negative error code; glibc, the standard C library on Linux, turns it into -1 and errno, and .NET eventually turns that into an IOException.
This transition has a cost that has nothing in common with a normal method call. Registers are saved, kernel entry code runs, and everything is restored on the way back. The mitigations added after the Meltdown vulnerability in 2018 made it more expensive still: the Linux kernel documentation says PTI, the mitigation that separates kernel and user page tables, switches page tables on every kernel entry and exit, which alone costs on the order of a hundred cycles. On top of that comes the actual work the kernel does and the disturbance to the CPU caches. In short, a syscall is much more expensive than an empty method call; we will measure how much more below.
Watching File.ReadAllText with strace
Enough theory; let's look. The easiest way to see the syscalls of a process on Linux is strace: it uses the kernel's ptrace mechanism to stop the target process at every syscall and prints the call with its arguments. On Windows with Docker Desktop or WSL, or on macOS with Docker, you set up the same environment like this; it works from PowerShell, and --cap-add=SYS_PTRACE lets strace use ptrace:
docker run --rm -it --cap-add=SYS_PTRACE -v ${PWD}:/src -w /src mcr.microsoft.com/dotnet/sdk:10.0 bash
apt-get update && apt-get install -y strace
dotnet publish src/Bookstore.OsLab -c Release -o /app
cd /app
The lab application is a small console app called Bookstore.OsLab; every post in the series adds a command to it. The first command reads the catalog:
using Bookstore.OsLab;

string command = args.Length > 0 ? args[0] : "help";

switch (command)
{
    case "read-catalog":
        string json = File.ReadAllText("data/catalog.json");
        Console.WriteLine($"catalog.json: {json.Length} chars");
        break;

    case "log-naive":
        OrderLog.WriteNaive("orders.log", int.Parse(args[1]));
        break;

    case "log-buffered":
        OrderLog.WriteBuffered("orders.log", int.Parse(args[1]));
        break;

    default:
        Console.WriteLine("usage: read-catalog | log-naive N | log-buffered N");
        break;
}
Now let's trace only the syscalls that touch catalog.json. -f also follows child processes and threads, -y prints the file path next to each file descriptor number, and -P filters the output to a single file:
strace -f -y -P /app/data/catalog.json dotnet Bookstore.OsLab.dll read-catalog[pid 714] openat(AT_FDCWD</app>, "/app/data/catalog.json", O_RDONLY|O_CLOEXEC) = 22</app/data/catalog.json>
[pid 714] fstat(22</app/data/catalog.json>, {st_mode=S_IFREG|0644, st_size=460, ...}) = 0
[pid 714] flock(22</app/data/catalog.json>, LOCK_SH|LOCK_NB) = 0
[pid 714] pread64(22</app/data/catalog.json>, "[\n { \"isbn\": \"9780441172719\", \""..., 4096, 0) = 460
[pid 714] pread64(22</app/data/catalog.json>, "", 4096, 460) = 0
[pid 714] flock(22</app/data/catalog.json>, LOCK_UN) = 0
[pid 714] close(22</app/data/catalog.json>) = 0
catalog.json: 460 charsThe answer to the first question is seven. openat opens the file and returns a number in the table the kernel keeps for this process: file descriptor 22. Numbers 0, 1 and 2 belong to stdin, stdout and stderr, and the ones in between are the runtime's own files. The O_CLOEXEC flag ensures that the descriptor is not inherited if this process later starts a child process; we will see why that matters in the next post. fstat asks for the file's type and size; .NET also uses it to check that what it opened is not a directory.
The flock line surprises most people. On Unix, open has no sharing mode like the one on Windows. To emulate FileShare, .NET takes an advisory lock after opening the file: exclusive for FileShare.None, shared for every other value. Because it is advisory, it only affects processes that use the same mechanism. Then come two pread64 calls: the first reads 460 bytes into a 4096-byte buffer, the second returns 0, which means end of file. The last two lines release the lock and close the file.
What about the process as a whole? -c prints a summary table instead of every call:
strace -f -c -o summary.txt dotnet Bookstore.OsLab.dll read-catalog% time seconds usecs/call calls errors syscall
------ ----------- ----------- --------- --------- -----------------------
41.31 0.008971 4485 2 ppoll
26.25 0.005701 167 34 3 futex
4.94 0.001072 6 157 mmap
3.77 0.000818 2 340 mprotect
3.16 0.000687 9 76 read
2.89 0.000628 8 78 18 openat
2.82 0.000612 6 93 89 readlinkat
1.79 0.000389 7 54 munmap
1.76 0.000383 6 60 close
1.47 0.000320 5 63 fstat
1.33 0.000288 41 7 clone
0.64 0.000139 4 31 madvise
...
------ ----------- ----------- --------- --------- -----------------------
100.00 0.021714 16 1278 126 total1278 syscalls in total, and only seven of them are ours. The rest is the runtime starting up: mapping assemblies and native libraries into memory with mmap, making pages of the memory regions it reserved usable one by one with mprotect, starting seven threads with clone, and threads waiting for each other with futex. There are also 126 failed calls, and most of them are normal: the runtime checks a few paths to see whether the LTTng tracing library is installed and gets ENOENT. An error in strace output does not always mean a problem.
strace -f dotnet run works too, but dotnet run builds the project with MSBuild first and -f follows those child processes as well, so the output fills up with build activity. Running the built dll directly is cleaner.
Where Does the .NET Runtime Talk to the OS?
Let's look at the .NET part of the layers in the figure. .NET talks to the OS in two separate places. The first is the runtime itself: the CoreCLR GC, JIT and thread management are written in C++ and were historically designed against the Win32 API. On Linux and macOS the Win32 functions this code needs are provided by the PAL, the Platform Adaptation Layer that emulates them on top of POSIX.
The second is the BCL you use, the Base Class Library. Classes such as FileStream, Socket and Process call small native libraries like libSystem.Native.so on Unix. The interop guidelines in the dotnet/runtime repository explain why these shims exist: Unix systems offer the same API at the source level but differ at the binary level; struct field layouts, the numeric values of constants and symbol names can change between Linux and macOS, and even between processor architectures. A single P/Invoke declaration cannot work everywhere, so the shim is a thin C layer that offers the same signature on every platform. For example, SystemNative_Open converts the flags to the platform's values and calls libc's open(), which glibc turns into the openat syscall. You can see the moment the library is loaded in strace:
strace -f -e trace=openat dotnet Bookstore.OsLab.dll read-catalog 2>&1 | grep -E "System.Native|catalog"[pid 1621] openat(AT_FDCWD, "/usr/share/dotnet/shared/Microsoft.NETCore.App/10.0.15/libSystem.Native.so", O_RDONLY|O_CLOEXEC) = 14
[pid 1621] openat(AT_FDCWD, "/app/data/catalog.json", O_RDONLY|O_CLOEXEC) = 22
catalog.json: 460 charsOn Windows there is no shim: the BCL calls CreateFileW and ReadFile in kernel32.dll directly, these go down to the NtCreateFile and NtReadFile stubs in ntdll.dll, and that is where the syscall happens. We covered the P/Invoke mechanism under these calls in the C# Advanced series post "Interop and unsafe Code in C#: P/Invoke, Pointers and fixed"; what matters here is that every .NET I/O call ends up passing through these layers and becoming a syscall.
The Same Observation on macOS and Windows
The tools in this section were not run for this post; I describe them from their official documentation. macOS has no strace. Its classic counterpart is the DTrace-based dtruss, but with System Integrity Protection enabled DTrace is restricted, and turning SIP off is not recommended. Use fs_usage instead: according to its man page it reports file system related syscalls and page faults in real time, needs root and can be filtered by process name with sudo fs_usage -w -f filesys dotnet. For a more detailed view, the System Trace template in Instruments records syscalls, thread scheduling and virtual memory operations. My practical advice: on a Mac, run the observations in this series in a Linux container with Docker.
On Windows the counterpart is Process Monitor from Sysinternals. According to its documentation it shows file system, Registry and process/thread activity in real time and captures the thread stack for every operation. Set the Process Name filter to dotnet.exe, run the application that reads catalog.json, and you will see operations such as CreateFile, ReadFile and CloseFile. Keep one difference in mind: Process Monitor shows file system and Registry operations inside the kernel, not the syscalls themselves, so its output does not map line by line to strace output.
Syscalls Are Not Cheap: Why Buffering Exists
Now the second question. Two versions of the code that writes Bookstore's order log:
namespace Bookstore.OsLab;

public static class OrderLog
{
    public static string FormatLine(int orderNo) =>
        $"order={orderNo:D6} isbn=9780441172719 qty=1 total=420.00 TRY";

    // Opens, writes and closes the file for every line
    public static void WriteNaive(string path, int count)
    {
        for (int i = 1; i <= count; i++)
        {
            File.AppendAllText(path, FormatLine(i) + "\n");
        }
    }

    // Opens the file once; lines pile up in the StreamWriter's buffer
    public static void WriteBuffered(string path, int count)
    {
        using StreamWriter writer = new(path, append: true);
        for (int i = 1; i <= count; i++)
        {
            writer.Write(FormatLine(i));
            writer.Write('\n');
        }
    }
}
An xUnit test confirms that both produce byte-for-byte identical files (OrderLogTests in the snapshot). On the kernel side they are two different worlds. The relevant lines from the strace -c summaries for a thousand lines:
strace -f -c -o naive.txt dotnet Bookstore.OsLab.dll log-naive 1000
strace -f -c -o buffered.txt dotnet Bookstore.OsLab.dll log-buffered 1000
# log-naive 1000
2.83 0.005745 2 2000 flock
2.04 0.004142 3 1160 82 openat
1.68 0.003416 3 1000 pwrite64
1.62 0.003287 3 1077 fstat
1.62 0.003285 3 1081 close
1.57 0.003176 3 1000 fstatfs
1.35 0.002728 2 1000 lseek
100.00 0.202783 19 10570 177 total
# log-buffered 1000
3.70 0.000657 4 160 82 openat
1.54 0.000274 3 81 close
1.31 0.000232 2 78 fstat
0.00 0.000000 0 14 pwrite64
100.00 0.017775 12 1397 173 totalFile.AppendAllText opens the file from scratch on every call: openat, fstatfs asking about the file system, flock, lseek asking for the position, fstat asking for the size, the actual pwrite64, a second flock releasing the lock, and close. Eight syscalls per line, 10,570 for a thousand lines. The buffered version opens the file once; the 55,000 bytes are written whenever the 4096-byte buffer fills up, and 14 pwrite64 calls are enough. I measured the time difference with BenchmarkDotNet in the same container for 10,000 lines:
| Method   | Lines | Mean        | Error       | StdDev      | Median      | Ratio | RatioSD | Allocated | Alloc Ratio |
|--------- |------ |------------:|------------:|------------:|------------:|------:|--------:|----------:|------------:|
| Naive    | 10000 | 22,638.6 us | 1,235.39 us | 3,360.96 us | 21,546.4 us |  1.02 |    0.20 |   3.66 MB |        1.00 |
| Buffered | 10000 |    595.5 us |    11.14 us |    15.98 us |    595.1 us |  0.03 |    0.00 |   1.31 MB |        0.36 |
About 38 times. The naive version spends 2.3 microseconds per line on average, the buffered one 0.06; most of the difference comes from those eight trips to the kernel. That works out at roughly a few hundred nanoseconds per syscall, including the mode switch, the kernel's checks and the actual work. This is exactly why buffering exists: if going to the kernel is expensive, collect work before you go. StreamWriter, FileStream and glibc's fwrite are built on the same idea. It has a price: data in the buffer has not been handed to the kernel yet, so if the process crashes at that moment the last lines are lost. Whether data handed to the kernel has reached the disk is a separate question, which we will discuss with fsync in the file system post.
Production Notes
strace is not free: it stops the target process at every syscall, and a syscall-heavy process slows down noticeably. That is why the counts in the tables above are reliable but the times are not. If you need to attach to a Bookstore API in production, take a short summary with strace -f -c -p <PID>, trace only the calls you care about with a filter such as -e trace=openat,connect, and detach when you are done. For lower-overhead observation there are eBPF-based tools and perf trace.
Running strace in a container needs ptrace permission. In your own container --cap-add=SYS_PTRACE is enough; a pod running in Kubernetes is entered through an ephemeral debug container instead. The .NET tooling side of diagnosis is in the dump and hang posts of the Debugging and Problem Solving series.
strace is most useful for "file not found" and "permission denied" errors: strace -f -e trace=%file -Z shows only the failed file calls, so you can see the exact path where the process looked for a configuration file.
Common Pitfalls
Treating a syscall as being as cheap as a method call. File.AppendAllText, File.ReadAllText and File.WriteAllText are convenience methods; they open and close the file on every call. Inside a loop they produce the 38x difference above. If you write in a loop, open the file once.
Writing to the console often. Console.Out flushes after every write. In the same container, the loop for (int i = 0; i < 1000; i++) Console.WriteLine(i); produced 2006 write syscalls, two per call, because the overload that takes an int writes the value and the line break separately. Printing logs to the console in a hot loop is therefore expensive; logging frameworks have their own buffers and background writers for this reason.
Forgetting the buffer. Buffered data stays in the process's memory until Dispose or Flush is called. If the process exits with a StreamWriter opened without using, the last lines never reach the file.
A Small Experiment
★☆☆ Build the StreamWriter in WriteBuffered on top of a FileStream created with new FileStreamOptions { Mode = FileMode.Append, Access = FileAccess.Write, BufferSize = 65536 }. Count how many pwrite64 calls remain for a thousand lines with strace -c and compare with 14.
★★☆ Next to read-catalog, add a command that reads the file with a ReadByte loop over a FileStream opened with bufferSize: 1. Write down how many read or pread64 calls you see in the strace -y -P /app/data/catalog.json output, then measure the same work with BenchmarkDotNet.
★★★ Run an ASP.NET Core Minimal API in the same container and attach with strace -f -e trace=%network -p <PID>. During a single curl request, note which network syscalls are made and which thread handles the request. We will read this output again in the I/O models post.
Every line of strace output in this post started with a pid, and clone started seven new threads. In the next post we look at the concept behind that number: the process. What is inside an address space, what does /proc/<pid>/maps tell you about a .NET process, and why can Bookstore hang when it calls an external tool with Process.Start?