

Virtual Memory: Pages, Page Tables, the TLB and Page Faults

Virtual memory gives every process its own address space and translates addresses to physical memory page by page; reserving a range and giving it RAM are separate steps, and RAM arrives only when a page is touched. We measure a 512 MB allocation adding 3 MB of resident memory, then 513 MB and 131 thousand minor faults once touched, and show that .NET's 17 GB VIRT is the GC reserve and that a 256 MB container accepts a 1 GB allocation and is then killed by the OOM killer.
Version note: The code in this post was built and run with .NET 10; tests use xUnit v3 4.0.3. Measurements were taken in mcr.microsoft.com/dotnet/sdk:10.0 containers based on Ubuntu 24.04, on a Linux 6.x kernel with 4 KB pages and cgroup v2. Windows and macOS details come from Microsoft Learn and Apple documentation, and GC behavior from the dotnet/runtime source code.
Guess First
On the monitoring screen of Bookstore, the online bookstore used as the shared example across this site's series, the API process shows 17 GB of virtual memory and 27 MB of resident memory. Someone on night duty raises the alarm: "17 GB, there is a memory leak." Are they right?
Two more questions: Bookstore's report module takes a 512 MB buffer from native memory. By how many MB does the process's resident memory grow as soon as the allocation finishes? And if you ask for a 64 GB allocation, far more than the container has, what happens: do you get an error right away, or does it succeed? In this post we measure all three and look at how virtual memory works.
Why Virtual Addresses?
In the second post we said every process has an address space of its own. What that means is that the addresses a process uses are not addresses in physical RAM but virtual addresses. On every memory access the CPU translates such an address into a physical one, using a table the kernel prepared for that process. Even if two processes use the same virtual address they reach different physical memory, which is why one cannot read the other's memory.
This layer brings other conveniences too. Every process sees itself as the owner of an empty, orderly address space and does not have to think about where the program is loaded. The kernel can show the same physical page to more than one process; that is how shared libraries are shared. And, most importantly for this post, setting aside an address range and giving that range physical memory become separate steps. The process's "17 GB" comes from this separation.
Pages, the Page Table and the TLB
Translation does not work byte by byte but in fixed-size blocks: pages on the virtual side and frames on the physical side. On x86-64 and in the Linux containers in this post a page is 4 KB; in .NET Environment.SystemPageSize returns this value, and it measured 4096. On Apple Silicon Macs a page is 16 KB; Apple's Apple Silicon transition documentation says the page size differs from Intel Macs and recommends reading it from vm_page_size instead of hard-coding it.
Every process has a page table: it records which virtual page maps to which frame, its permissions to read, write and execute, and whether the page is in memory. For a 64-bit address space a flat table would be enormous, so the table is a tree. On x86-64, on most systems, a 48-bit virtual address is split into four parts; every 9 bits are the index into the table at one level, and the last 12 bits are the offset within the page. Tables are created only for the branches that are used.
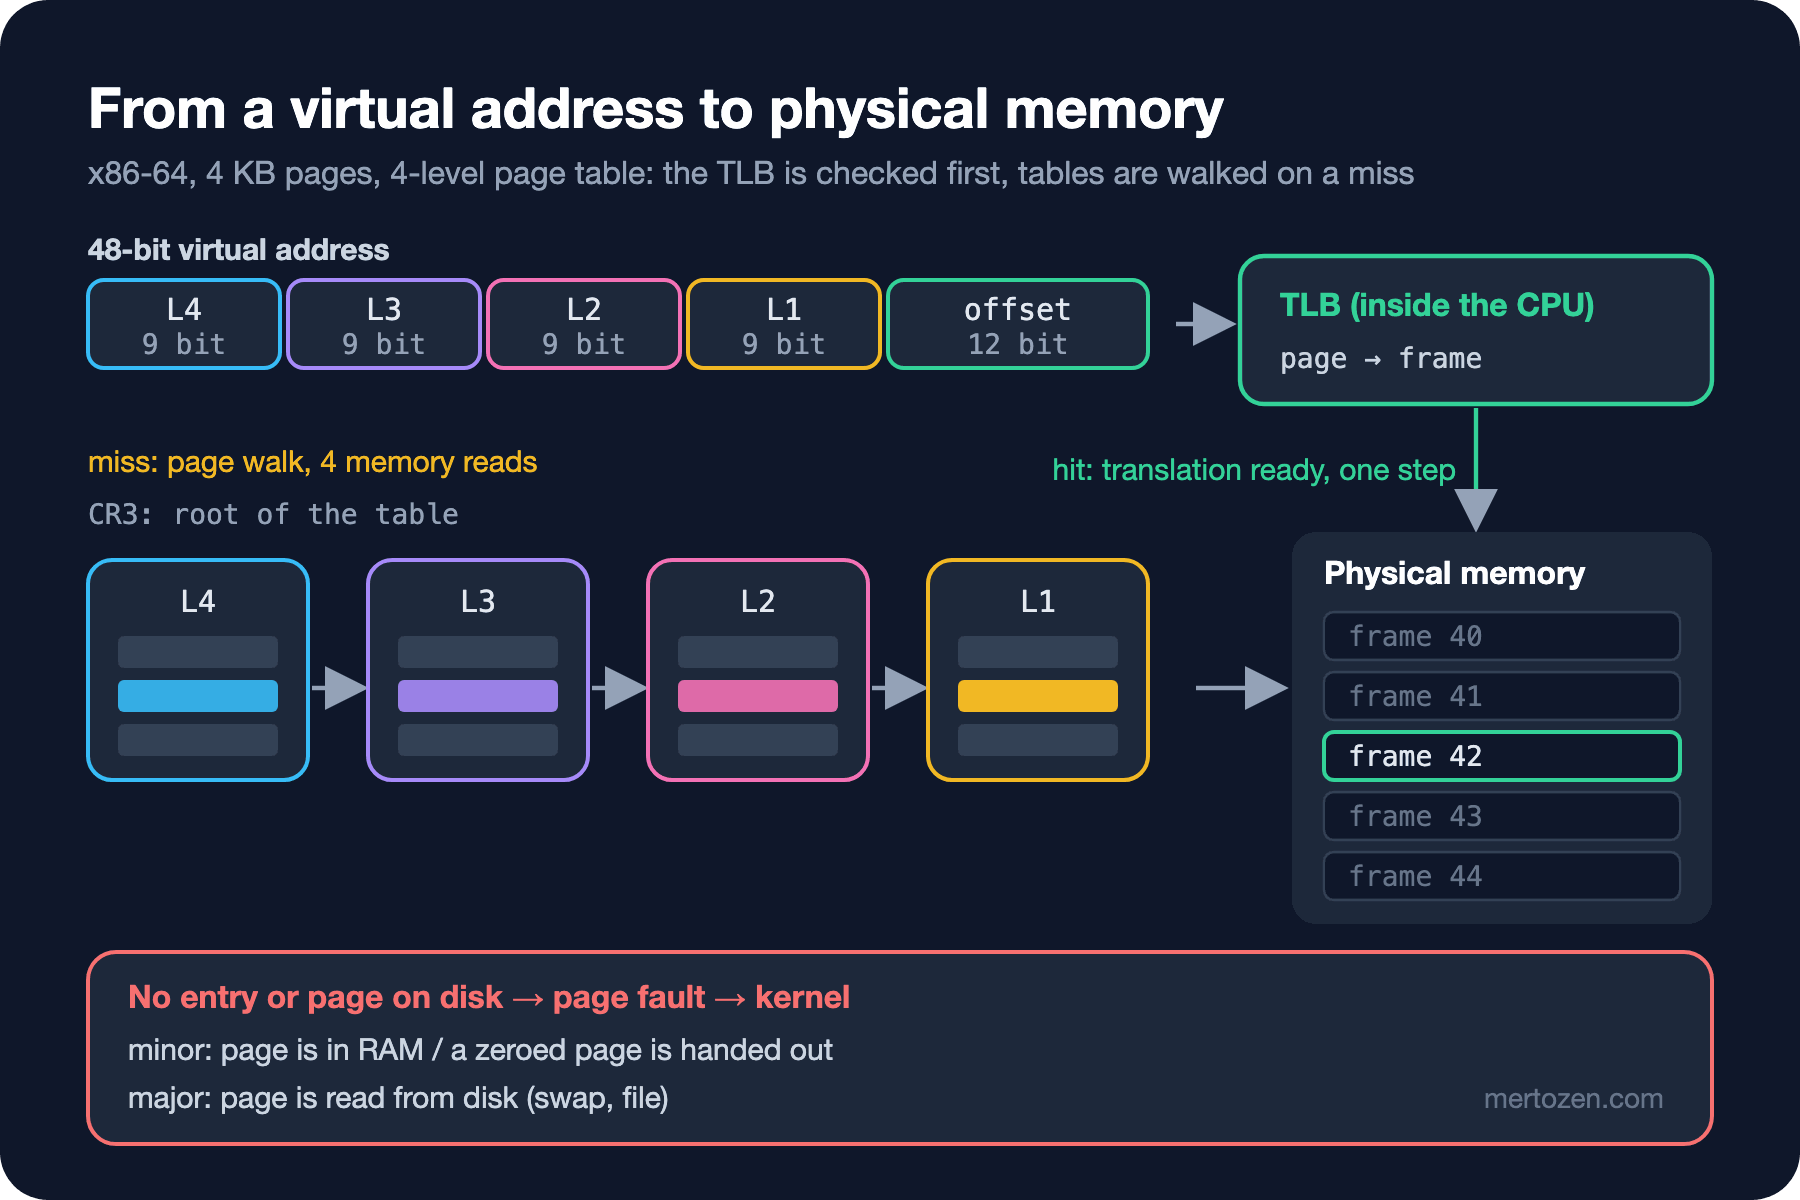
Walking a four-level table on every memory access would mean four extra memory reads. What prevents that is the TLB inside the CPU, a small cache of recently used address translations. If the translation is in the TLB it finishes in one step; if not, on a TLB miss, the hardware walks the tables and puts the result in the TLB. The TLB has a limited number of entries, so a very large heap accessed in a scattered way can slow down with TLB misses. The answer to that is huge pages, called large pages on Windows: on x86-64 a single 2 MB page uses one TLB entry instead of 512 entries for 4 KB pages. According to Microsoft's documentation, large pages on Windows require the SeLockMemoryPrivilege privilege, and this memory is never written to disk. On Linux, transparent huge pages are applied automatically by the kernel. Large page support in the .NET GC can be turned on with DOTNET_GCLargePages, but the documentation marks it as experimental and it requires a heap hard limit.
Demand Paging: Memory Arrives When You Touch It
When a process asks for an address range, the kernel does not give it physical memory right away; it only notes in the page table that the range is valid. When the process touches a page in that range for the first time, the CPU cannot find a translation and raises a page fault. At that point the kernel finds a free frame, zeroes it, writes it into the page table, and the process continues from the instruction where it stopped. This is called demand paging. The lab application has a command that takes native memory and writes one byte to every page:
// Writes one byte to every page; the first touch causes a page fault
public static void TouchPages(IntPtr block, long size)
{
    int page = Environment.SystemPageSize;
    for (long offset = 0; offset < size; offset += page)
    {
        Marshal.WriteByte(block + (nint)offset, 1);
    }
}

public static IEnumerable<string> DemandPaging(int megabytes)
{
    long size = (long)megabytes << 20;
    yield return $"start          {Snapshot()}";

    IntPtr block = Marshal.AllocHGlobal((nint)size);
    yield return $"allocated      {Snapshot()}";

    TouchPages(block, size);
    yield return $"touched        {Snapshot()}";

    TouchPages(block, size);
    yield return $"touched again  {Snapshot()}";

    Marshal.FreeHGlobal(block);
    yield return $"freed          {Snapshot()}";
}
Snapshot reads virtual and resident memory from the Process class and, on Linux, the page fault counts from fields 10 and 12 of /proc/self/stat:
dotnet Bookstore.OsLab.dll paging 512start virtual= 17349 MB resident= 29 MB minflt= 2261 majflt=3
allocated virtual= 17934 MB resident= 32 MB minflt= 2602 majflt=3
touched virtual= 17934 MB resident= 545 MB minflt= 133744 majflt=3
touched again virtual= 17934 MB resident= 545 MB minflt= 133780 majflt=3
freed virtual= 17422 MB resident= 33 MB minflt= 133794 majflt=3The answer to the second question: after the allocation, resident memory grew by only 3 MB, while virtual memory grew by 585 MB. Physical memory arrived the moment we wrote to the pages: resident memory grew by 513 MB and 131,142 minor page faults occurred. 512 MB contains 131,072 pages of 4 KB; so almost exactly one fault per page. On the second pass the pages were already in memory, and the fault count grew by only 36. FreeHGlobal gave the memory back to the kernel and resident memory returned to where it was.
The proc(5) man page separates the two kinds of fault by whether a disk read is needed. In a minor fault the page is already in RAM, or the kernel hands out a new zeroed page; the disk is not involved. In a major fault the page is read from disk: a page that was written to swap, or a part of a mapped file that has not been loaded yet. Reading from disk can take milliseconds rather than microseconds. ps -o min_flt,maj_flt -p <pid> gives both numbers for a process; a growing maj_flt is often the first sign that memory is running short.
Why Is VIRT So Huge in a .NET Process?
Now the first question. Even the lab application doing nothing shows 17 GB of virtual memory. In the second post we saw that most of it is a single region reserved by the GC. According to Microsoft's GC configuration documentation, since .NET 7 the GC heap is made of regions, and at startup the GC only reserves a virtual memory range without committing it. You can ask the runtime for the size of this range with GC.GetConfigurationVariables():
case "gc-config":
    foreach (KeyValuePair<string, object> kv in GC.GetConfigurationVariables())
    {
        if (kv.Key is "GCRegionRange" or "GCHeapHardLimit")
        {
            Console.WriteLine($"{kv.Key} = {kv.Value}");
        }
    }
    break;
dotnet Bookstore.OsLab.dll gc-configGCHeapHardLimit = 0
GCRegionRange = 16434118656About 15.3 GB. According to the GC source in dotnet/runtime, without a limit Workstation GC chooses this range as the smaller of 256 GB and twice the physical memory; Server GC chooses the larger. So on a server with a lot of RAM the same application can show 256 GB of VIRT, and that is completely normal. Let's look at the process's own metrics:
dotnet Bookstore.OsLab.dll mem-infoSystemPageSize = 4096
VirtualMemorySize64 = 17387 MB
WorkingSet64 = 26 MB
PrivateMemorySize64 = 65 MB
GC.GetTotalMemory = 83 KBFour numbers, four different questions. The night-duty alarm was wrong: VIRT is an address range, not RAM. What reveals a memory leak is resident or private memory that keeps growing over time. The difference between GC.GetTotalMemory, which gives the total of live objects on the GC heap, and resident memory, and what it means in a container, is the topic of the next post.
Memory Metrics: RSS, Working Set, Private Bytes and Commit
The same concepts appear under different names on different platforms. According to the dotnet/runtime source, on Linux the values of the Process class come straight from /proc/<pid>/status:
| Question | Linux | Windows | .NET |
|---|---|---|---|
| How much address range is set aside? | VmSize (VIRT/VSZ) | Virtual size | VirtualMemorySize64 |
| How much of it is in RAM now? | VmRSS (RSS) | Working set | WorkingSet64 |
| How much is private to the process? | VmData | Private bytes (commit) | PrivateMemorySize64 |
| The limit the system can promise | CommitLimit in mode 2 | Commit limit | none |
Windows makes this distinction explicit at the API level. According to Microsoft's page state documentation, a page can be free, reserved or committed. A reserved range has no storage behind it; for a committed page a share is charged against the total of RAM and the page file, but the physical page is still loaded only on the first read or write. The sum of all commits in the system cannot exceed the commit limit, the total of RAM and page files. The .NET GC's reserve is made with MEM_RESERVE of VirtualAlloc on Windows and with an mmap without permissions, PROT_NONE, on Linux. On macOS, the Memory tab of Activity Monitor and the vm_stat command give system-wide page counts.
Overcommit and the OOM Killer
Linux can promise processes more memory in total than it has; this is called overcommit. I measured the third question:
dotnet Bookstore.OsLab.dll overcommit 4
dotnet Bookstore.OsLab.dll overcommit 16
dotnet Bookstore.OsLab.dll overcommit 64
cat /proc/sys/vm/overcommit_memory
4 GB reserved, nothing touched: virtual= 21445 MB resident= 29 MB minflt= 2262 majflt=3
16 GB reserved, nothing touched: virtual= 33733 MB resident= 29 MB minflt= 2255 majflt=3
64 GB reserved, nothing touched: virtual= 82885 MB resident= 29 MB minflt= 2274 majflt=3
1The 64 GB malloc succeeded and resident memory did not change at all. What decides this is the vm.overcommit_memory setting. According to the kernel's overcommit documentation, 0, the default on most distributions, uses a heuristic that refuses obviously excessive requests, 1 accepts every request, and 2 limits the total commit to swap plus a percentage of RAM and refuses allocations up front once the limit is exceeded. In the environment I measured, Docker's Linux VM, the value is 1, which is why even 64 GB went through. On a server with the default 0 the same request may be refused; but there too, what determines actual memory consumption is touching the pages.
When promised memory is really needed and there is not enough, the only thing the kernel can do is kill a process: the OOM killer. I put a 256 MB limit on a container and filled 1 GB page by page:
docker run --name oslab-oom --memory=256m --memory-swap=256m -v ${PWD}/out:/app -w /app mcr.microsoft.com/dotnet/sdk:10.0 dotnet Bookstore.OsLab.dll oom 1024
echo "exit code: $?"
docker inspect oslab-oom --format "OOMKilled={{.State.OOMKilled}} ExitCode={{.State.ExitCode}}"
allocated 1024 MB: virtual= 3527 MB resident= 29 MB minflt= 3469 majflt=4
touched 64 MB: virtual= 3600 MB resident= 97 MB minflt= 20248 majflt=4
touched 128 MB: virtual= 3600 MB resident= 161 MB minflt= 36640 majflt=4
touched 192 MB: virtual= 3600 MB resident= 225 MB minflt= 53031 majflt=4
exit code: 137
OOMKilled=true ExitCode=137The 1 GB allocation went through without trouble in the 256 MB container. The process saw no exception and wrote no log; as resident memory approached the limit, the kernel killed it with SIGKILL and the exit code was 137. In the second post we said 137 only means "killed by SIGKILL"; OOMKilled=true tells you who did it. On Windows, by contrast, when the system-wide commit limit is reached the VirtualAlloc call fails up front, and in .NET this shows up as an OutOfMemoryException; the error comes at allocation time, not at touch time. How .NET detects the container limit and how the GC puts a heap limit in place because of it is in the next post.
Production Notes
Set memory alarms on resident and private memory, not on VIRT; in a container, on the cgroup's own counter. VIRT tells you how many addresses the application has set aside, and in .NET it changes with the machine's RAM; two identical applications can show very different VIRT on two different servers.
A .NET server that falls into swap behaves especially badly. The GC walks the heap to find live objects; the heap pages that were written to swap are read back from disk with major faults during that walk, and a GC pause of milliseconds can stretch to seconds. The application looks "slow" while the CPU is idle. That is why turning swap off for latency-sensitive services, or sizing memory to the real need, is a common choice; when diagnosing, check whether maj_flt is growing.
Common Pitfalls
The "VIRT 200 GB, there is a memory leak" panic. As shown above, the .NET GC reserves a large range at startup; what reveals a leak is not VIRT but resident or private memory that never comes down.
Assuming memory exists because the allocation succeeded. On Linux with overcommit, a successful allocation only shows that an address range was set aside. When memory runs out, the error comes not as an exception but as a SIGKILL while touching pages; the process's last log line carries no clue.
Measuring at the wrong moment. Looking at resident memory right after allocating a large buffer and saying "it uses no memory", or looking after touching the pages but before FreeHGlobal and saying "there is a leak", are two faces of the same mistake. Watch memory as a time series.
A Small Experiment
★☆☆ Run the paging command with 64, 256 and 1024 MB. For each, compare the growth in minor faults with size / Environment.SystemPageSize.
★★☆ Write a copy of DemandPaging that uses new byte[megabytes << 20] instead of Marshal.AllocHGlobal. Explain why resident memory after the allocation behaves differently from the native version, in terms of the GC zeroing a new array.
★★★ Run mem-info in a --memory=256m container without setting DOTNET_GCRegionRange, and compare VirtualMemorySize64 with the unlimited container. Explain the difference by looking at how the region range is computed from the heap hard limit in the GC source in dotnet/runtime.
In this post we saw a process's memory page by page: reserved, touched and given back. In the next post we read the same picture from inside the process: how the heap is obtained from the OS with mmap, copy-on-write and the sharing of shared libraries, and how .NET detects the container memory limit and tries to stay clear of OOMKilled.