

The OpenTelemetry Collector: Receivers, Processors, Exporters, Tail Sampling and PII Filtering
The OpenTelemetry Collector is a separate process that decouples the application from backends and receives and processes telemetry in pipelines of receivers, processors and exporters. We set it up for Bookstore in a one-container LGTM stack, filter unneeded logs, hash the e-mail address, keep failed and slow traces with tail sampling and measure how head sampling throws away 90 percent of the orders people complain about.
Version note: The examples in this post were run on Docker Desktop with .NET 10, OpenTelemetry .NET 1.21 and the grafana/otel-lgtm 0.41.0 image (OpenTelemetry Collector contrib 0.165.0, Prometheus 3.16.0, Tempo 3.1.1, Loki 3.7.9, Grafana 13.3.0).
Guess First
A traffic run of 200 orders in Bookstore, the online bookstore used as the shared example across this site's series, produces about 1,000 traces: creating the cart, adding books and the order itself, for every order. You want to keep 10 percent of them. There are two ways: tell the SDK "record one trace in 10", or send everything to a Collector and say there "keep the errors, the slow ones and 10 percent of the rest". Both keep about the same number of traces. But how many of checkout's orders over 5 seconds, the ones people complain about, do you still have in each case? We tried both with the same traffic.
Why a Collector?
So far the application sent its telemetry straight to a backend (the Aspire Dashboard). The reasons for putting an OpenTelemetry Collector in between in production are concrete. The application only knows "send the telemetry to this address over OTLP"; which backend it goes to, how many backends, which data is dropped, all of that lives in the Collector's config. Changing the backend doesn't require redeploying the application. When a backend slows down or goes away, retries and queuing happen in the Collector; the application's memory doesn't fill up with a telemetry queue. Filtering, sampling and removing personal data happen in one place, independent of language: a .NET service and a Go service go through the same rules. And the same data can be sent to several places (fan-out): metrics to both Prometheus and an APM service, for example.
Two distributions of the Collector are common. The core distribution contains only the basic components (the OTLP receiver and exporter, batch, memory_limiter, debug). The contrib distribution has hundreds of components written by the community: tail sampling, filter, transform, the prometheus receiver, the loadbalancing exporter and vendor exporters. The config in this post needs contrib. In production, instead of shipping all of contrib, building your own distribution with only the components you use via the Collector Builder (ocb) is another option; it shrinks the attack surface and the image size.
A Local Stack: LGTM in One Container
In a real setup the Collector, Prometheus, Grafana, Tempo and Loki are separate processes and often separate containers. Instead of starting each one locally we used the grafana/otel-lgtm image that Grafana publishes for development and demos. Its name comes from the initials of Loki, Grafana, Tempo and Mimir; the image has Prometheus instead of Mimir plus a contrib Collector, all in one container. The image has its own Collector config; we mounted ours in its place:
# Local observability stack for Bookstore: one container with an OpenTelemetry Collector (contrib),
# Prometheus, Tempo, Loki and Grafana. Development only.
#   docker compose -f deploy/observability/compose.yaml up -d
#   API: OTEL_EXPORTER_OTLP_ENDPOINT=http://localhost:4317   Grafana: http://localhost:3000
services:
  lgtm:
    image: grafana/otel-lgtm:0.41.0
    container_name: bookstore-lgtm
    ports:
      - "3000:3000"   # Grafana
      - "4317:4317"   # OTLP/gRPC
      - "4318:4318"   # OTLP/HTTP
      - "9090:9090"   # Prometheus
      - "3200:3200"   # Tempo API
      - "3100:3100"   # Loki API
    environment:
      # Collector logs (and the debug exporter's output) go to docker logs
      ENABLE_LOGS_OTELCOL: "true"
    volumes:
      - ./otelcol-config.yaml:/otel-lgtm/otelcol-config.yaml:ro
On startup the container prints the versions of its components:
Starting grafana/otel-lgtm v0.41.0
Running Grafana v13.3.0 logging=false
Running Loki v3.7.9 logging=false
Running OpenTelemetry Collector v0.165.0 logging=true
Running Prometheus v3.16.0 logging=false
Running Tempo v3.1.1 logging=false
Nothing changes on the application side: OTEL_EXPORTER_OTLP_ENDPOINT=http://localhost:4317 is now the Collector's port rather than the dashboard's.
The Config: Receivers, Processors, Exporters, Pipelines
A Collector config has four sections. Receivers take data in, processors work on it, exporters send it out; service.pipelines lines them up per signal. Defining a component doesn't run it; it only takes effect when used in a pipeline.
# Bookstore's local Collector. It replaces the Collector config inside grafana/otel-lgtm;
# the exporters point at the Tempo, Prometheus and Loki running in the same container.
receivers:
  otlp:
    protocols:
      grpc:
        endpoint: 0.0.0.0:4317
      http:
        endpoint: 0.0.0.0:4318
  # The Collector's own metrics (port 8888), so we can see what it receives, drops and samples.
  prometheus/collector:
    config:
      scrape_configs:
        - job_name: otel-collector
          scrape_interval: 10s
          static_configs:
            - targets: ["127.0.0.1:8888"]

processors:
  # First in every pipeline: refuse data before the process runs out of memory.
  memory_limiter:
    check_interval: 1s
    limit_percentage: 80
    spike_limit_percentage: 20

  # Every signal gets the environment, even if the application forgot it.
  resource:
    attributes:
      - key: deployment.environment.name
        value: local
        action: insert

  # HttpClient writes four Information logs per call; the spans already tell the same story.
  filter/http-client-logs:
    error_mode: ignore
    log_conditions:
      - IsMatch(instrumentation_scope.name, "^System\\.Net\\.Http\\.HttpClient\\.") and log.severity_number < SEVERITY_NUMBER_WARN

  # PII: the e-mail address is hashed (still groupable, not readable); any other address in a body is masked.
  transform/pii:
    error_mode: ignore
    log_statements:
      - set(log.attributes["CustomerEmail"], SHA256(log.attributes["CustomerEmail"])) where log.attributes["CustomerEmail"] != nil
      - replace_pattern(log.body, "[A-Za-z0-9._%+-]+@[A-Za-z0-9.-]+\\.[A-Za-z]{2,}", "<email>")

  # Keep every error, every trace slower than 1 s, and 10% of the rest.
  tail_sampling:
    decision_wait: 10s
    num_traces: 50000
    policies:
      - name: errors
        type: status_code
        status_code:
          status_codes: [ERROR]
      - name: slow
        type: latency
        latency:
          threshold_ms: 1000
      - name: ten-percent
        type: probabilistic
        probabilistic:
          sampling_percentage: 10

  batch:

exporters:
  otlp_http/tempo:
    endpoint: http://127.0.0.1:4418
  otlp_http/prometheus:
    endpoint: http://127.0.0.1:9090/api/v1/otlp
  otlp_http/loki:
    endpoint: http://127.0.0.1:3100/otlp
  debug:
    verbosity: basic

service:
  pipelines:
    traces:
      receivers: [otlp]
      processors: [memory_limiter, resource, tail_sampling, batch]
      exporters: [otlp_http/tempo]
    metrics:
      receivers: [otlp, prometheus/collector]
      processors: [memory_limiter, resource, batch]
      exporters: [otlp_http/prometheus]
    logs:
      receivers: [otlp]
      processors: [memory_limiter, resource, filter/http-client-logs, transform/pii, batch]
      exporters: [otlp_http/loki, debug]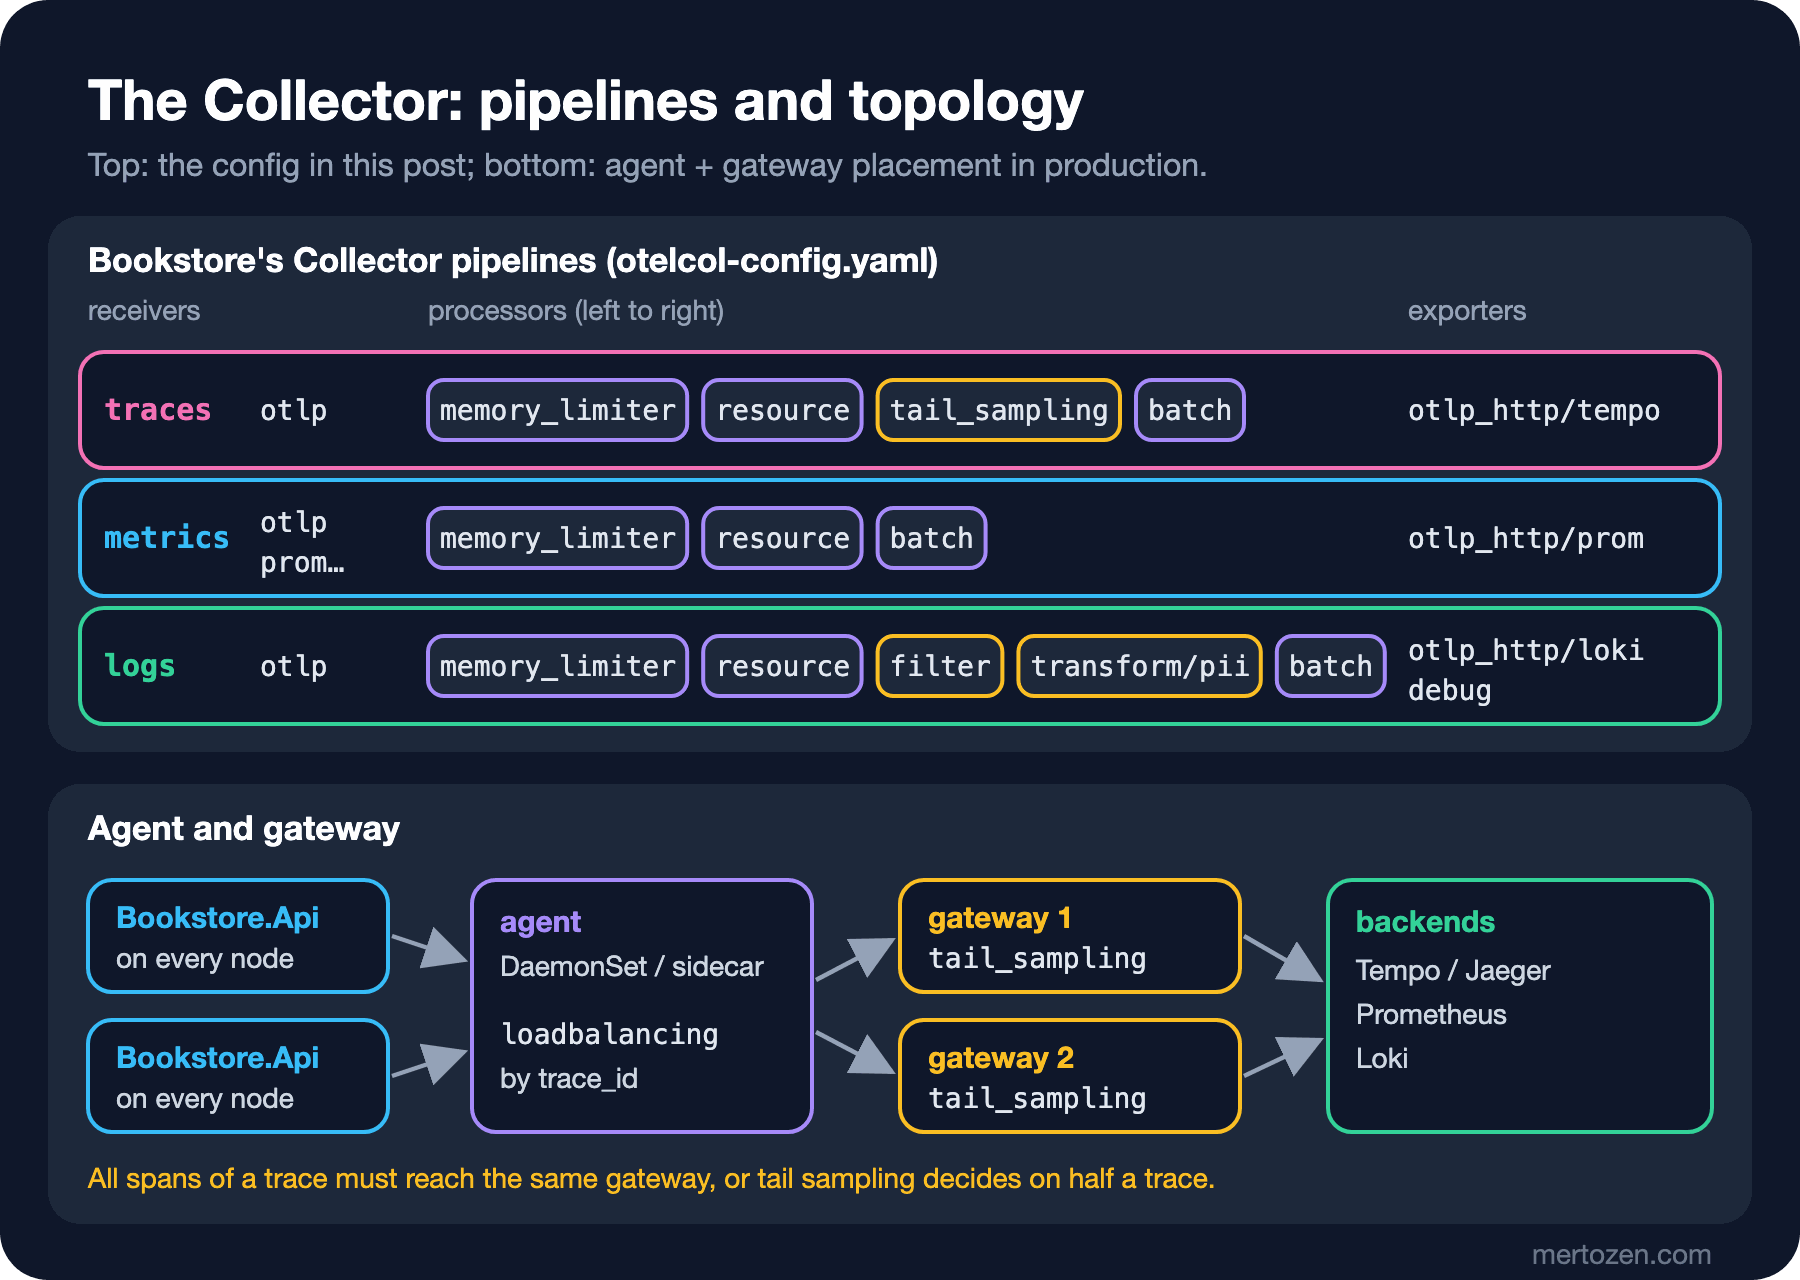
The order of processors matters. memory_limiter comes first: when memory gets close to the limit it returns an error to the receiver and refuses the data, and the SDK's exporter retries. batch comes last, after whatever is to be dropped has been dropped: batching data that will be filtered or sampled is wasted work. In contrib 0.165 the exporters are named otlp_http and otlp_grpc; in older configs you will see otlphttp. The batch processor is still beta and widely used; the Collector's exporter-side sending_queue also got a batch setting, and if you enable both in the same pipeline the Collector warns at startup.
The expressions in the config are written in OTTL, the OpenTelemetry Transformation Language the Collector uses for conditions and transformations on telemetry. In the filter processor a record is dropped when the condition is true; in transform every line is a statement. Paths depend on the context: log.attributes, log.body, log.severity_number for logs; instrumentation_scope.name for the scope; resource.attributes for the resource.
By the Numbers: What Did the Collector Receive and Send?
We ran the 200-order traffic and looked at the Collector's own metrics in Prometheus (the prometheus/collector receiver in the config collects them every 10 seconds):
orders=200 concurrency=4
status: 201=199, 502=1
POST /api/orders ms: avg=932 p50=123 p95=2701 p99=7604 max=9572

otelcol_receiver_accepted_spans_total{receiver="otlp"}                       7559
otelcol_exporter_sent_spans_total{exporter="otlp_http/tempo"}                1876
otelcol_receiver_accepted_log_records_total{receiver="otlp"}                 1665
otelcol_processor_filter_logs_filtered_total                                  863
otelcol_exporter_sent_log_records_total{exporter="otlp_http/loki"}            802
otelcol_processor_tail_sampling_new_trace_id_received_total                  1027
otelcol_processor_tail_sampling_global_count_traces_sampled_total{sampled="true"}   153
otelcol_processor_tail_sampling_count_traces_sampled_total{policy="errors",sampled="true"}       52
otelcol_processor_tail_sampling_count_traces_sampled_total{policy="slow",sampled="true"}         52
otelcol_processor_tail_sampling_count_traces_sampled_total{policy="ten-percent",sampled="true"} 105
More than half of the logs (863 of 1,665) were caught by the filter; all of them were HttpClient's "Start processing", "Sending", "Received" and "End processing" lines. Spans went from 7,559 to 1,876, about a quarter. 153 of 1,027 traces were kept. The policy counts don't add up, because a trace can match several policies: all 52 slow traces contain an HTTP attempt that timed out, a span with ERROR status. That is why errors and slow picked the same 52 traces. A successful order's trace matching the "errors" policy looks odd at first; but it is exactly what we want: an error rescued by a retry is one of the things you most want to look at.
Head Sampling and Tail Sampling
The second half of the comparison from Guess First. We started the same application with sampling on the SDK side, using just two environment variables:
$env:OTEL_TRACES_SAMPLER = "parentbased_traceidratio"
$env:OTEL_TRACES_SAMPLER_ARG = "0.1"
Head sampling makes the decision at the start of the trace, when the root span is opened: it looks at the trace id, records the ones that fall into the 10 percent and doesn't produce the rest at all. The parentbased prefix makes it follow the parent's decision when there is one, which prevents one service recording a trace that another drops. After the same 200-order traffic, 108 traces reached the Collector instead of 1,027, with 812 spans. The tail sampling policies were applied to these 108 traces too, and the errors counter only went from 52 to 53. In this run 48 orders took longer than 2 seconds, but because of head sampling the trace of only one of them reached the Collector. The answer to Guess First: both ways keep about the same number of traces, but head sampling throws away about 90 percent of the orders people complain about without knowing which ones they are; tail sampling keeps all of them.
Tail sampling has a price too. To decide, it needs to see all the spans of a trace, so it keeps spans in memory for the decision_wait duration (10 seconds here). The Collector's memory grows with traces per second times that duration; num_traces caps how many traces can be held in memory. The more important constraint: all spans of a trace must reach the same Collector instance. As long as Bookstore has a single API, that's fine; but once checkout spans several services with several Collectors in front of them, spans spread across instances and each decides on half a trace. The fix is a two-layer setup: Collectors in the first layer distribute spans to the second layer by trace id with the loadbalancing exporter, and tail sampling runs in the second layer. We did not run this two-layer setup; the bottom of the figure above is based on the recommendation in the tail sampling processor's README.
In practice the two are used together: head sampling in the SDK with a high ratio (or none), tail sampling in the Collector. Head sampling lowers the network and Collector cost, tail sampling decides intelligently what to keep.
PII: Cleaning Personal Data out of Telemetry
The log line of the confirmation e-mail service we added in the previous post is "Order confirmation for order {OrderId} sent to {CustomerEmail}". Harmless-looking during development, this line carries the customer's e-mail address to the log backend; personal data under KVKK, Turkey's personal data protection law. The right fix is in the application: don't log the address, or mask it as described in the redaction post of the .NET Logging series. The Collector is a safety net: it catches a field forgotten in an application in one place, for every service. After transform/pii in the config, the record in Loki:
{"CustomerEmail": "abf525f3b1abf243ae2df2310e315382cd8c0c5cd1a012f23ecafd58d4d02e39", "OrderId": "1373",
 "deployment_environment_name": "development", "scope_name": "Bookstore.Notifications.OrderConfirmationSender",
 "service_name": "bookstore-api", "severity_text": "Information", "span_id": "e6ff133160c4ec83",
 "trace_id": "f212b96ae18830980535a1a2f6c26564", ...}
Order confirmation for order {OrderId} sent to {CustomerEmail}
Three things stand out. The e-mail is now a SHA-256 hash: the same customer's records can still be linked, but the address can't be read. This is not full anonymization; e-mail addresses are guessable values, so the hash of a known address can be computed and matched. Adding a secret salt to the hash or deleting the field entirely (delete_key) is safer. Second, the body doesn't contain the address because it is the template, not the formatted message; had IncludeFormattedMessage been on, the replace_pattern line would have replaced the address in the body with <email>. Third, deployment_environment_name is still development: action: insert in the resource processor only adds a missing attribute and doesn't override an existing one. There is upsert if you want to override; but silently changing what the application says about itself in the Collector causes confusion later.
One more thing to watch: when tail sampling drops a trace, the logs of that trace stay in Loki. The trace_id in the log no longer leads to any trace. This is not a bug but the natural result of sampling the two signals separately; if you see "trace not found" when jumping from a log to a trace, think of sampling first.
Agent or Gateway?
The Collector can run in two roles. An agent is a Collector running next to the application: a DaemonSet on every node in Kubernetes, or a sidecar in every pod. The application hands its telemetry to localhost or the agent on its node; network latency is low and the application gets rid of it quickly. The agent is also the right place to add host and Kubernetes metadata (pod name, namespace) and to collect the node's own metrics. A gateway is a pool of Collectors running centrally as a service, several copies behind a load balancer: credentials for the backends, tail sampling, heavy transformations and distribution to several backends live there. In a small setup a gateway alone is enough; as scale grows the two are used together. The Kubernetes details (DaemonSet, the OpenTelemetry Operator) are in the series' production post.
In Production
Monitor the Collector itself. The otelcol_receiver_accepted_* and otelcol_exporter_sent_* metrics in this post, and otelcol_exporter_send_failed_*, which counts what couldn't be sent, are the health indicators of the telemetry pipeline. If the Collector itself silently drops data, this is where you notice it first.
Put memory_limiter first in every pipeline and size it to match the container's memory limit. The processor's README recommends limit_percentage in container environments where a memory limit can be set, and limit_mib sized for the expected load on bare metal and VMs where memory is not constrained. Setting it as a percentage without giving the container a memory limit ties the limit to the machine's memory.
Expose the Collector's OTLP ports only to the internal network. The config in this post uses no TLS and no authentication; that's enough on a local machine, but anyone can write telemetry into a Collector open to the network, which means fake data and a cost attack.
sending_queue and retry_on_failure are on by default in the exporters, but the queue lives in memory. If the Collector restarts, the queued data is lost; where that loss is unacceptable you need a persistent queue (the file storage extension).
Common Pitfalls
Running tail sampling behind several Collector copies without load balancing. Each copy sees part of a trace, the one that sees the failing part keeps it, the other drops it; half traces pile up in the backend.
Defining a processor and forgetting to add it to the pipeline. The definition alone does nothing and the Collector gives no error; data you think is filtered keeps going to the backend. If the processor's name doesn't show up in the Collector's otelcol_processor_incoming_items_total metric, it isn't running.
Leaving PII to the Collector alone. The Collector catches known fields and patterns; it doesn't catch a national id number written into an unknown field. The real control is in the application, in what you write into logs and spans.
Leaving the debug exporter at verbosity: detailed in production. It writes every record to stdout and the container log becomes more expensive than the Collector itself. We used basic in this post, which only writes counts.
A Small Experiment
★☆☆ Remove filter/http-client-logs from the logs pipeline, run the same traffic and measure the difference in otelcol_exporter_sent_log_records_total. Scale that ratio to a million orders a day.
★★☆ Set the ten-percent policy to sampling_percentage: 1 and add upper_threshold_ms to the slow policy so that it only picks traces over 5 seconds. How do the number of kept traces and the checkout traces in Tempo change?
★★★ Use the SHA256 in transform/pii with a salt (read from an environment variable with the ${env:...} syntax) and verify in Loki that the same e-mail produces different hashes with two different salts.
Telemetry now goes through a pipeline and the metrics are in Prometheus. In the next post we take a closer look at Prometheus: scrape or push, two ways from .NET into Prometheus, rate, histogram_quantile and the error rate in PromQL, recording rules, native histograms and how OpenTelemetry names change when they are translated for Prometheus.