

How Garbage Collection Works: Mark-Sweep-Compact, Generational GC and .NET Server GC
A tracing GC marks the objects reachable from the roots and treats the rest as garbage; .NET splits this work into generations and keeps gen0 GCs cheap with a write barrier and a card table. With dotnet-counters and BenchmarkDotNet we show the Bookstore filter language's interpreter producing 10 GB of allocations and 1,365 gen0 GCs in five seconds while the compiled delegate triggers none, and measure the LOH, Workstation and Server GC, DATAS, and a real leak versus uncollected memory.
Version note: The code in this post was built with .NET 10 (SDK 10.0.404, runtime 10.0.15) and verified with xUnit v3 4.0.3 tests; the measurements use BenchmarkDotNet 0.15.8 and dotnet-counters 10.0.750501. Assembly output was captured on x64 Linux.
Guess First
The filter language we write for Bookstore, the online bookstore used as the shared example across this site's series, has two implementations: the tree-walking interpreter from post 03 and the delegate compiled from an expression tree in post 04. Both return the same books. We run the filter price < 300 and author = "Jane Austen" non-stop for five seconds over a catalog of 100,000 books.
First question: in these five seconds, how many times does the garbage collector run for the interpreter, and how many times for the compiled delegate?
Second question: is there any difference, as far as the GC is concerned, between new byte[84_000] and new byte[85_000] holding a cover image?
Who Gives Memory Back?
In C, the code that takes memory is also responsible for giving it back with free. Forget it and you have a memory leak; give it back twice, or use it after giving it back, and memory gets corrupted. The first widespread way of managing memory automatically is reference counting: count how many references hold each object and give the memory back as soon as the count drops to zero. Swift and CPython take this route. Its weak spot is cycles: if an Author points to its books and every Book points to its author, neither count drops to zero even when no outside reference is left. So either the programmer marks some references as "weak" or the runtime adds a second mechanism that collects cycles separately.
The route chosen by .NET, the JVM, V8 and Go is tracing GC. Instead of keeping counts, the GC runs from time to time and answers the question "which objects can the program still reach?". Everything unreachable is garbage, whether or not it forms a cycle. The price is that the runtime, not the program, decides when the GC runs.
Mark, Sweep, Compact
The starting point of a tracing GC is the roots: local variables on the threads' stacks, static fields, references in CPU registers and GC handles. In the mark phase the GC starts from the roots, follows references and marks every object it reaches; this is exactly the graph traversal from the Algorithms series. In the sweep phase the space taken by unmarked objects counts as free.
If you only sweep, the heap gets full of holes over time: there is enough space in total, but no single free block large enough for a big object. The compact phase slides the live objects next to each other and updates every reference pointing to them to the new addresses. Thanks to this, a new allocation is usually as cheap as bumping a pointer. The price is that the program has to stop while objects are moved. .NET does two things to shorten that pause: it collects a small part of the heap instead of all of it, and it runs the marking part of big collections concurrently with the app.
Generations and the Write Barrier
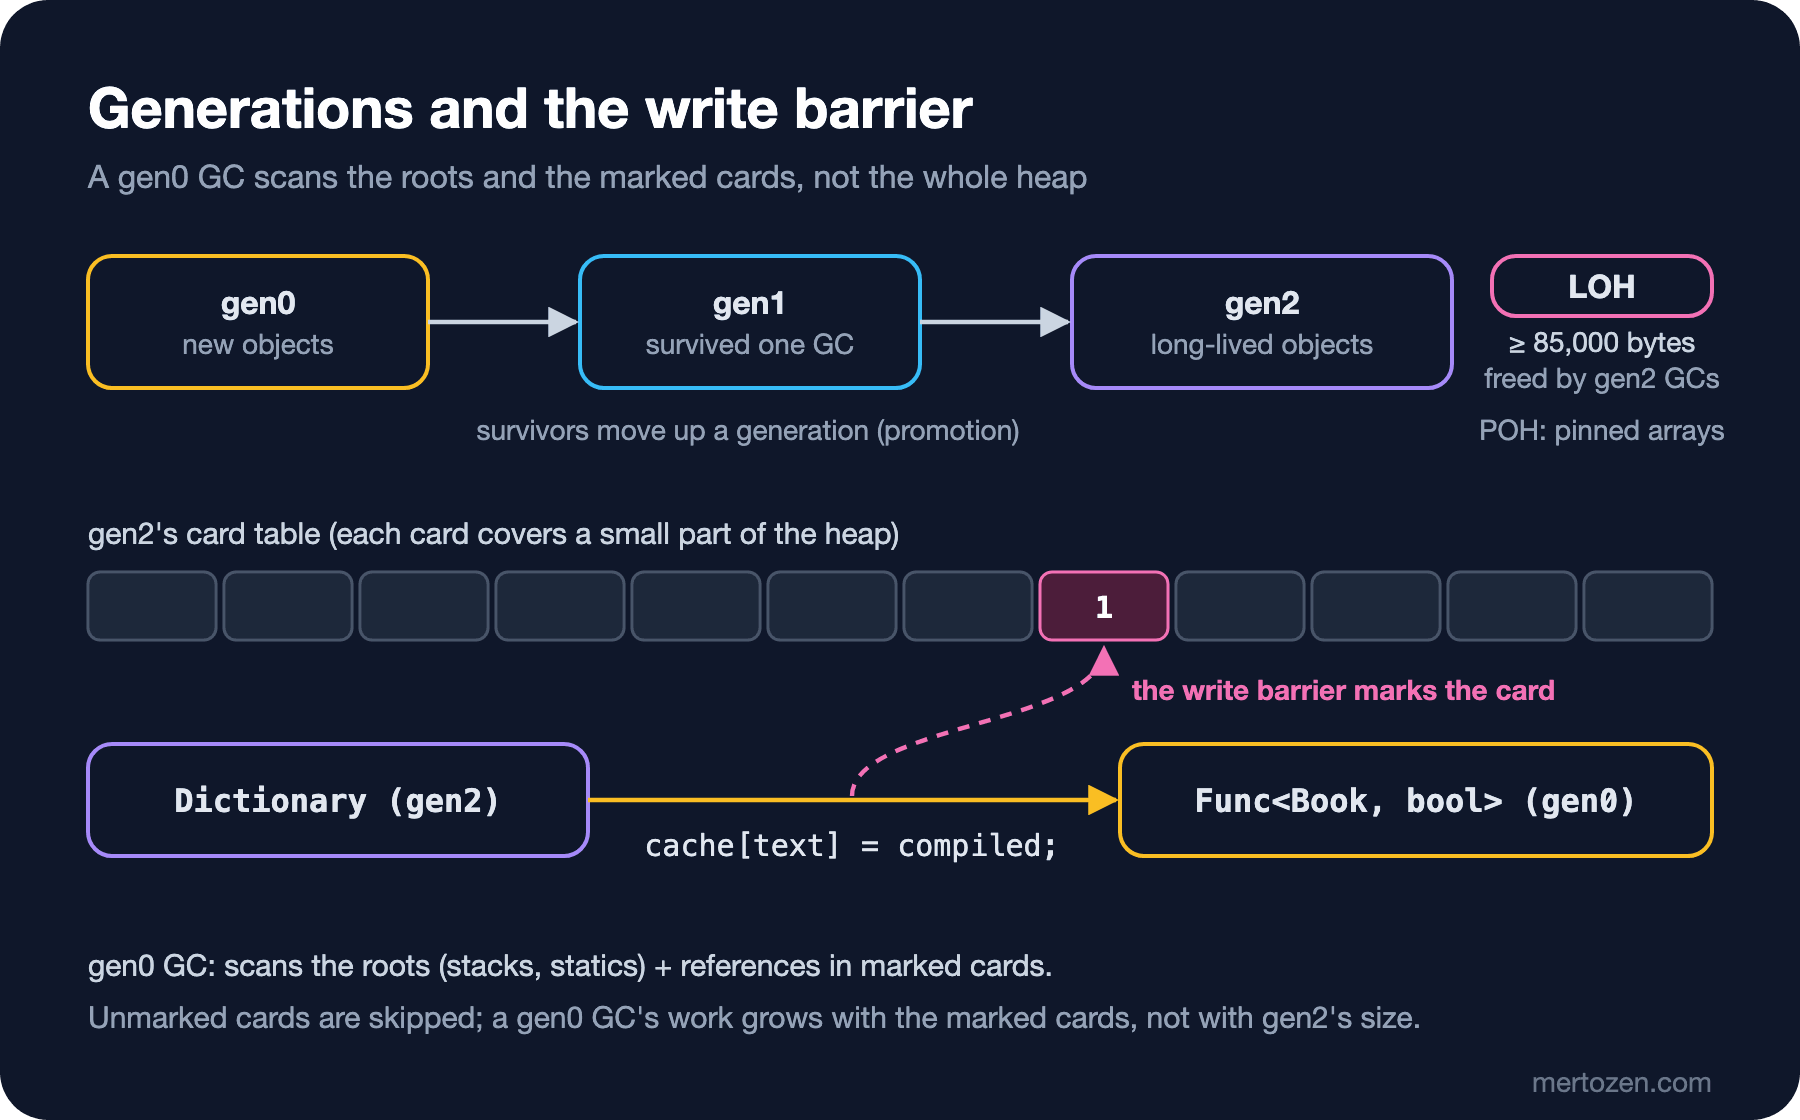
The reason for collecting a small part of the heap is the generational hypothesis: most objects die young. The strings, DTOs and LINQ enumerators produced for an HTTP request become garbage when the request ends; the catalog cache lives for hours. .NET splits the heap into three generations: new objects start in gen0, those that survive a GC move to gen1, and those that survive another move to gen2. In the GcLab sample we call GC.Collect only to show this move:
Book book = new("9780441172719", "Dune", "Frank Herbert", 349.90m, 1965, 12);
Console.WriteLine($"new Book:               gen {GC.GetGeneration(book)}");
// GC.Collect only to show promotion; never call it like this in an app
GC.Collect(0);
Console.WriteLine($"after a gen0 GC:        gen {GC.GetGeneration(book)}");
GC.Collect(1);
Console.WriteLine($"after a gen1 GC:        gen {GC.GetGeneration(book)}");

byte[] thumbnail = new byte[84_000];
byte[] cover = new byte[85_000];
byte[] pinned = GC.AllocateArray<byte>(4_096, pinned: true);
$ dotnet run -c Release --project samples/GcLab -- gens
new Book: gen 0
after a gen0 GC: gen 1
after a gen1 GC: gen 2
byte[84_000] thumbnail: gen 0
byte[85_000] cover: gen 2 (LOH)
pinned byte[4_096]: gen 2 (POH)A gen0 GC is frequent and cheap: it only looks at young objects, and since most of them are dead there is little work. But there is a problem. An old object in gen2 can point to a freshly created gen0 object; for example when a new entry is added to a long-lived cache. If the gen0 GC did not scan gen2, it would think that object is dead and delete it. Scanning all of gen2, on the other hand, would throw away the whole benefit of generations.
The solution is the write barrier. The JIT adds a small helper call next to every instruction that writes to a reference field of an object. The helper marks the area of the written address in a table called the card table. Besides the roots, a gen0 GC only looks at the references in marked cards. We can see this with DOTNET_JitDisasm from post 05:
public sealed class Shelf
{
    public Book? Latest;
    public int Count;

    // a reference store goes through the write barrier, an int store does not
    [MethodImpl(MethodImplOptions.NoInlining)]
    public void Put(Book book)
    {
        Latest = book;
        Count++;
    }
}
$ DOTNET_JitDisasm=Put DOTNET_JitDisasmOnlyOptimized=1 DOTNET_JitDisasmDiffable=1 dotnet samples/GcLab/bin/Release/net10.0/GcLab.dll barrier
...
; Assembly listing for method Bookstore.GcLab.Shelf:Put(Bookstore.Catalog.Book):this (Tier1)
G_M000_IG01:
push rbx
mov rbx, rdi
G_M000_IG02:
lea rdi, bword ptr [rbx+0x08]
call CORINFO_HELP_ASSIGN_REF
inc dword ptr [rbx+0x10]
G_M000_IG03:
pop rbx
ret
; Total bytes of code 18Latest = book is not a single mov but a call to CORINFO_HELP_ASSIGN_REF; Count++ is an ordinary inc. Every reference store pays this small price. .NET 10 brought to Arm64 the ability, which x64 already had, to switch between write barrier implementations depending on the GC configuration; according to Microsoft's what's new page, the new default Arm64 barrier writes slightly slower but cuts GC pauses by 8 to over 20 percent.
LOH, POH and Regions
The answer to the second guess is in the output above: objects of 85,000 bytes and more show up directly in gen2. They go to the LOH; the threshold is LOHThreshold=85000, as returned by GC.GetConfigurationVariables(). Because moving big objects during compaction is expensive, the LOH is not compacted by default and is collected only in gen2 GCs. Pinned allocations have lived in a separate place, the POH, since .NET 5, so that buffers whose address is handed to native code and must not move do not fragment the SOH, the normal heap with gen0, gen1 and gen2. Since .NET 7 the heap consists of smaller pieces called regions instead of segments; the GC can reuse freed regions across generations.
Let's see the practical consequence of the LOH by producing the same amount of garbage in two different sizes. Sink.Last writes the array to a static field; otherwise the JIT can delete these allocations, which nobody reads, entirely:
// 200 MB of short-lived small objects: gen0 collects them cheaply
for (int i = 0; i < 200_000; i++)
    Sink.Last = new byte[1_000];
Report("200 MB in 1 KB arrays");

// the same 200 MB as cover images: every array goes to the LOH, which only a gen2 GC collects
for (int i = 0; i < 200; i++)
    Sink.Last = new byte[1_000_000];
Report("200 MB in 1 MB arrays");
$ dotnet run -c Release --project samples/GcLab -- memory
start heap 0 MB | working set 42 MB | GCs gen0 0 gen2 0
200 MB in 1 KB arrays heap 4 MB | working set 56 MB | GCs gen0 24 gen2 0
200 MB in 1 MB arrays heap 3 MB | working set 69 MB | GCs gen0 39 gen2 15
5000 cached filters, full GC heap 14 MB | working set 76 MB | GCs gen0 44 gen2 17
10000 cached filters, full GC heap 28 MB | working set 88 MB | GCs gen0 49 gen2 19In small arrays, 200 MB was cleaned up with 24 gen0 GCs and no gen2 GC at all. The same 200 MB in 1 MB arrays triggered 15 gen2 GCs; a gen2 GC marks the whole heap and is the most expensive kind of GC. That is why reusing buffers with ArrayPool<byte>.Shared makes a difference in code that often allocates and drops big buffers (file uploads, report generation, large JSON). We will come back to the last two lines of the output in the pitfalls section.
Workstation, Server, Background GC and DATAS
The .NET GC has two main modes. Workstation GC uses a single heap and is the default for console apps. Server GC opens one heap and one GC thread per CPU core and runs fewer but parallel GCs with a bigger gen0 budget; that is the default for ASP.NET Core apps. Both have background GC on: the marking part of a gen2 collection runs in the background while app threads keep running. Since .NET 9, DATAS has also been on by default for Server GC. According to the DATAS page on Microsoft Learn, it starts with a single heap, adds heaps as load grows and releases them as it shrinks, and tries to keep the heap size close to the size of the long-lived data.
The modes command runs the interpreter on the given number of threads for five seconds and prints the GC counts, the total pause time and the peak working set. We pick the three settings with environment variables:
$ dotnet run -c Release --project samples/GcLab -- modes 1
$ DOTNET_gcServer=1 dotnet run -c Release --project samples/GcLab -- modes 1
$ DOTNET_gcServer=1 DOTNET_GCDynamicAdaptationMode=0 dotnet run -c Release --project samples/GcLab -- modes 1
# the same three commands with 8 threads
threads=1 server=False datas=1 |   2646 passes/s | peak working set   54 MB | allocated  11610 MB | gen0 1455 gen1   1 gen2  0 | pause   66.4 ms
threads=1 server=True datas=1 |   2883 passes/s | peak working set  149 MB | allocated  12649 MB | gen0  128 gen1   1 gen2  0 | pause   46.6 ms
threads=1 server=True datas=0 |   2826 passes/s | peak working set  149 MB | allocated  12398 MB | gen0  126 gen1   1 gen2  0 | pause   49.0 ms
threads=8 server=False datas=1 |  11730 passes/s | peak working set   55 MB | allocated  51466 MB | gen0 6458 gen1   1 gen2  0 | pause  556.7 ms
threads=8 server=True datas=1 |  13880 passes/s | peak working set  150 MB | allocated  60897 MB | gen0  626 gen1   1 gen2  0 | pause  219.5 ms
threads=8 server=True datas=0 |  12658 passes/s | peak working set  149 MB | allocated  55539 MB | gen0  571 gen1   1 gen2  0 | pause  273.4 ms
The difference between Workstation and Server is clear: Server GC runs ten times fewer GCs, the total pause is shorter and throughput is higher with eight threads; the price is about three times the working set. Between Server GC with DATAS on and off, this test showed no difference in memory; the differences in throughput and pause are small enough to swap places between repeats. The test's long-lived data is tiny and the load is constant for five seconds; the page on Learn says DATAS makes the biggest difference with fluctuating load and on machines with many cores, and gives its own measurements on a 48-core machine. Before touching these settings in your own service, measure that service's real load.
Reducing Allocations: Two Versions of the Filter Language
Back to the first guess. The filter command runs the filter again and again over the 100,000-book catalog for five seconds:
$ dotnet run -c Release --project samples/GcLab -- filter interpreter 5
$ dotnet run -c Release --project samples/GcLab -- filter compiled 5
interpreter  248.2 passes/s | allocated  10888 MB | gen0 1365 gen1   1 gen2  0 | pause  127.4 ms
compiled    2060.1 passes/s | allocated      0 MB | gen0    0 gen1   0 gen2  0 | pause    0.0 ms
The interpreter allocated more than 10 GB in five seconds and triggered 1,365 gen0 GCs; the compiled delegate allocated nothing and the GC never ran. The difference comes from the design of the interpreter in post 03: Evaluate returns every value as object, so every book's Price and every comparison's bool result becomes a boxing object on the heap. The compiled delegate knows the types and carries the decimal and the bool in registers and on the stack. You can see the same difference from outside a running process with dotnet-counters; the tool reads the metrics of .NET 10's System.Runtime meter:
$ dotnet-counters collect --counters 'System.Runtime[dotnet.gc.collections,dotnet.gc.heap.total_allocated,dotnet.gc.pause.time]' --format csv -o gc-interpreter.csv --duration 00:00:00:05 -- dotnet samples/GcLab/bin/Release/net10.0/GcLab.dll filter interpreter 7
$ grep -E 'total_allocated|gen0|pause' gc-interpreter.csv | head -3
11/15/2026 06:39:33,System.Runtime,dotnet.gc.heap.total_allocated (By / 1 sec),Rate,2572135760
11/15/2026 06:39:33,System.Runtime,dotnet.gc.pause.time (s / 1 sec),Rate,0.017646999999999996
11/15/2026 06:39:33,System.Runtime,dotnet.gc.collections ({collection} / 1 sec)[gc.heap.generation=gen0],Rate,308
$ grep -E 'total_allocated|gen0|pause' gc-compiled.csv | head -3
11/15/2026 06:39:39,System.Runtime,dotnet.gc.heap.total_allocated (By / 1 sec),Rate,49176
11/15/2026 06:39:39,System.Runtime,dotnet.gc.pause.time (s / 1 sec),Rate,0
11/15/2026 06:39:39,System.Runtime,dotnet.gc.collections ({collection} / 1 sec)[gc.heap.generation=gen0],Rate,0
The interpreter allocates 2.5 GB per second and runs more than 300 gen0 GCs; the GC spends about 18 milliseconds of every second pausing. In the compiled version a few tens of KB per second remain, and those are produced by the measuring session itself. How to use dotnet-counters and the other metrics is covered in the Profiling and Diagnostics in .NET series post "dotnet-counters and Built-in Metrics". The same comparison with BenchmarkDotNet's MemoryDiagnoser over 1,000 books:
$ dotnet run -c Release --project benchmarks/Bookstore.Filter.Benchmarks -- --filter '*EvaluationBenchmarks*'
...
| Method                 | Mean      | Error     | StdDev    | Ratio | RatioSD | Gen0    | Allocated | Alloc Ratio |
|----------------------- |----------:|----------:|----------:|------:|--------:|--------:|----------:|------------:|
| TreeWalkingInterpreter | 36.330 us | 0.7259 us | 1.0410 us |  1.00 |    0.04 | 11.4746 |   96120 B |        1.00 |
| CompiledDelegate       |  4.373 us | 0.0756 us | 0.1085 us |  0.12 |    0.00 |       - |         - |        0.00 |
The Gen0 column is the number of gen0 GCs per 1,000 calls. The compiled delegate is eight times faster, but what the table really says is this: part of the speed comes from allocations, and code that does not allocate has zero GC cost. The most effective way to speed up the GC is to give it less work.
Other Runtimes: V8, Go and Rust
The same ideas show up in other runtimes with different trade-offs. V8's GC, Orinoco, is generational too: a parallel scavenger collects the young generation, which is split into two halves with survivors copied from one half to the other, and the old generation is collected by mark-compact with concurrent marking and parallel compaction. Orinoco has write barriers as well. Memory leaks and WeakRef on the JavaScript side are covered in the JavaScript Advanced series post "JavaScript Memory Management: Garbage Collection, Memory Leaks and WeakRef".
According to Go's own guide, its GC is mark-sweep and non-moving: it does not move objects, does most of its work concurrently with the app and gets by with short stop-the-world moments. Because it does not move objects it misses the benefits of compaction, but handing pointers to native code becomes easy. As settings there are GOGC, which sets the heap target, and GOMEMLIMIT, which sets a soft memory limit. Rust uses no GC at all: every value has a single owner determined at compile time, and memory is given back when the owner goes out of scope. It provides memory safety not at run time but in the compiler's borrow checker; the price is the language's learning curve.
Production Notes
In containers the GC sees the memory limit given to the process and by default reserves part of that limit for the heap; the exact share is set by GCHeapHardLimit and related settings. Because Server GC opens a heap per core, pods with small memory limits on a node with many cores can hit OutOfMemory earlier than expected; according to Learn, memory-constrained environments like this are exactly where DATAS helps most.
Avoid finalizers. An object with a finalizer is not deleted as soon as it is found dead; it is put on the finalizer thread's queue and lives through at least one more GC, together with the whole object graph it holds. The right way to release an unmanaged resource is IDisposable and using; the usage side is covered in the C# OOP series post "Object Lifetime in C#: the Garbage Collector, IDisposable and using".
To watch the GC, look first at the allocation rate and the number of gen2 GCs. A high allocation rate brings gen0 GCs, frequent gen2 GCs bring long pauses. Finding where allocations come from and comparing heap snapshots is the topic of the Profiling and Diagnostics in .NET series post "Allocation and GC Analysis".
Common Pitfalls
Calling GC.Collect(). It moves every live object up a generation, putting short-lived objects into expensive gen2, and it disturbs the GC's own budget calculations. In the examples above we used it only for observation. Production code almost never needs it.
Mistaking uncollected memory for a leak. As long as the GC does not run, garbage stays on the heap, and the working set shrinks only after a GC; Server GC is even slower to give memory back to the operating system. That is why the memory of the API in post 06, which climbed to 260 MB under load, was not a leak. The way to tell a real leak is a heap that keeps growing even after a full GC. The last two lines of the memory output above are an example: an unbounded Dictionary holding a compiled delegate for every distinct filter text is 14 MB at 5,000 filters and 28 MB at 10,000 filters after a full GC. That is the answer to why the cache in post 06's exercise has to be "size-limited".
Filling the LOH with short-lived buffers. Every temporary array over 85,000 bytes is a step towards a gen2 GC. As we measured, the same amount of data stays in gen0 in small pieces and triggers gen2 GCs in big pieces. Because the LOH is not compacted, big buffers of different sizes also cause fragmentation over time.
Allocations disappearing in micro benchmarks. .NET 10's JIT can delete an allocation that is never read, or move it to the stack; in my first attempt a _ = new byte[1_000] loop stopped allocating any memory once it moved to Tier1. When measuring allocations, write the result somewhere, or return it from the benchmark method in BenchmarkDotNet.
A Small Experiment
★☆☆ Add one more line to the gens command after GC.Collect(2). Does the generation of an object in gen2 change when it survives another GC?
★★☆ In the 1 MB loop of the memory command, use ArrayPool<byte>.Shared.Rent and Return instead of allocating a new array every time. What happened to the number of gen2 GCs?
★★★ Reduce the boxing in the interpreter: make Evaluate return a small struct (for example a Value with decimal, string and bool fields) instead of object. How did the Allocated and Gen0 columns in EvaluationBenchmarks change? Do the tests that check the interpreter and the compiled delegate return the same books still pass?
With that we have finished the runtime side: we saw when machine code is produced and how memory is taken back. In the last post of the series we step back and look at how languages evolve: paradigms, type systems, and, as an example of a language feature turning from a compiler trick into a runtime feature, async/await and .NET 11's Runtime Async.