

Log Backends: OpenTelemetry Logs, Loki and ELK — Labels, LogQL and Jumping from Logs to Traces
The way to keep logs cheap in Loki is to keep labels few: some resource attributes of an OpenTelemetry log become labels, the rest and the trace_id become structured metadata. With Bookstore we look at templated log bodies, service.instance.id opening a new stream on every restart, and LogQL queries for errors, levels, durations and jumping from logs to traces, then compare ELK, OpenSearch and Seq.
Version note: The examples in this post were run with .NET 10, OpenTelemetry .NET 1.21 and the grafana/otel-lgtm 0.41.0 image (Loki 3.7.9, Tempo 3.1.1, Grafana 13.3.0, OpenTelemetry Collector contrib 0.165.0). ELK and Seq were not run for this post.
Guess First
In Bookstore, the online bookstore used as the shared example across this site's series, we raised the payment provider's slow node to 5 seconds and sent 400 orders; 8 orders ended with a 502 because the payment couldn't be taken. We opened an error line in Loki, and this is what we saw: Payment for order {OrderId} failed. The order number isn't in the line; there's a placeholder in curly braces instead. The code that wrote the log is logger.LogError(ex, "Payment for order {OrderId} failed", order.Id). Is the number lost, or is it somewhere else? And why would a search like |= "Payment for order 3826" find nothing?
Two Ways to Get Logs to a Backend
The Logging in .NET series covered how to write logs: ILogger, levels, message templates, Serilog and sinks. This post is about what happens after the log is written: where the lines go, how they're stored and how they're searched. There are two common ways to a backend. The first is the one we've used since the start of the series: the OpenTelemetry SDK collects ILogger records (WithLogging()) and sends them over OTLP to the Collector through the same exporter as metrics and traces. The second is a sink, as in the Logging series' Serilog post: Serilog writes the line straight to Seq, to Elasticsearch, or with Serilog's OpenTelemetry sink to an OTLP endpoint.
The first way has two practical benefits. The log record automatically carries the trace_id and span_id of the span active at that moment; no extra enricher is needed. And because logs go through the Collector, the filters and the PII masking we set up in the Collector post apply to logs too. If you need Serilog's rich formatting and enrichment, the second way is right as well; but don't turn on both at once (see Pitfalls).
The Log Line: Template or Message?
The answer to Guess First is a default in OpenTelemetry .NET. OpenTelemetryLoggerOptions.IncludeFormattedMessage is false by default; then the OTLP exporter writes the template itself into the log record's body, not the formatted message. The values aren't lost: each goes as a separate attribute. When we opened the line in Loki, OrderId: 3826 was there as its own field; it just wasn't in the line text. That's why a |= filter on the line text couldn't find it. A body with the template has an upside too: all lines from the same template have the same text, which makes grouping easy. But for the human reading the log, seeing the number in the line matters more, so we turned the option on:
// The log body is the rendered message ("Payment for order 3826 failed"), not only the template;
// the template's values still travel as attributes (OrderId=3826).
.WithLogging(configureBuilder: null, configureOptions: options => options.IncludeFormattedMessage = true)
After restarting the application and sending the same traffic, the error record of a failed order looks like this in Loki (we show part of the structured metadata):
{service_name="bookstore-api"} | OrderId="4686" | detected_level="error"

line: Payment for order 4686 failed
OrderId: 4686
_OriginalFormat_: Payment for order {OrderId} failed
detected_level: error
exception_message: The operation didn't complete within the allowed timeout of '00:00:10'.
exception_type: TimeoutRejectedException
scope_name: Bookstore.Ordering.OrderService
severity_text: Error
span_id: 0a67b2f619700d2d
trace_id: 5fd74d9e6aab18e18112a647d261eb29
The template isn't lost; it arrives as the {OriginalFormat} attribute (Loki turns the curly braces in its name into underscores). We also saw a side effect of the option: the order confirmation log contains sent to {CustomerEmail}, and the body now carries the e-mail address itself. Because the replace_pattern rule from the Collector post masks addresses in bodies, the line in Loki became Order confirmation for order 4695 sent to <email>, while the value in the attribute is hashed in the Collector. Without that rule, this option would have moved PII into the log line.
Loki's Data Model: Labels, Structured Metadata and the Line
Loki stores logs as streams. A stream is one combination of label values; Loki indexes only the labels and writes the lines themselves as compressed chunks to object storage. The model is cheap, as long as the number of labels and the variety of their values (cardinality) stay low. Loki 3 added structured metadata next to it: key-value pairs attached to each line, not indexed, but filterable in queries. The parts of a log record that arrives over OTLP are distributed like this:
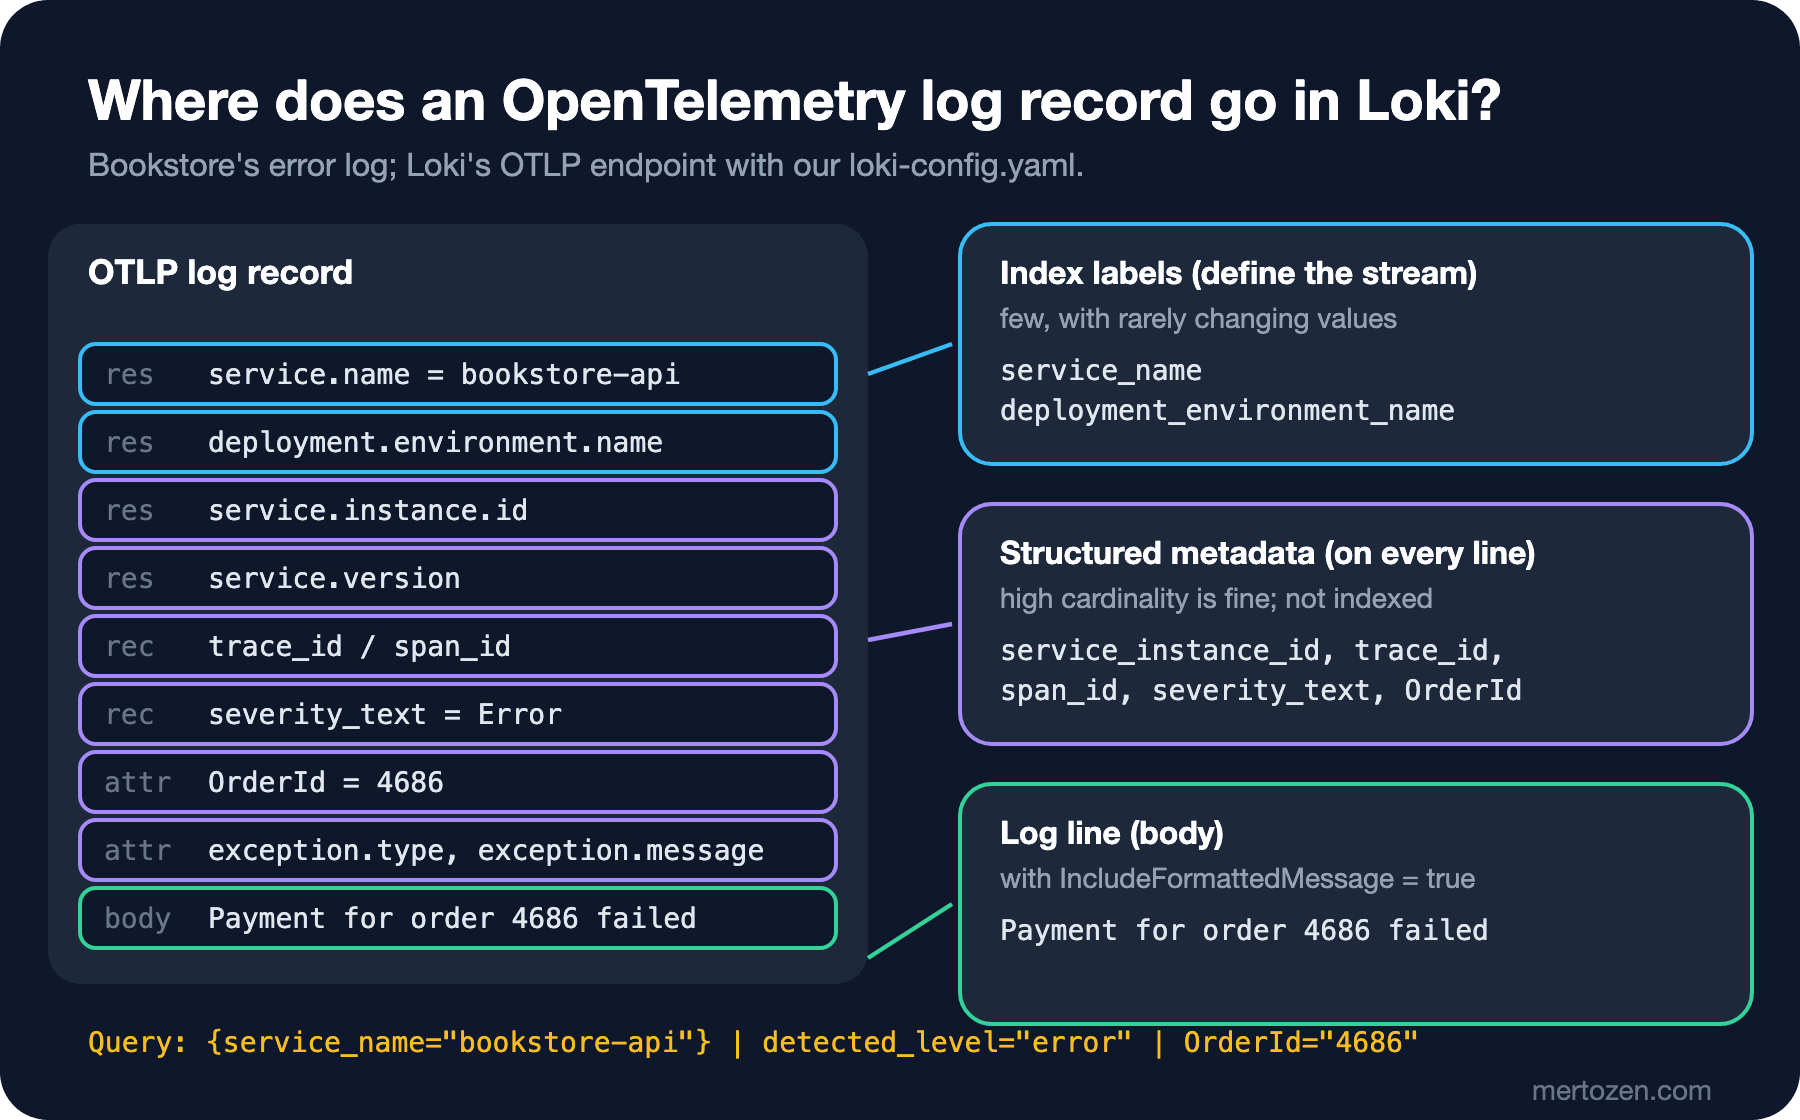
Loki has a default list, and the resource attributes on it become labels (such as service.name, deployment.environment.name, the k8s and cloud attributes, and service.instance.id); the remaining resource attributes, the log attributes, trace_id, span_id and severity go into structured metadata. The body becomes the log line. Our setup hit a problem: we had restarted the API seven times in the last two hours, and Loki had seven separate streams for service_name="bookstore-api". The reason is service.instance.id: the .NET SDK generates it as a new GUID at every process start, and as a label every start opens a new stream. On Kubernetes every pod, every deploy and every autoscaling step does the same. Loki's docs also say that service.instance.id and k8s.pod.name are no longer recommended as default labels; they're kept on the list only so existing setups don't break.
In our first attempt we wrote action: structured_metadata for service.instance.id under limits_config.otlp_config, and nothing changed. Looking at the effective config from Loki's /config endpoint showed why: the default list's index_label rule comes before ours, and the first matching rule wins. The right place is the distributor's default list:
# Bookstore: everything above is the image's own config; only this block is ours.
distributor:
  otlp_config:
    # Loki's default list without service.instance.id and k8s.pod.name: both get a new value at every process
    # start or pod, so as labels they open a new stream each time. Everything not listed here is stored as
    # structured metadata and stays queryable.
    default_resource_attributes_as_index_labels:
      - service.name
      - service.namespace
      - deployment.environment
      - deployment.environment.name
      - cloud.region
      - cloud.availability_zone
      - k8s.cluster.name
      - k8s.namespace.name
      - k8s.container.name
      - container.name
      - k8s.replicaset.name
      - k8s.deployment.name
      - k8s.statefulset.name
      - k8s.daemonset.name
      - k8s.cronjob.name
      - k8s.job.name
We put this file (a copy of the image's own Loki config with this block appended) into the repo as deploy/observability/loki-config.yaml and mounted it over the image's file in compose. After a restart, the API's logs are in a single stream: {"deployment_environment_name":"development","service_name":"bookstore-api"}. The instance id isn't lost; it's on every line as structured metadata and can be filtered with | service_instance_id="...".
LogQL
A LogQL query starts with a stream selector ({service_name="bookstore-api"}, labels only) followed by a pipeline: |= and != search the line text, | key="value" filters on structured metadata or on fields extracted by a parser. Keep the selector narrow, because Loki reads every chunk the selector finds; the pipeline runs inside those chunks. The error lines:
{service_name="bookstore-api"} | detected_level="error"

Resilience event occurred. EventName: 'OnTimeout', Source: 'IPaymentGateway-payment-provider//Timeout', Operation Key: '', Result: ''
Resilience event occurred. EventName: 'OnTimeout', Source: 'IPaymentGateway-payment-provider//Timeout', Operation Key: '', Result: ''
Payment for order 4686 failed
Loki adds detected_level itself, deriving it from the OTLP severity. LogQL's metric queries turn lines into numbers. For the 181-second run, the line count by level and the breakdown by the scope that wrote the log:
sum by (detected_level) (count_over_time({service_name="bookstore-api"}[181s]))
{detected_level="info"}   1192
{detected_level="warn"}   261
{detected_level="error"}  141

sum by (scope_name) (count_over_time({service_name="bookstore-api"}[181s]))
{scope_name="Polly"}                                            788
{scope_name="Bookstore.Ordering.OrderService"}                  407
{scope_name="Bookstore.Notifications.OrderConfirmationSender"}  393
{scope_name="Microsoft.Hosting.Lifetime"}                       4
{scope_name="Microsoft.EntityFrameworkCore.Migrations"}         2
The second query shows a cost fact: half of the lines are Polly's resilience logs. Most of the 141 "error" lines aren't errors either, but timeouts that a retry recovered; Polly writes every timeout at Error level. A team that sees these numbers lowers Polly's log level, because the same information already exists as a metric (resilience_polly_strategy_events_total). unwrap computes with a field's value. We can get the order duration from logs too:
quantile_over_time(0.95, {service_name="bookstore-api"} |= "placed" | unwrap ElapsedMs [181s]) by (service_name)
{service_name="bookstore-api"}  8544
The p95 measured by the traffic tool was 8,544 ms as well. The filter catches both "Order 4695 placed" and "Order not placed" lines, and both carry ElapsedMs. Still, treat producing metrics from logs as a temporary tool: every query reads the lines again. A value you watch continuously belongs in a histogram.
From Logs to Traces and Back
With the failed order's trace_id we got every line of that request in time order (level and the start of the line, shortened):
{service_name="bookstore-api"} | trace_id="5fd74d9e6aab18e18112a647d261eb29"

Error        Resilience event occurred. EventName: 'OnTimeout', Source: 'IPaymentGateway-payment-provider//Timeout', ...
Warning      Execution attempt. Source: 'IPaymentGateway-payment-provider//Retry', ... Result: 'The operation didn't complete within the allowed tim
Warning      Resilience event occurred. EventName: 'OnRetry', Source: 'IPaymentGateway-payment-provider//Retry', ...
Error        Resilience event occurred. EventName: 'OnTimeout', Source: 'IPaymentGateway-payment-provider//Timeout', ...
Warning      Execution attempt. Source: 'IPaymentGateway-payment-provider//Retry', ... Result: 'The operation didn't complete within the allowed tim
Warning      Resilience event occurred. EventName: 'OnRetry', Source: 'IPaymentGateway-payment-provider//Retry', ...
Information  Execution attempt. Source: 'IPaymentGateway-payment-provider//Retry', ... Result: 'The operation was canceled.', ...
Error        Resilience event occurred. EventName: 'OnTimeout', Source: 'IPaymentGateway-payment-provider//Timeout', ...
Error        Payment for order 4686 failed
Warning      Order not placed: PaymentFailed, took 10015 ms
The story reads in the logs too: two attempts hit the 4-second attempt timeout, the 10-second total timeout ran out in the middle of the third attempt, and the payment failed. Grafana does this in one click: otel-lgtm's Loki data source has a derived field for trace_id; when you open a line, a link to Tempo shows up next to trace_id. The other direction is defined too: the Tempo data source opens a query from a span to the Loki lines with the same trace_id. Together with exemplars, the bridge between the three signals is complete: from a spike in a metric to the trace, from the trace to that request's logs.
Retention and Cost
This 400-order run produced 1,594 lines in 3 minutes, about 177 KB of line text; structured metadata, especially exception stack traces, comes on top of that. Four lines per order looks small, but at a million orders a day it's 4 million lines. Loki's cost advantage is that the index stays small and the chunks sit in cheap object storage. Retention in Loki is managed through the compactor; choose the period by what the logs are kept for: a few weeks is often enough for debugging, while audit logs belong elsewhere, under separate rules. Which logs to keep for how long and how to set levels in production is the Logging series' topic; we'll come back to ingestion cost in the series' production post.
ELK, OpenSearch and Seq
We didn't run the tools in this section for this post. ELK rests on a different model: Elasticsearch indexes every field and offers full-text search. Searches like "every line containing this error message, last 30 days" are very fast; in return the index itself is large, and running the cluster (shards, heap, index lifecycle) is a specialty of its own. Logs can be taken in through Elastic Agent, Logstash or OTLP. OpenSearch is the open-source fork AWS started after Elasticsearch's license change; the same model, with OpenSearch Dashboards. Seq is a tool that runs on a single server and is built for structured logs; it's where .NET teams most easily start, locally and in small setups. It takes logs and traces over OTLP and works directly with Serilog; it reaches its limits as scale and high-availability needs grow.
| Situation | Recommended | Why |
|---|---|---|
| Small team, one environment, mostly .NET | Seq | Set up in minutes, strong queries on structured logs |
| Metrics and traces already in Grafana | Loki | Cheap storage, logs, traces and metrics on one screen |
| Mostly full-text search (support, security) | ELK or OpenSearch | Every field indexed; the highest operating cost |
| A team that doesn't want to run infrastructure | A managed service (Azure Monitor, Grafana Cloud…) | Nothing to operate; priced by ingestion and retention volume |
In Production
Think about log levels together with metrics. In our run half the lines came from Polly, and the same information already existed as a metric. If an event needs to be both a log and a metric, write the log at Debug instead of Warning and turn it off in production; the metric gives the count.
When you turn on IncludeFormattedMessage, look at what goes into the body. The template's values are now inside the line; every log that puts personal data into its template carries that data into the line too. That's why the masking rule in the Collector matters; the real fix is not writing personal data to logs at all.
Manage Loki's label list centrally. When application teams add resource attributes, Loki's default list can create new labels; check Loki's effective config and the stream count regularly.
Common Pitfalls
Putting a request id, order id or user id into a Loki label. Every value is a new stream; the index grows, queries slow down and you hit Loki's stream limits. Every high-cardinality field belongs in structured metadata or inside the line.
Sending logs both from a Serilog sink and from OpenTelemetry. If you set Serilog up as the ILogger provider and turn on OpenTelemetry's logging provider at the same time, every line goes to the backend twice: once from Serilog's sink, once over OTLP. The bill and the counts double; pick one path.
Searching the line text for a template's value. With IncludeFormattedMessage off, the values are in attributes, not in the line; write | OrderId="4686", not |= "4686". Even with it on, a structured metadata filter is more precise than a line search.
Assuming config works without looking at the effective config. Our first Loki setting loaded without an error and changed nothing. After a change, check the stream count or /config.
A Small Experiment
★☆☆ In Grafana's Explore run {service_name="bookstore-api"} | detected_level="error", open a line and use the link next to trace_id to go to the trace in Tempo. Which span in the trace wrote that line?
★★☆ In appsettings.json set the log level of the Polly category to Warning, send the same traffic and measure with sum by (scope_name) (count_over_time(...)) how much the line count drops. What information did you lose, and what is still in the metrics?
★★★ Add service.instance.id back to the default list in the Loki config, restart the API five times and count the streams. Then write a LogQL query that answers the same question with structured metadata: "how many different API instances wrote logs in the last hour?"
All three signals are now in their backends and linked to each other. But nothing happens until someone looks at them; Gül's complaint came from a customer, not from an alert. In the next post we move to alerting: which symptoms get an alert, Prometheus alerting rules with Alertmanager versus Grafana Alerting, runbooks and alert fatigue.