

Dashboards with Grafana: RED and USE Dashboards, Variables, Exemplars from Metrics to Traces and Dashboards as Code

A good Grafana dashboard answers one question: RED shows a service's health, USE shows resource saturation. We keep two dashboards for Bookstore as JSON in Git and load them with provisioning, feed variables from target_info and use exemplars to jump from a p99 spike to the trace of a slow request, and we measure why tail sampling leaves most exemplars without a trace.
Version note: The examples in this post were run with .NET 10, OpenTelemetry .NET 1.21 and the grafana/otel-lgtm 0.41.0 image (Grafana 13.3.0, Prometheus 3.16.0, Tempo 3.1.1, Loki 3.7.9, OpenTelemetry Collector contrib 0.165.0).
Guess First
We turned on exemplars in the p99 graph of checkout duration for Bookstore, the online bookstore used as the shared example across this site's series: small dots on top of the lines, each one standing for a single request. After a run of 1,200 orders Prometheus returned 119 exemplars for the checkout route. We asked Tempo for the trace id of every one of them. All 51 exemplars slower than 1 second opened their trace; of the 68 exemplars faster than 1 second only 5 did, and 63 answered "trace not found". Are exemplars broken, or is Tempo losing data? Neither; the answer is in the exemplar section.
Data Sources and a Ready-Made Stack
The grafana/otel-lgtm container we set up in the Collector post starts Grafana with three data sources: Prometheus (metrics), Tempo (traces) and Loki (logs). They come from a provisioning file inside the image, and the bridges between them are defined there too: the trace_id label of a Prometheus exemplar points to Tempo, and a span in Tempo links to the Loki lines with the same trace_id. If you don't use this stack, you have to give the same settings on the data source screen or in your own provisioning file; otherwise the exemplar dots show up but lead nowhere when clicked.
Watch one setting of the Prometheus data source: timeInterval, the "scrape interval". otel-lgtm sets it to 60 seconds. Our application sends metrics over OTLP every 15 seconds (OTEL_METRIC_EXPORT_INTERVAL=15000). Grafana computes $__rate_interval from this setting, so in our first screenshot the graphs had one point per minute and a 2.5-minute run fit into three points. The fix is in one of two places: set the data source value to the real export interval, or give the panel "interval": "15s" (Min interval). We did the second in the dashboard file.
Picking the Right Panel Type
A panel's type is the difference between making the answer visible and hiding it. These are the rules we used in Bookstore's dashboard:
- A single number and its trend (request rate, error ratio, orders per minute): stat, with a small trend line behind it.
- Rates and ratios over time: time series. For errors, always a ratio, not a raw count.
- Duration distribution: a heatmap from the histogram buckets. Percentile lines show a few points of the distribution; the heatmap shows all of it.
- Counts by category (order type): stacked bars.
- No gauges or pie charts for durations; both lose the time dimension.
The heatmap has one detail. Prometheus buckets are cumulative counters; for Grafana to draw them correctly the query's format must be heatmap and the panel's own bucket calculation (calculate) must be off. The query is sum by (le) (increase(bookstore_checkout_duration_seconds_bucket[$__rate_interval])). In the screenshot below it's the middle panel on the right: the 0.05–0.25 second range and the 2.5–7.5 second range are full, and everything between 0.5 and 2.5 seconds is empty. It's a two-humped distribution with a gap in the middle; a percentile line doesn't show that, the heatmap shows it at first glance.
The RED Dashboard
RED stands for rate, errors and duration, and it's the first dashboard for every service that answers requests. We put Bookstore's into the repo as deploy/observability/grafana/dashboards/bookstore-api-red.json. It has ten panels: four stats at the top (requests per second, 5xx ratio, checkout p95, orders per minute), then a per-route breakdown, checkout duration, the heatmap, the payment provider's retries and timeouts, and orders by type. The checkout duration panel looks like this (the first two targets are left out):
{
  "id": 7,
  "type": "timeseries",
  "title": "Checkout duration (POST /api/orders/)",
  "datasource": { "type": "prometheus", "uid": "prometheus" },
  "interval": "15s",
  "targets": [
    {
      "expr": "histogram_quantile(0.99, sum by (le) (rate(http_server_request_duration_seconds_bucket{job=\"$service\", deployment_environment_name=\"$env\", instance=~\"$instance\", http_route=\"/api/orders/\"}[$__rate_interval])))",
      "legendFormat": "p99",
      "refId": "C",
      "exemplar": true
    }
  ],
  "fieldConfig": { "defaults": { "unit": "s" }, "overrides": [] }
}
The queries are the same PromQL as in the previous post; the difference is that variables replace the fixed values ($service, $env, $instance) and the window is $__rate_interval. $__rate_interval is the safe window for rate that Grafana picks from the time range and the scrape interval; it's better than writing [5m] by hand, because the dashboard works whether it shows 7 days or 15 minutes. "unit": "s" is small but important: Grafana writes the value in a readable form such as 250 ms or 5.53 s.
During the 1,200-order run the dashboard looked like this:
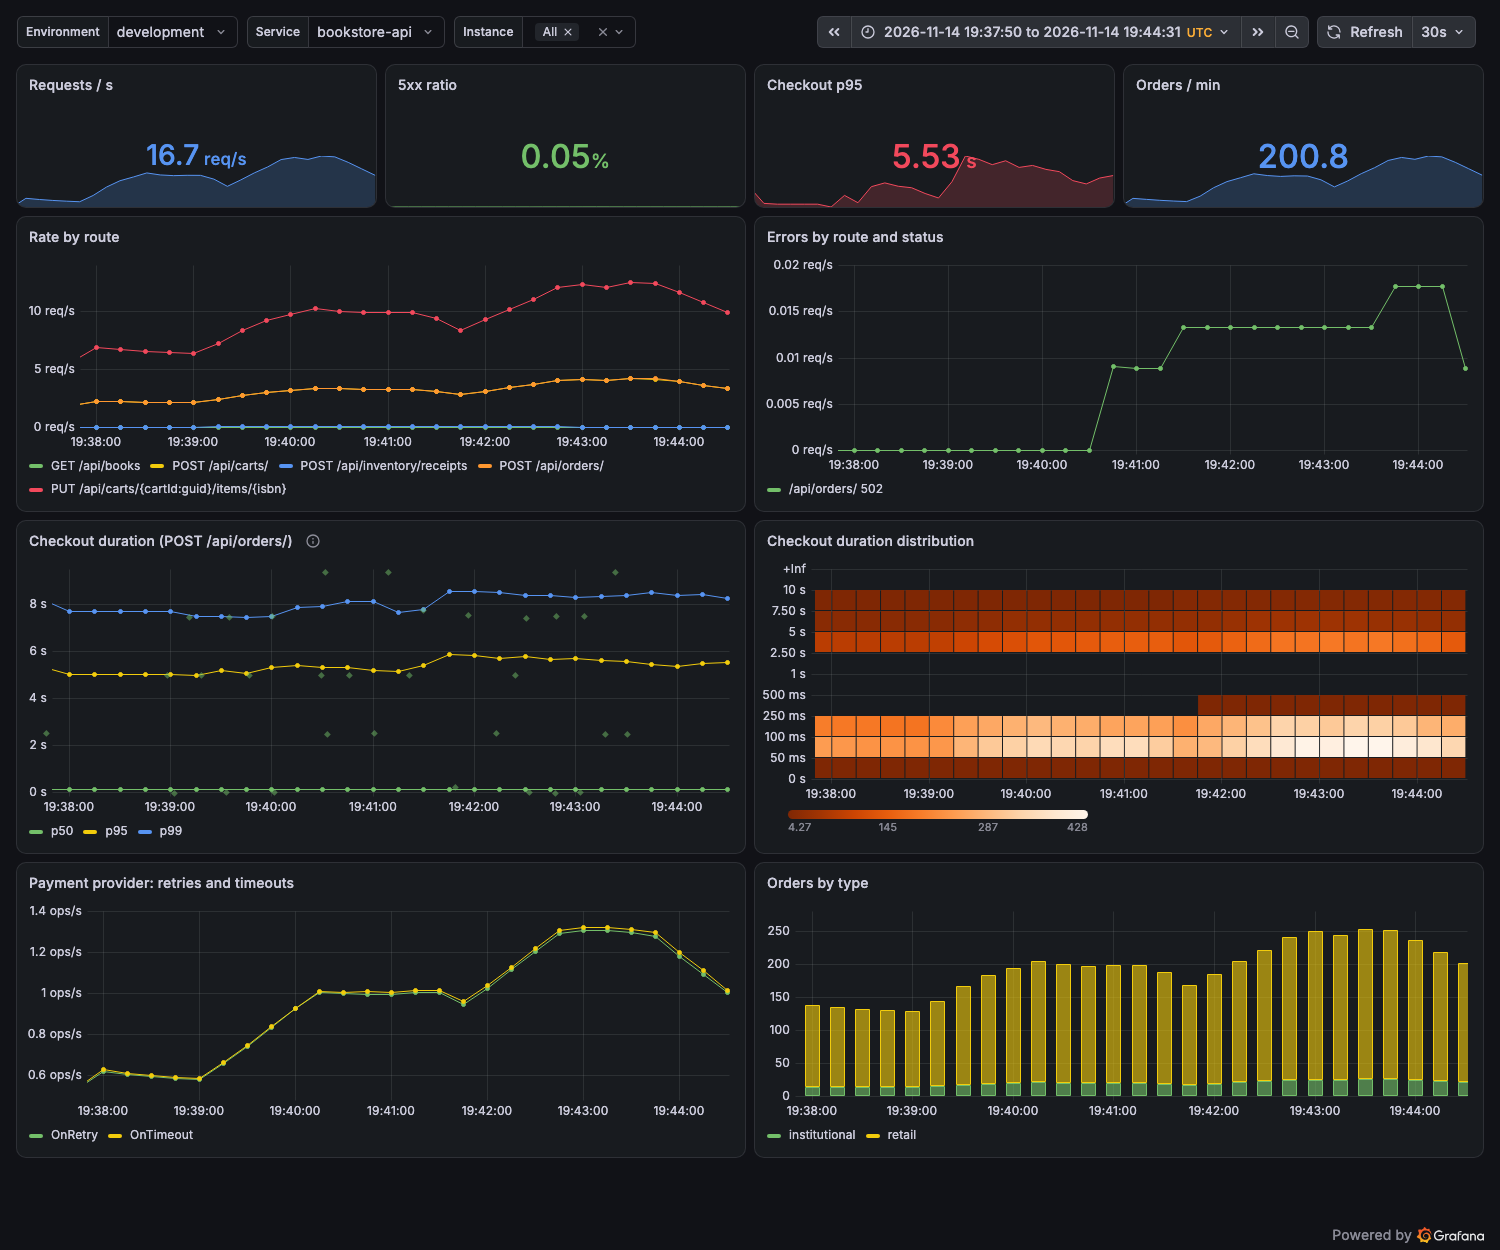
The top row gives the state in four numbers: 16.7 requests per second, a 5xx ratio of 0.05 percent, a checkout p95 of 5.53 seconds, 200.8 orders per minute. The red p95 is a threshold setting: orange at 1 second, red at 3. With the error ratio almost zero, the duration panels and the retry panel show where the problem is: p95 steady around 5 seconds, p99 around 8; 1–1.3 retries per second go to the payment provider, and the retry and timeout lines lie on top of each other. Every timeout turns into a retry. Panel titles and legends are in English; the dashboard is the team's shared tool and is treated like code.
The USE Dashboard: Runtime
USE stands for utilization, saturation and errors, and it looks at resources: CPU, memory, the thread pool. In .NET all of these signals come ready from the System.Runtime meter (we saw it in the post on producing metrics). The second dashboard, bookstore-api-runtime.json, has six panels: CPU used (rate(dotnet_process_cpu_time_seconds_total[...])), working set, heap size after the last GC, GC count by generation, thread pool threads and queued work items, and lock contentions. The most telling saturation panel is the thread pool queue: if the queue doesn't drain, the pool can't keep up.
During the same run this dashboard was calm: the API used about 0.05–0.07 cores, the heap moved between 30 and 34 MiB, the thread pool went up to 10 threads at most and the queue held at most 1 work item. That is information: while 5 percent of checkouts took longer than 5 seconds, nothing was tight in the API's resources. The time isn't spent on the CPU or in the thread pool, it's spent waiting for something. RED said "users are waiting", USE says "the machine is idle"; read together, suspicion turns to the external dependency, the payment provider. In the first post, when Gül reported the complaint, CPU and memory were normal too.
Variables
Instead of copying the dashboard for every environment and service we use variables. There are three: env, service and instance. Their values come from the target_info series; the resource attributes of every service that sends over OTLP live there:
{
  "name": "instance",
  "label": "Instance",
  "type": "query",
  "datasource": { "type": "prometheus", "uid": "prometheus" },
  "query": {
    "query": "label_values(target_info{job=\"$service\", deployment_environment_name=\"$env\"}, instance)",
    "qryType": 1
  },
  "refresh": 2,
  "multi": true,
  "includeAll": true,
  "allValue": ".*"
}
The variables are chained: the list for service depends on the chosen env, the list for instance on the chosen service. refresh: 2 reloads the list when the time range changes, so pods that stopped an hour ago don't stay in it. instance is multi-select with an "All" option, which is why the queries say instance=~"$instance" (a regex, not equality) and why we set allValue to .*. Without it Grafana turns "All" into a long regex of every value, a|b|c|...; for a service with a hundred pods the query gets both long and slow.
A warning: for series that arrive over OTLP, instance comes from service.instance.id, and the .NET SDK generates it as a random GUID at every process start. If you want something readable in the legend, send the pod or host name as a resource attribute and turn it into a label; otel-lgtm's Prometheus config already promotes k8s.pod.name and host.name.
Exemplars: From Metrics to Traces
An exemplar is a sample of one of the measurements that fell into a histogram bucket: its value, its time and the trace_id/span_id at that moment. When you see a spike in the p99 line, it lets you jump with one click to the trace of one of the requests that caused it. The chain has three links. The first is the application: in OpenTelemetry .NET exemplars are off by default. The docs give the performance cost as the reason; the specification recommends having them on. Turning them on is one line:
.WithMetrics(metrics => metrics
    .AddMeter("Bookstore.*", "Polly")
    .AddAspNetCoreInstrumentation()
    .AddHttpClientInstrumentation()
    .AddRuntimeInstrumentation()
    // Exemplars are off by default in .NET: keep one sampled measurement with its trace_id per bucket,
    // so a p99 spike on a dashboard leads to the trace of a slow request.
    .SetExemplarFilter(ExemplarFilterType.TraceBased)
    // GET /metrics for a Prometheus that scrapes (pull); OTLP still pushes the same metrics.
    .AddPrometheusExporter())
TraceBased only offers measurements made inside a sampled span as exemplar candidates; AlwaysOn offers every measurement, but an exemplar without a trace is of limited use. To try it without changing code there is also the OTEL_METRICS_EXEMPLAR_FILTER=trace_based environment variable; if the code calls SetExemplarFilter, the code wins. The OTLP exporter carries the exemplars. The second link is Prometheus: it has to start with --enable-feature=exemplar-storage to keep them (otel-lgtm does). The third link is Grafana: the panel's target needs "exemplar": true and the Prometheus data source has to point the trace_id label at Tempo. Independently of Grafana, you can read exemplars from Prometheus's API:
curl -s -G http://localhost:9090/api/v1/query_exemplars \
  --data-urlencode 'query=http_server_request_duration_seconds_bucket{job="bookstore-api", http_route="/api/orders/"}' \
  --data-urlencode "start=$START" --data-urlencode "end=$END" | jq -c '.data[] | select(.seriesLabels.le == "10") | .exemplars[0:2][]'

{"labels":{"span_id":"53f14ebd0181bfd5","trace_id":"f53aa1658427faaa8e1b879af6f5e460"},"value":"9.5162037","timestamp":1794685232.467}
{"labels":{"span_id":"7f1bf763439455bb","trace_id":"ee324f164139405b27daa023898c3905"},"value":"9.5233664","timestamp":1794685269.717}
The first exemplar comes from a 9.5-second checkout and its trace is in Tempo. The answer to Guess First is here too. The SDK records the exemplar the moment the request ends; at that moment the span is sampled, so the TraceBased filter accepts it. Whether the trace is kept is decided later by the tail sampling we set up in the Collector post: it keeps every error and every trace slower than 1 second, and 10 percent of the rest. That's why every exemplar of a slow request opened (51 of 51) and most exemplars of fast requests didn't (5 of 68). Nobody is losing data; the metric side picks the sample and the trace side makes the sampling decision, separately. In practice it's not a problem, because the reason to click an exemplar is almost always a slow or failed request. But if you don't tell the team, someone will open a ticket saying "exemplars don't work".
Going from a trace to logs works the same way: the Tempo data source opens a query from a span to the Loki lines carrying the same trace_id. We'll use that bridge in the post on log backends.
Dashboards as Code
A dashboard built in Grafana's UI lives in Grafana's database: nobody knows who changed what and why, moving it to another environment is manual, and getting it back after a delete is hard. In Bookstore the source of dashboards is Git. We point Grafana at them with a provisioning file:
# Grafana loads every JSON file in the folder at startup and re-reads it every 30 s.
# The files in Git are the source of truth: changes made in the UI cannot be saved back.
apiVersion: 1

providers:
  - name: bookstore
    folder: Bookstore
    type: file
    allowUiUpdates: false
    updateIntervalSeconds: 30
    options:
      path: /otel-lgtm/bookstore-dashboards
We also added two volumes to the compose file: one mounts this file into Grafana's provisioning folder, the other mounts the dashboard JSON files where path points:
    volumes:
      - ./otelcol-config.yaml:/otel-lgtm/otelcol-config.yaml:ro
      # Dashboards as code: the provider file tells Grafana where to look, the JSON files are the dashboards.
      - ./grafana/dashboards.yaml:/otel-lgtm/grafana/conf/provisioning/dashboards/bookstore.yaml:ro
      - ./grafana/dashboards:/otel-lgtm/bookstore-dashboards:ro
We tried what allowUiUpdates: false does: we changed the dashboard's title and tried to save it through Grafana's HTTP API.
curl -s -w ' %{http_code}\n' -X POST -H 'Content-Type: application/json' http://localhost:3000/api/dashboards/db -d @edit.json
{"message":"Cannot save provisioned dashboard"} 400
Grafana refuses to overwrite a dashboard that comes from a file. The flow is: try things in the UI, take the JSON of the version you like, write it into the file in the repo, open a pull request. Dashboards go through review like code and reach every environment from the same commit. If writing JSON by hand is tedious there are tools such as Grafana's Grafonnet (a Jsonnet library) or its Terraform provider; we stayed with plain JSON.
Grafana 13 changed two things here. First, "dynamic dashboards" are now generally available and the default: they come with a new layout engine and a new dashboard schema (v2), and old JSON is converted automatically when opened. Our classic JSON loaded unchanged, and Grafana's new API returns the same dashboard in the v2 schema as well:
curl -s http://localhost:3000/apis/dashboard.grafana.app/v2/namespaces/default/dashboards/bookstore-api-red \
  | jq -c '{apiVersion, managedBy: .metadata.annotations["grafana.app/managedBy"], spec: (.spec | keys)}'

{"apiVersion":"dashboard.grafana.app/v2","managedBy":"classic-file-provisioning","spec":["annotations","cursorSync","description","editable","elements","layout","links","liveNow","preferences","preload","tags","timeSettings","title","variables"]}
In v2 the panels live under elements and the placement in a separate layout object; when a panel moves, its definition doesn't change and diffs stay readable. Second, Grafana 13's release notes say the /api path is deprecated for automation scripts and that they should move to /apis. The save attempt above still works on the old /api, but if you write a new script, use /apis. Git Sync, generally available since Grafana 13, syncs dashboards with a Git repository in both directions; a change made in the UI can go to the repo as a pull request. We didn't try it in this post; file-based provisioning is enough for a local stack.
In Production
Dashboard queries are load on Prometheus too. A ten-panel dashboard that refreshes every 30 seconds, kept open by ten people on the team, means hundreds of queries a minute. Move expensive queries such as percentiles into the recording rules from the previous post, and don't make the dashboard's default refresh shorter than you need.
Manage data sources and who can see what as code too. Locally otel-lgtm gives the anonymous user the Admin role; that's acceptable only on a development machine. A production Grafana needs sign-in, roles and folder permissions; we saw in the Collector post that telemetry can contain customer data.
Put a "what should I do" link on the dashboard. A panel's description and the dashboard links can tell the person looking at 3 a.m. what a number means and which runbook to open. We'll write the runbooks in the alerting post.
Common Pitfalls
The 40-panel "everything" dashboard. Putting every metric on a panel makes the dashboard unreadable; during an incident nobody scans 40 graphs. A dashboard should answer one question: "is the service healthy" (RED), "is the machine under pressure" (USE), "is the business running" (orders). Explore is there for details.
Looking at the average. The average checkout time in this run was under one second; at the same time 5 percent of requests took longer than 5 seconds. Use percentiles and heatmaps in duration panels; never show the average on its own.
Queries that go wrong when "All" is selected. If you write instance="$instance", a multi-selection returns nothing; write =~. Also make sure the variable is combined with sum by in aggregated queries, or every instance becomes its own line.
Leaving the panel unit empty. Without a unit, the reader has to work out that 0.25 and 250 are the same thing (seconds and milliseconds). If the metric name has a unit (_seconds, _bytes), choose the same one in the panel.
Editing dashboards only in the UI. Without provisioning, one day someone deletes one by mistake or a "temporary" change stays forever. A dashboard that isn't in Git should be treated as if it doesn't exist.
A Small Experiment
★☆☆ Add a p95 line split by order type from the bookstore_checkout_duration_seconds histogram to the p99 panel of the RED dashboard and compare institutional and retail orders.
★★☆ Add a single "saturation" stat to the runtime dashboard: the largest value of the thread pool queue length over the last 5 minutes. Make it orange at 10 and red at 100, raise the traffic tool's concurrency from 4 to 32 and see what happens.
★★★ Remove exemplarTraceIdDestinations from the Prometheus data source, see what happens when you click an exemplar dot, then add it back with your own provisioning file. Then raise the probabilistic rate of the Collector's tail sampling to 100 percent and count again how many exemplars of fast requests open a trace.
The dashboard showed us where the problem is: resources are idle, the queue is at the payment provider, and the exemplars lead to the traces of 7–9 second requests. In the next post we open those traces: the architectural difference between Jaeger v2 and Grafana Tempo, searching with TraceQL, and finding and fixing the two causes of the checkout case we've followed since the first post, the retry storm and the N+1 query, in the trace waterfall.