

What Is Observability? How It Differs from Monitoring and the Question Each of Logs, Metrics and Traces Answers
Observability is being able to ask, from the logs, metrics and traces a system emits, a question you had not thought of beforehand; monitoring watches for known failures. We narrow down Bookstore's checkout that sometimes takes 8 seconds with logs, metrics from dotnet-counters and traces, and look at the telemetry pipeline and the cost of cardinality.
Version note: The examples in this post were run with .NET 10 (SDK 10.0.402), Microsoft.Extensions.Http.Resilience 10.11, dotnet-counters 10.0 and SQL Server 2025 running in a container.
Guess First
In Bookstore, the online bookstore used as the shared example across this site's series, Gül from customer support passes on a complaint: "When I press the order button the page sometimes waits 8 seconds." You look at the logs: one line per order, no errors, every request returned 201. You also look at the average duration: about 1 second. Two questions. If the average is 1 second, is "8 seconds" an exaggeration? And can you find the cause of a slowdown that logs no error by reading the logs? Both answers will be clear by the end of this post; the actual fix comes later in the series, with a trace backend.
The Case: Checkout Sometimes Takes 8 Seconds
Throughout the Observability series we work with the same application: Bookstore.Api from Bookstore's reference application (the Catalog, Ordering and Inventory modules, Entity Framework Core 10 and SQL Server). We added two things to it for this series. The first is a Payments module: after the order is saved it goes to the external payment provider with an HttpClient and has the payment authorized. Because it is an external call, a resilience pipeline sits in front of it:
services.AddHttpClient<IPaymentGateway, PaymentGatewayClient>(client => client.BaseAddress = baseAddress)
    .AddResilienceHandler("payment-provider", pipeline =>
    {
        // Outer: up to 3 retries, 500 ms apart. Inner: every attempt gets 2 seconds.
        pipeline.AddRetry(new HttpRetryStrategyOptions
        {
            MaxRetryAttempts = 3,
            Delay = TimeSpan.FromMilliseconds(500),
            BackoffType = DelayBackoffType.Constant,
            UseJitter = false
        });
        pipeline.AddTimeout(TimeSpan.FromSeconds(2));
    });
The mechanics of retries and timeouts belong to the External Service Integration and Resilience series; what matters here is that this setting looks reasonable on paper. The second addition is a small application that stands in for the payment provider: tools/Bookstore.FakePaymentProvider. It imitates a typical bad day of a real provider: one of the four nodes behind it is slow, so every attempt has a 25 percent chance of taking 3 seconds, the rest take 40–120 ms. There is also a console application that generates traffic: tools/Bookstore.Traffic opens a new cart for every order, adds 1–3 books (every tenth order is an institutional order with 12 books) and measures the duration of POST /api/orders. We ran the three applications (see the README in the repository for the SQL Server connection):
dotnet run --project tools/Bookstore.FakePaymentProvider
dotnet run --project src/Bookstore.Api
dotnet run --project tools/Bookstore.Traffic -- 300 4

orders=300 concurrency=4
status: 201=295, 502=5
POST /api/orders ms: avg=1013 p50=106 p95=5130 p99=9533 max=9557
slower than 2 s: 69, slower than 7 s: 11
The answer to the first question is right here. The average is 1013 ms, but no customer experiences that number. Half of the orders finish under 106 ms; 69 of the 300 take more than 2 seconds and 11 take more than 7. The average mixes a very fast majority with a very slow minority and hides both. That is why p95 (the duration that 95 percent of requests stay under) and p99 exist: they show the tail of the distribution, which is what the complaining customer lives through.
What the Logs Say and What They Don't
These 300 orders wrote 2,224 log lines to the API's console. One line per order is ours; the rest are lines from HttpClient and from Polly, the resilience library. The line of a slow order looks like this:
19:06:03.830 info: Bookstore.Ordering.OrderService[0] Order 2688 placed: 1 items, 429.00 TRY, took 7606 msThis line proves the symptom: order 2688 took 7.6 seconds. For the cause you look at the lines just above it (long lines shortened):
19:06:01.678 info: System.Net.Http.HttpClient.IPaymentGateway.LogicalHandler[100] Start processing HTTP request POST http://localhost:5090/v1/charges
19:06:01.990 warn: Polly[3] Execution attempt. Source: 'IPaymentGateway-payment-provider//Retry', ... Handled: 'True', Attempt: '0', ...
19:06:02.492 info: System.Net.Http.HttpClient.IPaymentGateway.ClientHandler[100] Sending HTTP request POST http://localhost:5090/v1/charges
19:06:03.161 warn: Polly[3] Execution attempt. Source: 'IPaymentGateway-payment-provider//Retry', ... Handled: 'True', Attempt: '0', ...
19:06:03.250 warn: Polly[3] Execution attempt. Source: 'IPaymentGateway-payment-provider//Retry', ... Handled: 'True', Attempt: '2', ...
19:06:03.679 warn: Polly[3] Execution attempt. Source: 'IPaymentGateway-payment-provider//Retry', ... Handled: 'True', Attempt: '0', ...
19:06:03.825 info: Polly[3] Execution attempt. Source: 'IPaymentGateway-payment-provider//Retry', ... Result: '200', Handled: 'False', Attempt: '3', ...
19:06:03.825 info: System.Net.Http.HttpClient.IPaymentGateway.LogicalHandler[101] End processing HTTP request after 7585.6352ms - 200
19:06:03.830 info: Bookstore.Ordering.OrderService[0] Order 2688 placed: 1 items, 429.00 TRY, took 7606 ms
There is a hint: the payment call took 7,585 ms and the last, successful attempt is Attempt: '3', the fourth one. But in this 2.5-second window the attempts of three different orders are interleaved, and Polly's lines carry no order number. You cannot tell from the lines which timeout belongs to 2688; four requests were in flight at the same time. You need a key that groups lines by request. That key already exists, it just isn't shown on the console. With IncludeScopes added to the logging settings, the same kind of line looks like this:
18:29:04.426 info: Bookstore.Ordering.OrderService[0] => SpanId:b9486bb602fccc43, TraceId:4df013bdd225d4e8888c0f12c8408ec6, ParentId:0000000000000000 => ConnectionId:0HNQ2FKGOCG4F => RequestPath:/api/orders RequestId:0HNQ2FKGOCG4F:0000001F Order 403 placed: 1 items, 219.90 TRY, took 2625 msEven without OpenTelemetry, ASP.NET Core opens an Activity for every request and its TraceId goes into the log scope. That id is the key for grouping by request and, later, for jumping from a log to a trace; the details are in the correlation and trace context post of the .NET Logging series. What matters for this post: logs answer "what happened" in detail, but they answer "how often" and "where did the time go" only if you stitch the lines together by hand.
Metrics: How Often, How Bad?
Since .NET 8, ASP.NET Core keeps a histogram called http.server.request.duration on its own. You don't need a backend to read it; dotnet-counters, covered in the .NET Profiling and Diagnostics series, attaches to the running process and collects the values. We found the process id with dotnet-counters ps and collected 10-second intervals during the traffic:
dotnet-counters collect -p <PID> --refresh-interval 10 --format csv -o counters.csv `
    --counters "Microsoft.AspNetCore.Hosting[http.server.request.duration]"
From the CSV we kept only the POST /api/orders rows (seconds; times in UTC):
19:06:01  201 p50=0.090  p95=5.070  p99=5.078
19:06:11  201 p50=0.108  p95=7.625  p99=7.625   502 p50=9.531
19:06:21  201 p50=0.124  p95=5.125  p99=5.141
19:06:31  201 p50=0.102  p95=2.629  p99=7.609   502 p50=9.547
19:06:41  201 p50=0.106  p95=5.094  p99=7.641
19:06:51  201 p50=0.113  p95=5.125  p99=7.578
19:07:01  201 p50=0.103  p95=2.613  p99=5.133   502 p50=9.531
The metric's answer differs from the logs' and complements it. The problem is not a one-off; it repeats in every 10-second window. The median stays around 0.1 seconds, while the tail clusters at 2.6, 5.1 and 7.6 seconds. Those three numbers are not random: a 2-second timeout plus a 0.5-second wait plus a normal response, once, twice and three times. A tail with "steps" says the problem is in a retry loop. The 9.5-second 502s are the orders where all four attempts timed out. The metric said this with a handful of numbers instead of 300 log lines, and its cost does not depend on the request count: with 3,000 orders the same few series are kept.
What the metric cannot say is which order was slow and why. The values are aggregated; a 7.6-second request only incremented the counter of one bucket in the histogram. The order number, the number of books and the customer are not in the metric, and they shouldn't be; we will see why in the section on cost.
Traces: Where Did the Time Go?
The third question: what is inside those 7.6 seconds? Reading the cart, the stock check, the stock reservation, writing the order, the payment, its four attempts... We saw some of them in the logs and the duration distribution in the metric, but neither gives the timeline inside a single request. A trace does: every step a request passes through is a span with a start, a duration and a parent, and they all carry the same trace id. When we set up OpenTelemetry in the next post, the trace of a slow order will show every SQL query and every HTTP attempt to the payment provider as a separate bar: the attempts that timed out are cut at exactly 2 seconds, the last one finishes in a few tens of milliseconds. The answer to "where did the time go" fits on one screen.
Traces have a limit too: keeping every span of every request is expensive. Production systems usually sample, and the trace you are looking for may not have been kept. That is why the three signals don't replace each other: the metric says "is there a problem and how big is it" and fires the alert, the trace says "where", the log says "what exactly happened".
How Monitoring Differs from Observability
Monitoring is watching for failures you know about in advance: is the CPU above 90 percent, is the disk filling up, did the error rate exceed 1 percent. You write the question beforehand, the system computes the answer continuously, and an alert fires when a threshold is crossed. Observability is being able to ask, from the signals a system emits, a question you had not thought of beforehand, and get an answer. Nobody builds a dashboard in advance for "how long do institutional orders take when the payment provider's second attempt times out?" But if order type, attempt number and duration are linked in the telemetry, you can ask it in the middle of an incident.
The two are not rivals. A system with observability is still monitored; alerts are still built on known symptoms. The difference starts after the alert fires: monitoring only says "something is broken", observability lets you investigate "why" without deploying new code. The Monitoring Distributed Systems chapter of Google's SRE book also puts the things users feel first among the signals to watch: latency, traffic, errors and saturation. In our case latency was the first indicator; CPU and memory were completely normal the whole time.
Signals, Bridges and the Telemetry Pipeline
A phrase you often hear in observability discussions is "three pillars": logs, metrics and traces. It is a useful start, but it misleads in two ways. First, it suggests three separate tools, while the value comes from linking the signals. Second, the list is not closed. OpenTelemetry today supports traces, metrics, logs and baggage; its documentation still lists profiles, a continuous record of which code a process spends its CPU and memory in, and events as under development.
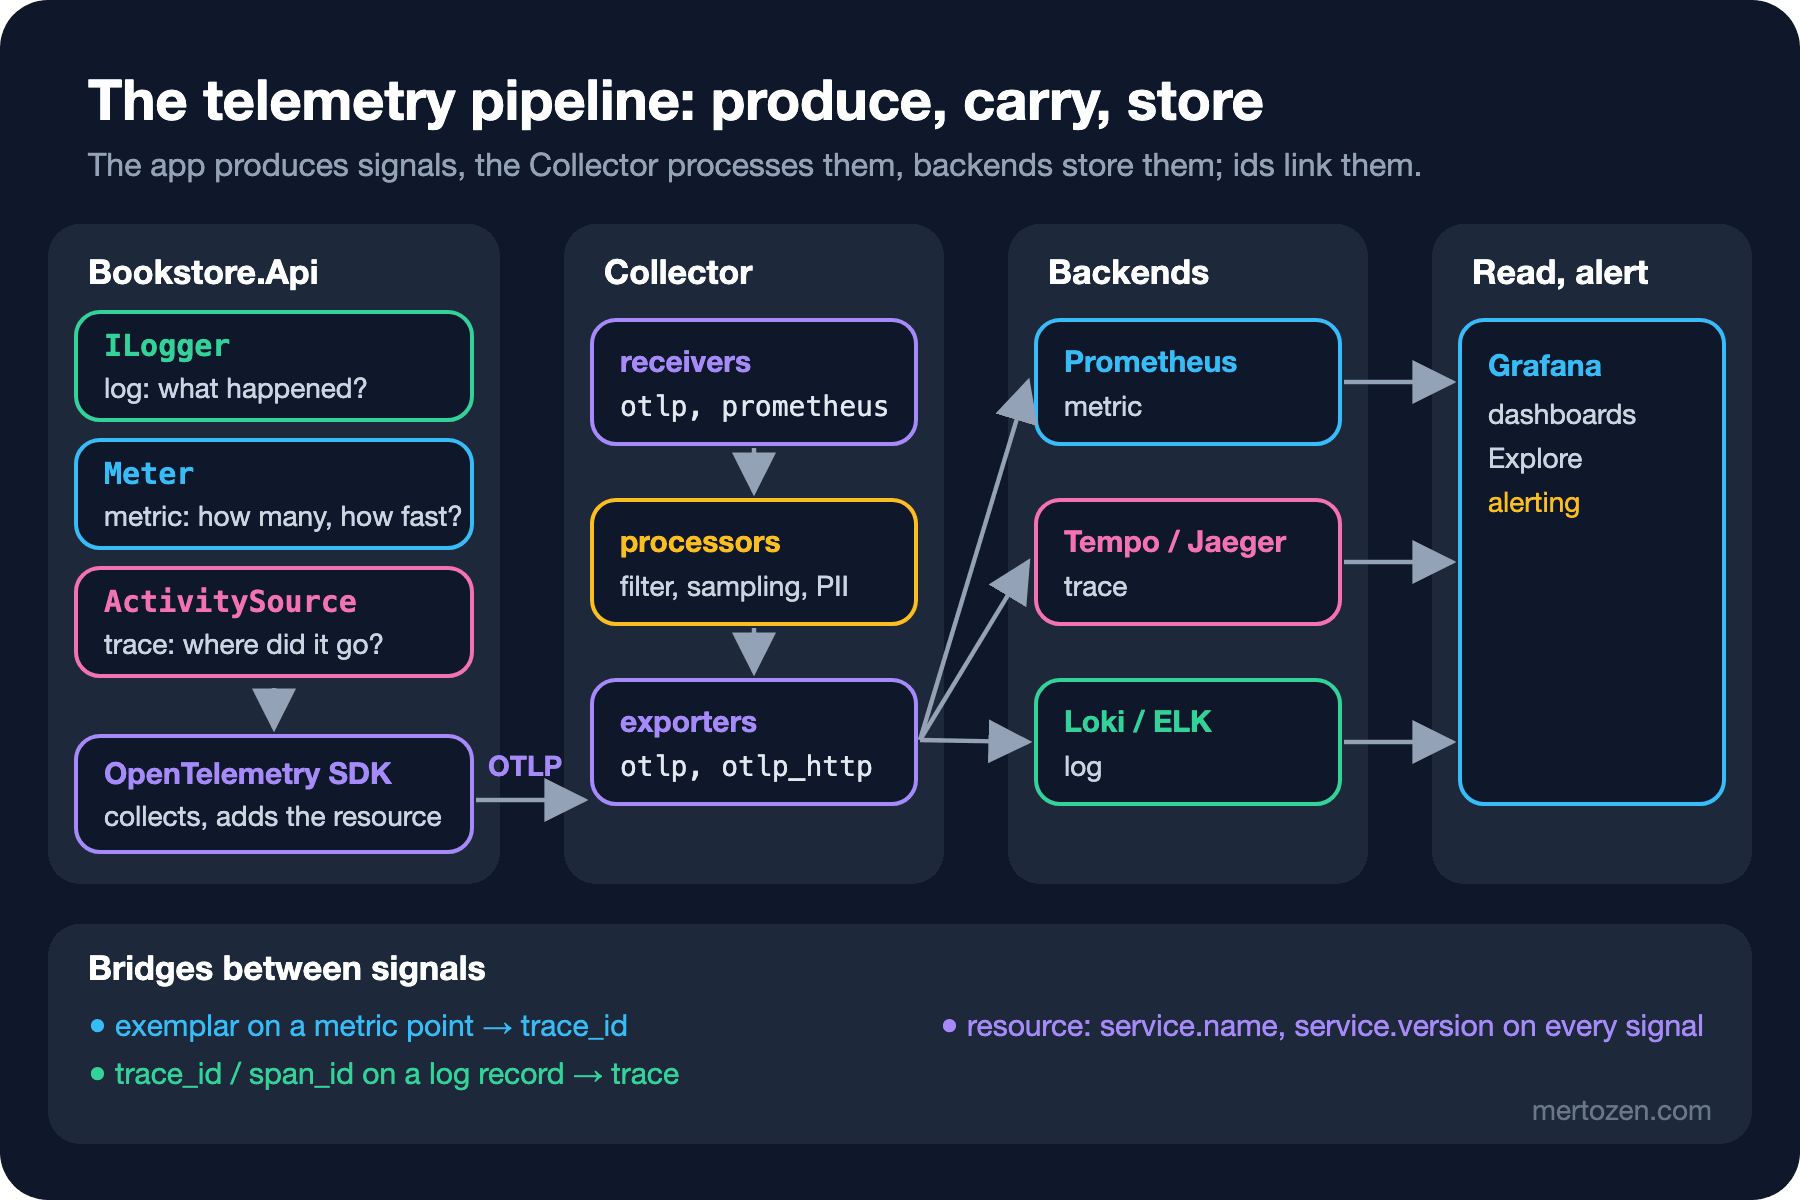
The bridges between signals are concrete fields. If a log record carries trace_id and span_id, one click takes you from the log to the trace of that request. If a histogram point carries an exemplar, the trace id of one of the measurements that fell into that bucket, you can go from a spike in the p99 chart to the trace of one of the requests behind it. If every signal carries the same resource attributes (service.name, service.version, the environment), you can filter all three for the same service and the same version.
The signals travel as shown in the figure above. The application produces them with .NET's own APIs: ILogger for logs, Meter for metrics, ActivitySource for traces. The OpenTelemetry SDK collects them, adds the resource information and sends them over OTLP, the standard protocol for carrying telemetry. An OpenTelemetry Collector sits in between: it receives the data, filters it, samples it, removes personal data and sends it to one or more backends. Each signal has its own backend: Prometheus for metrics, Tempo or Jaeger for traces, Loki or the ELK stack (Elasticsearch, Logstash and Kibana) for logs. At the end, a tool like Grafana serves dashboards and alerts.
The main gain of this structure is vendor neutrality. The application only speaks OTLP; moving the backend from Prometheus to Azure Monitor is a change in the Collector's config, not in application code. The order of the series follows this path too: first producing signals in .NET (setting up OpenTelemetry, metrics, traces), then the Collector, Prometheus, Grafana, trace and log backends, and finally alerting and production.
A First Look at Cost and Cardinality
The cost of the three signals scales very differently. Logs and traces grow in proportion to the request count: 300 orders wrote 2,224 log lines; at a million orders a day that is more than 7 million lines, each to be stored and indexed. Metrics grow not with requests but with the number of time series. A time series is one combination of a metric name and its labels (route, status code and so on). The histogram above has two series for POST /api/orders, 201 and 502, whether there are 300 requests or 3 million.
Cardinality is the number of distinct values a label can take. http.response.status_code takes a few values, no problem. But add an order number or a customer e-mail as a label on a metric and every order opens a new time series; the metric becomes as expensive as logs without being as detailed. The rough rule: high-cardinality data (ids, e-mail, the full URL) goes into traces and logs, low-cardinality data (order type, payment method, outcome) into metrics. In the third post we will measure the series budget and see what the OpenTelemetry SDK does when it is exceeded.
The .NET Logging series covered producing the right logs in the application: what to log, levels, Serilog, redaction. This series picks up from there; here logs appear only as OpenTelemetry's log signal and as a backend.
In Production
Don't alert on the average. In our case the average was 1 second, and a threshold like "above 1 second" either never fires or fires all the time. Put the threshold on a percentile (p95, p99) and measure durations as a histogram; an average written to a gauge cannot be turned into a percentile later.
Count retries as part of your telemetry. In this case the payment provider is actually slow for a quarter of the requests, but because of the retries the number of calls to the provider is clearly higher than the number of orders. The fake provider's log shows the four attempts of 2688 one by one. If you don't keep the retry count as a metric, you can't see the load your own system puts on others.
Don't leave telemetry for the end. We took the measurements in this post without changing code, because ASP.NET Core and HttpClient already produce their own metrics and Activity objects. But business information like "order type" only you can add, and adding it in the middle of an incident is too late.
Common Pitfalls
Treating logs as the answer to everything. Logs show a slowdown without errors only if you stitch lines together by hand, which is close to impossible with concurrent requests. For questions of duration and frequency, metrics and traces are cheaper and clearer.
Reading "three pillars" as three separate purchasing decisions. If you set up three tools without the trace_id, resource and exemplar bridges between them, during an incident you end up matching timestamps across three screens.
Mistaking monitoring for observability. The CPU, memory and disk dashboards were all green in this case. A system that doesn't measure the symptom users feel (latency, errors) learns about the problem only through complaints.
Treating local measurements as absolute. 106 ms and 7.6 seconds are the numbers of this machine and this fake provider. What matters is the shape of the distribution: the gap between the median and the tail, and the steps in the tail.
A Small Experiment
★☆☆ Set the fake provider's Provider:SlowRatio to 0 (in appsettings.json or through the Provider__SlowRatio environment variable) and run the same traffic again. What happens to p95 and p99? Does the gap between the average and the median close?
★★☆ Remove the retry strategy from the pipeline (keep only the timeout) and run the same traffic. How do the number of 502s and the tail change? Which is worse for the user: waiting 7.6 seconds and succeeding, or getting an error after 2 seconds?
★★★ Point dotnet-counters at the System.Net.Http meter and collect http.client.request.duration. Compare the server-side http.server.request.duration with the client-side duration of the payment call: how much of the tail comes from the payment call?
We saw which question each of the three signals answers and the parts of the pipeline. In the next post we build the first link of this pipeline: how OpenTelemetry is structured (spec, API, SDK, instrumentation, OTLP), adding OpenTelemetry to Bookstore.Api, resource attributes, and viewing the telemetry locally with the standalone Aspire Dashboard. That is where we open the trace of a slow order like 2688 for the first time.