

Distributed Tracing: Spans, Context Propagation, W3C traceparent and Custom Spans with ActivitySource
Distributed tracing records every step of a request as spans carrying the same trace id; in .NET a span is an Activity, and it travels between services in the W3C traceparent header. We add spans to Bookstore's checkout with ActivitySource, record exceptions and status, and look at the traceparent of retries, baggage, propagation over a queue, the null Activity and where starting traces in the browser stands today.
Version note: The examples in this post were run with .NET 10, OpenTelemetry .NET 1.21, xUnit v3 4.0 and Aspire Dashboard 13.6.5; for the browser side the status of the OpenTelemetry JavaScript packages was checked on npm and in the official documentation, and no Angular code was run.
Guess First
The API of Bookstore, the online bookstore used as the shared example across this site's series, goes to the payment provider four times for one order: three attempts time out, the fourth succeeds. The provider logs the traceparent header of every request. Is the trace id the same in all four lines, or does every attempt open a new trace? And the span id in the middle of the header? Second question: when does ActivitySource.StartActivity("reserve stock") return null? The answers are below, with real output.
The Parts of a Trace
A trace is the whole journey of a request through the system; a span is a single piece of work on that journey: handling an HTTP request, a SQL query, a payment call. Every span has a name, a start time, a duration and a trace id; every span except the root has a parent span, and these parent relationships form the tree. The span kind tells the span's role: Server handles an incoming request, Client makes an outgoing call, Producer puts a message on a queue, Consumer processes a message, Internal is a step inside a process. Attributes are the span's key/value data (http.route, bookstore.order.id), events are timestamped occurrences inside the span (the most common being an exception), and the status says whether the span ended as Unset, Ok or Error. Links connect a span to another span that is not its parent; a batch job processing several messages together is the typical example.
In .NET a span is a System.Diagnostics.Activity, and the tracer is an ActivitySource. The HTTP and SQL spans we saw in earlier posts were produced by ASP.NET Core, HttpClient and SqlClient with these classes. Now we add our own spans to checkout.
Our Own Spans in Checkout with ActivitySource
As with the metrics, we opened one source per module and registered them in the setup with a wildcard:
// One ActivitySource per module, like the Meters. Registered with AddSource("Bookstore.*").
public static class BookstoreActivitySources
{
    public static readonly ActivitySource Ordering = new("Bookstore.Ordering");
    public static readonly ActivitySource Notifications = new("Bookstore.Notifications");
}
One line was added to WithTracing in the setup: .AddSource("Bookstore.*"). In OrderService we wrapped three places in spans: the stock check, the stock reservation and the payment. The first two already contained SQL spans; our own span groups them under a meaningful heading:
using (Activity? check = BookstoreActivitySources.Ordering.StartActivity("check availability"))
{
    check?.SetTag("bookstore.cart.line_count", cart.Items.Count);
    foreach (CartItem item in cart.Items)
    {
        if (await inventory.GetAvailableAsync(item.BookId, ct) < item.Quantity)
        {
            shortIsbns.Add(books[item.BookId].Isbn);
        }
    }
}
The payment span matters more, because all the attempts of the resilience handler gather under it and it carries the error state:
private async Task<PlaceOrderOutcome> AuthorizePaymentAsync(Order order, CancellationToken ct)
{
    // Parent of every HTTP attempt (retries included) that the resilience handler makes.
    using Activity? activity = BookstoreActivitySources.Ordering.StartActivity("authorize payment");
    activity?.SetTag("bookstore.order.id", order.Id);
    try
    {
        await payments.AuthorizeAsync(new PaymentRequest(order.Id, order.Total, order.Currency), ct);
        order.Status = OrderStatus.Paid;
        await db.SaveChangesAsync(ct);
        await confirmations.PublishAsync(order.Id, order.Customer.Email, ct);
        return new PlaceOrderOutcome.Placed(order);
    }
    catch (Exception ex) when (ex is HttpRequestException or TimeoutException or Polly.Timeout.TimeoutRejectedException)
    {
        activity?.AddException(ex);
        activity?.SetStatus(ActivityStatusCode.Error, "Payment could not be authorized");
        logger.LogError(ex, "Payment for order {OrderId} failed", order.Id);
        order.Status = OrderStatus.Cancelled;
        await inventory.ReleaseAsync([.. order.Items.Select(i => new StockLine(i.BookId, i.Quantity))], ct);
        await db.SaveChangesAsync(ct);
        return new PlaceOrderOutcome.PaymentFailed(order.Id);
    }
}
The using matters: the span's duration ends with Dispose. AddException (added in .NET 9) writes the exception onto the span as OpenTelemetry's exception event; the status has to be set separately, recording an exception does not make the span an error by itself. We wrote the order number onto the span as a tag; the high-cardinality data that is forbidden in a metric is exactly in place in a trace. We sent the application to the standalone Aspire Dashboard and ran traffic of 40 orders. Then we opened the traces of the slowest successful order and of a failed one:
      0.0    5106.1  POST /api/orders/
      0.2       0.4    SELECT [c].[Id] [c].[CreatedAtUtc] [c].[UpdatedAtUtc] [ordering].[Carts] [ordering].[CartItems]
      0.7       0.4    SELECT [catalog].[Books]
      1.0       0.8    check availability
      1.1       0.3      SELECT [inventory].[StockItems]
      1.4       0.4      SELECT [inventory].[StockItems]
      2.1       0.7    reserve stock
      2.1       0.4      UPDATE
      2.5       0.3      UPDATE
      2.8       0.3    SELECT [ordering].[Customers]
      3.3       0.3    BookstoreDb
      3.6       0.4    DELETE
      4.1       0.5    DELETE
      5.7    5100.1    authorize payment
      5.7    2002.8      POST ERROR
   2513.1    2002.4      POST ERROR
   5018.8      80.5      POST
   5100.4       5.2      UPDATE
   5105.8       0.0      order-confirmations publish
   5105.9      49.1        order-confirmations process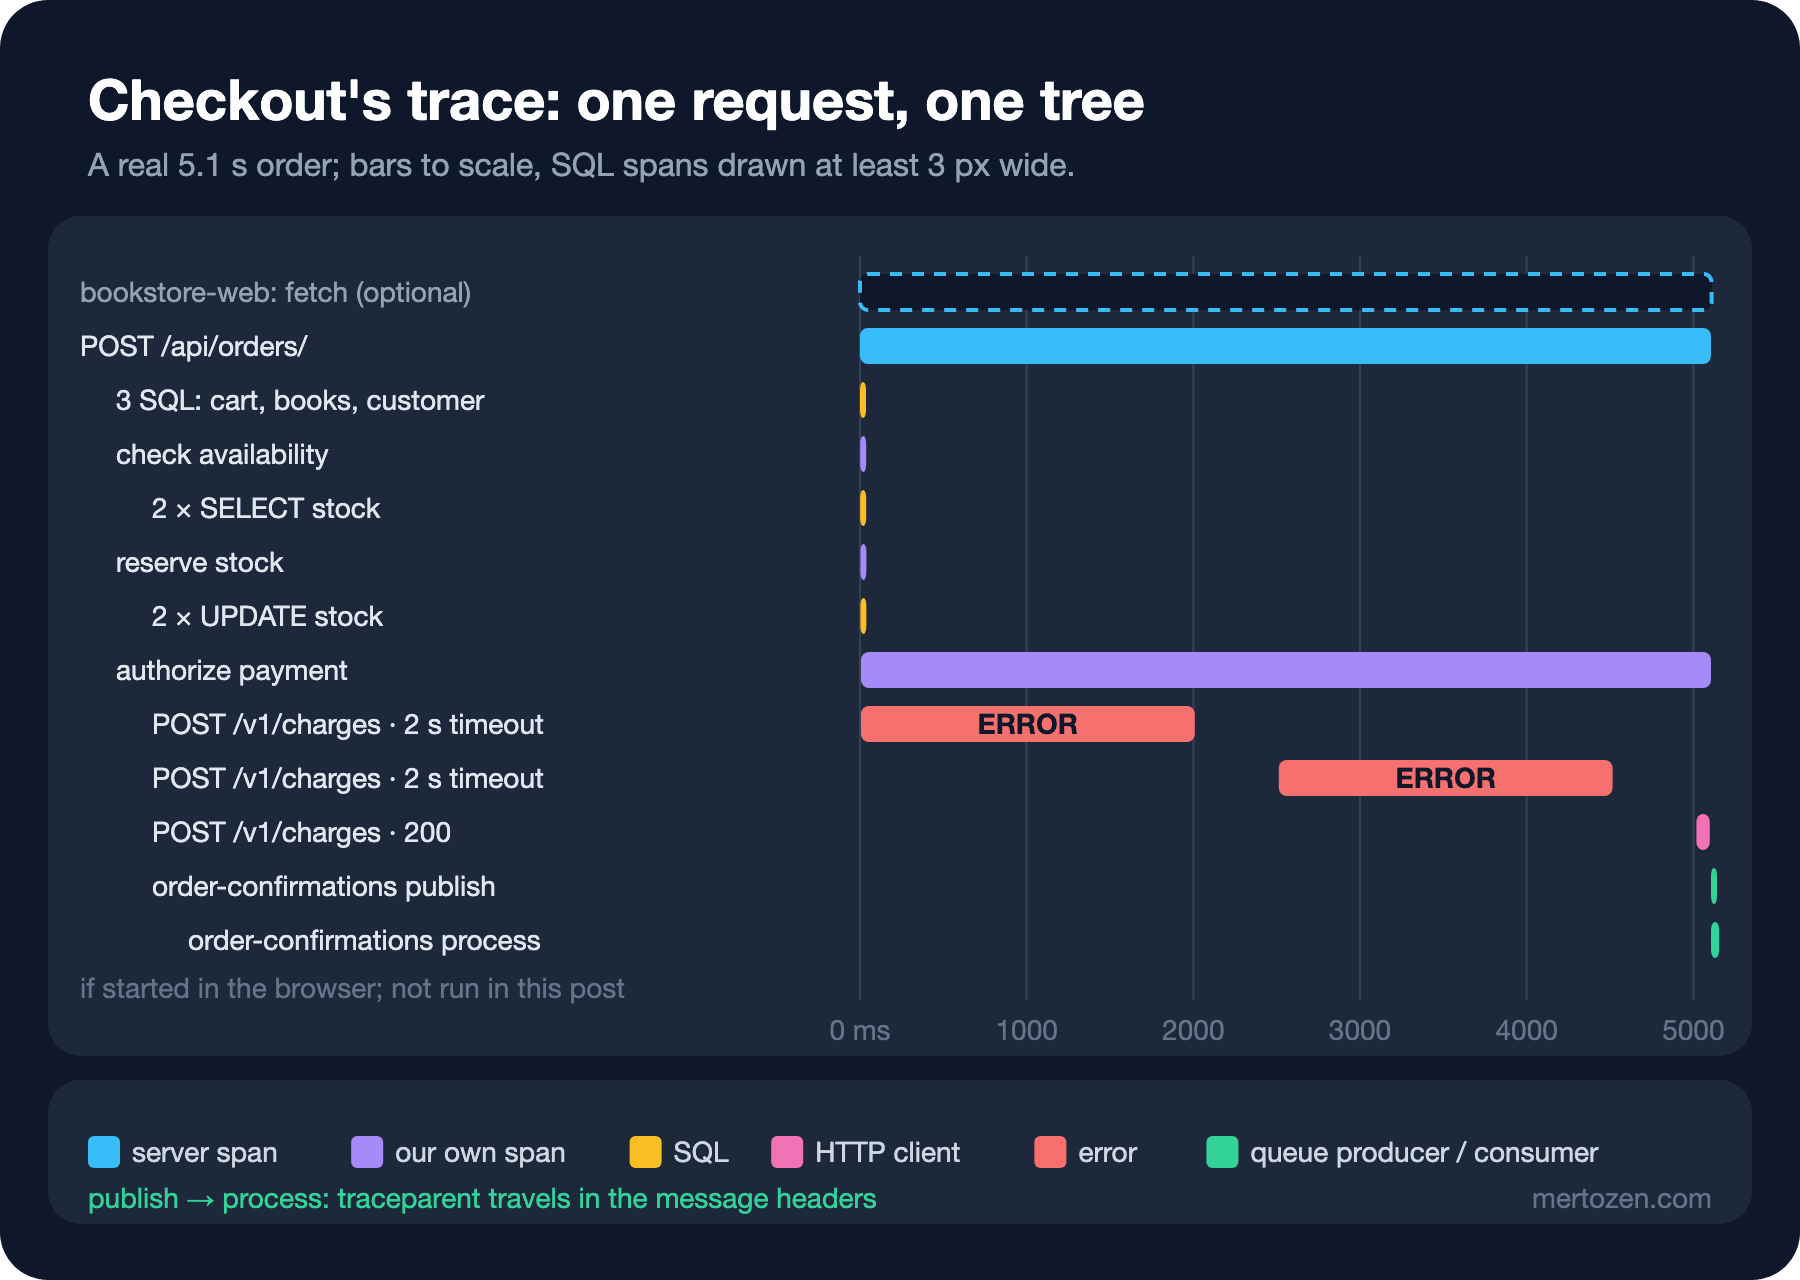
The tree now reads in business terms: "authorize payment" took 5.1 seconds and two of the three attempts inside it failed. In the trace of the order where all four attempts timed out, both the root span and the payment span are errors:
      0.0    9541.5  POST /api/orders/ ERROR
      8.2    9528.0    authorize payment ERROR
      8.3    2001.7      POST ERROR
   2512.1    2002.4      POST ERROR
   5018.0    2000.9      POST ERROR
   7522.8    2000.7      POST ERROR

authorize payment  status: Error "Payment could not be authorized"  bookstore.order.id=1136
  event exception
    exception.type=Polly.Timeout.TimeoutRejectedException
    exception.message=The operation didn't complete within the allowed timeout of '00:00:02'.
The error on the root span doesn't come from us: the ASP.NET Core instrumentation marks the server span of every request that returns 5xx as an error (http.response.status_code=502, error.type=502). 4xx responses are not errors on the server side; according to the semantic conventions they are the client's fault.
W3C Trace Context: traceparent
When a span's parent lives in another process, the trace context has to travel over the network. The standard way is W3C Trace Context: the traceparent and tracestate HTTP headers. Level 1 has been a W3C Recommendation since 2021; Level 2 is a Candidate Recommendation draft dated March 2024. The answer to the first question from Guess First is in the fake payment provider's log (an order with four attempts):
18:43:21.785 info: Program[0] order-1172 traceparent=00-ecc0e08609bd750a25ef6b27b6533bcb-055bbb333454c35e-03 baggage=
18:43:23.787 warn: Program[0] order-1172 attempt 1: client gave up after waiting
18:43:24.289 info: Program[0] order-1172 traceparent=00-ecc0e08609bd750a25ef6b27b6533bcb-c2c7e0d18d6225bb-03 baggage=
18:43:26.291 warn: Program[0] order-1172 attempt 2: client gave up after waiting
18:43:26.794 info: Program[0] order-1172 traceparent=00-ecc0e08609bd750a25ef6b27b6533bcb-a60d2b8c3861cbb4-03 baggage=
18:43:28.795 warn: Program[0] order-1172 attempt 3: client gave up after waiting
18:43:29.299 info: Program[0] order-1172 traceparent=00-ecc0e08609bd750a25ef6b27b6533bcb-56e5e946075fe9bc-03 baggage=
18:43:29.352 info: Program[0] order-1172 attempt 4: authorized 249.90 TRY in 53 ms
The header has four parts: the version (00), the 16-byte trace id, the 8-byte parent span id and the flags. The trace id is the same in all four attempts: they are all part of the same trace. The parent span id differs in every attempt, because every attempt is a separate HTTP client span and that span is the parent from the provider's point of view. So if the provider used OpenTelemetry, its spans would land under the right attempt. The last byte is 03: the lowest bit (01) is "sampled", meaning this trace is being recorded; the second bit (02) is Level 2's random flag, saying that at least the rightmost 7 bytes of the trace id were generated randomly. tracestate is for extra vendor-specific data; it is not in our output.
It is worth looking at who does this work. On the HttpClient side the HttpClient instrumentation adds the header without any code; on the ASP.NET Core side it is the framework that reads the parent from the incoming header and makes the server span its child. We verified it with curl: sending a header with the sampled flag, the API's span was recorded as a child of the span id we sent; sending the same header with the -00 flag, no span was recorded at all:
curl -s http://localhost:5080/api/categories -H "traceparent: 00-4bf92f3577b34da6a3ce929d0e0e4736-00f067aa0ba902b7-01"
curl -s http://localhost:5080/api/categories -H "traceparent: 00-5bf92f3577b34da6a3ce929d0e0e4736-00f067aa0ba902b7-00"

4bf92f3577b34da6a3ce929d0e0e4736 GET /api/categories 2ff977c117089b24 parent= 00f067aa0ba902b7
4bf92f3577b34da6a3ce929d0e0e4736 SELECT [catalog].[Categories] 939f307b20abf46d parent= 2ff977c117089b24
The default sampler follows the parent's decision (parent-based). That means the API won't record a request that the client said not to record; we will remember this when we think about starting traces in the browser.
Baggage: What Goes In, What Never Does
Baggage is key/value pairs carried alongside the trace context; W3C has a separate baggage header for it. Unlike the trace id, the value is open to application code: every downstream service can read it and write it onto its own spans. For example "this request came from the mobile app" or "institutional order". .NET has two separate notions of baggage, which is hard to know without trying. We temporarily added two lines to a middleware:
System.Diagnostics.Activity.Current?.AddBaggage("demo.activity", "1");
OpenTelemetry.Baggage.SetBaggage("demo.otel", "2");
The header the fake provider saw:
18:43:56.135 info: Program[0] order-1175 traceparent=00-1307a830f7a794c6dbce4b8f2235be17-2903e8e666e9785d-03 baggage=demo.otel=2Only the value added through OpenTelemetry.Baggage went out; the Activity's own baggage stayed behind. In a .NET application with OpenTelemetry, use OpenTelemetry's API for baggage. What goes into baggage is the more important question. The header travels with every call: to your own services, but also to third parties like the payment provider. Information such as a user id, an e-mail address, a token or an order total must never go into baggage. What can go in is low-sensitivity context that is actually used downstream, and baggage should be stripped from requests to external services.
Propagation over a Queue
For HTTP the framework does the propagation; in a messaging system it is either the messaging library or you. We separated the order confirmation e-mail from checkout: when the payment succeeds a message is written to an in-process Channel, and a background service reads it and sends the e-mail. A real broker (RabbitMQ, Azure Service Bus) is the subject of the Working with Message Queues series; the way the trace context travels is the same there: written into the message's headers.
public async ValueTask PublishAsync(int orderId, string customerEmail, CancellationToken ct)
{
    using Activity? activity = BookstoreActivitySources.Notifications.StartActivity("order-confirmations publish", ActivityKind.Producer);
    activity?.SetTag("messaging.system", "in-process");
    activity?.SetTag("messaging.destination.name", "order-confirmations");
    activity?.SetTag("bookstore.order.id", orderId);

    Dictionary<string, string> headers = [];
    // traceparent (and baggage, if any) go into the message, so the consumer can continue the same trace.
    Propagator.Inject(new PropagationContext(activity?.Context ?? default, Baggage.Current), headers,
        static (carrier, key, value) => carrier[key] = value);

    await channel.Writer.WriteAsync(new OrderConfirmationMessage(orderId, customerEmail, headers), ct);
}
The consumer extracts the context from the headers and opens the new span as its child:
PropagationContext parent = Propagators.DefaultTextMapPropagator.Extract(default, message.Headers,
    static (carrier, key) => carrier.TryGetValue(key, out string? value) ? [value] : []);
Baggage.Current = parent.Baggage;

// The consumer span continues the checkout's trace: its parent is the producer span in the message.
using Activity? activity = BookstoreActivitySources.Notifications.StartActivity(
    "order-confirmations process", ActivityKind.Consumer, parent.ActivityContext);
The last two lines of the trace above are exactly this: order-confirmations process, in the same trace as a child of publish. Had we opened the span in the background service without this context, Activity.Current would have been empty, a new root span and a new trace would have been created, and the link between checkout and the e-mail would be broken. There is a decision here. If a message is the continuation of a single request (our e-mail), parent-child is natural. But if a job processes hundreds of orders together, or a message is processed hours later, picking a single parent is wrong and a trace lasting hours becomes unreadable. In that case the job should open a new root span and add the context of every incoming message as a link. OpenTelemetry's messaging semantic conventions also recommend links by default.
We pinned this behavior down with an integration test. The test listens to the Bookstore.* sources with an ActivityListener, places an order and verifies that the consumer span is in the same trace as the payment span and that its parent is the publish span:
Assert.Equal(payment.TraceId, process.TraceId);
Assert.Equal(publish.SpanId, process.ParentSpanId);
Assert.Equal(ActivityKind.Consumer, process.Kind);
When Nobody Listens: a null Activity
The reason we write activity?.SetTag(...) everywhere is the second question from Guess First. StartActivity returns null when no listener listens to that source, or when the sampler decides not to record the span; that is how creating spans costs almost nothing while telemetry is off. We showed this with a test too:
[Fact]
public void StartActivity_returns_null_when_nobody_listens()
{
    using ActivitySource source = new("Demo.NobodyListens");
    Assert.Null(source.StartActivity("check availability"));

    using ActivityListener listener = new()
    {
        ShouldListenTo = s => s.Name == source.Name,
        Sample = (ref ActivityCreationOptions<ActivityContext> _) => ActivitySamplingResult.AllDataAndRecorded
    };
    ActivitySource.AddActivityListener(listener);

    using Activity? activity = source.StartActivity("check availability");
    Assert.NotNull(activity);
}
In the first version of the test the source was named Bookstore.TracingDemo, and the first Assert.Null failed: Assert.Null() Failure: Value is not null. The OpenTelemetry setup of the API started in the same test process was listening to that name too, through AddSource("Bookstore.*"). If you use wildcards, know what your naming rule covers.
The Angular Side: Starting the Trace in the Browser
Right now the trace starts with the API's server span. Starting it in the browser adds the time the user experiences (the network, the page's own work) to the trace. We checked the options as they stand today. OpenTelemetry's JavaScript documentation explicitly marks browser instrumentation as experimental and largely unspecified. The @opentelemetry/instrumentation-fetch package (0.301), which adds traceparent to fetch requests, is marked deprecated in its README and points users to the @opentelemetry/browser-instrumentation package in the new opentelemetry-browser repository; that package is at version 0.11 and ships with "experimental" subpaths. We did not write or run Angular code; leaning on an API in this state in production today means frequent breakage.
If you decide to start traces in the browser, the API side needs two things. The first is CORS: if bookstore-web is served from a different origin than the API, the browser sends the traceparent header only if the server allows it.
// bookstore-web served from another origin: the browser may start the trace, so it must be allowed to send it.
builder.Services.AddCors(options => options.AddPolicy("bookstore-web", policy => policy
    .WithOrigins(builder.Configuration.GetSection("Cors:Origins").Get<string[]>() ?? [])
    .WithMethods("GET", "POST", "PUT", "DELETE")
    .WithHeaders("content-type", "traceparent", "tracestate")));
curl -s -i -X OPTIONS http://localhost:5080/api/orders -H "Origin: http://localhost:4200" -H "Access-Control-Request-Method: POST" -H "Access-Control-Request-Headers: content-type,traceparent,baggage"
HTTP/1.1 204 No Content
Date: Sat, 14 Nov 2026 18:44:49 GMT
Server: Kestrel
Access-Control-Allow-Headers: content-type,traceparent,tracestate
Access-Control-Allow-Methods: GET,POST,PUT,DELETE
Access-Control-Allow-Origin: http://localhost:4200We also asked for baggage in the preflight; the server didn't refuse, it just didn't list it as allowed. The browser makes the decision: it doesn't send a request with a header that is not on the list. The second is sampling: as we saw above, the API won't record a request the browser said not to record; sample 10 percent in the browser and you lose 90 percent of the traces in the API as well. For most teams starting the trace at the API is enough: most duration problems are on the server side, and performance measurement on the browser side (Core Web Vitals) is the subject of the Web Performance series.
In Production
Open spans for meaningful steps, not for every method. A span costs little but not nothing; the real cost is in the backend. Steps that match the questions you will ask during an incident, like "check availability", "reserve stock", "authorize payment", are enough.
Keep span names low-cardinality and put variables in attributes. "authorize payment" is a good name; $"authorize payment {order.Id}" produces a separate name for every order and breaks grouping in the backend.
Don't forget that the trace context also goes out with requests to external services. traceparent is a harmless id, but check what you put into baggage and strip it in external clients if needed.
Make the parent-or-link decision for messaging deliberately. For a single message and short delays a parent gives a readable tree; for batch processing or delayed jobs, use links.
Common Pitfalls
Writing PII into attributes. An order number on a span is fine; the customer's e-mail, name or address is not. Spans are stored with less care than logs and read by a wider team.
Forgetting to set the status. AddException records the exception but doesn't make the span an error; error rates and sampling rules like "keep only failed traces" look at the status.
Losing the context in background work. Task.Run and await carry Activity.Current, but for work read from a queue or a database you have to do it yourself. Otherwise every message starts a new trace or, worse, gets written under a stale Activity.Current left behind somewhere, with the wrong parent.
Forgetting that activity can be null. activity.SetTag throws a NullReferenceException when there is no listener; always use ?..
A Small Experiment
★☆☆ Read the traceparent values that reached the fake provider from its log and open the same order's trace in the dashboard. Match the parent span ids in the headers to the spans they belong to.
★★☆ Turn OrderConfirmationSender into a batch consumer that processes 10 messages together. Instead of a parent, open a root span that adds each message's context as an ActivityLink, and compare how the traces look in the dashboard.
★★★ Add a DelegatingHandler to the typed client in the Payments module that removes the baggage header from requests to the external provider. Verify that the baggage disappears from the fake provider's log but can still be read in checkout's consumer span.
The application now produces rich telemetry and sends all of it straight to a backend. In the next post we put the OpenTelemetry Collector in between: receivers, processors and exporters, keeping only failed and slow traces with tail sampling, filtering unneeded logs, and cleaning up the customer e-mail that shows up in this post's confirmation e-mail log, in the Collector.