

IL and the JIT Compiler: Tiered Compilation, Dynamic PGO, Inlining and Escape Analysis

The JIT does not compile a method once but in tiers: first unoptimized Tier0, then an instrumented copy, finally a Tier1 optimized with the collected profile. With Bookstore code and DOTNET_JitDisasm output we show IL's stack-based form, OSR, Dynamic PGO turning an interface call into direct code behind a type check, bounds check elimination and .NET 10's escape analysis taking a 40-byte allocation down to zero, and compare it with V8's hidden classes and deoptimization.
Version note: The code in this post was built with .NET 10 (SDK 10.0.404, runtime 10.0.15) and verified with xUnit v3 4.0.3 tests; the comparisons use the .NET 9.0.22 runtime, the measurement uses BenchmarkDotNet 0.15.8 and the JavaScript examples use Node.js 26 (V8 14.6). Decompiler output comes from ilspycmd 11.2, assembly output was captured on x64 Linux.
Guess First
The front end of the filter language we write for Bookstore, the online bookstore used as the shared example across this site's series, was finished in post 04: text became tokens, tokens became a tree, the tree became a verified bound tree and that became a delegate. In this post we look at how that delegate, and every C# method in general, turns into machine code. The example is a small method that counts the catalog against a rule:
public interface IBookRule
{
    bool Matches(Book book);
}

public sealed class InStock : IBookRule
{
    public bool Matches(Book book) => book.Stock > 0;
}

public sealed class PublishedBefore(int year) : IBookRule
{
    public bool Matches(Book book) => book.Year < year;
}

// interface call: the JIT does not know which class is behind 'rule'
[MethodImpl(MethodImplOptions.NoInlining)]
public static int CountMatches(Book[] books, IBookRule rule)
{
    int count = 0;
    foreach (Book book in books)
    {
        if (rule.Matches(book))
            count++;
    }
    return count;
}

// a small array that never leaves the method
[MethodImpl(MethodImplOptions.NoInlining)]
public static int ShippingDays(int quantity)
{
    int[] limits = [1, 5, 20];
    int days = 1;
    foreach (int limit in limits)
    {
        if (quantity > limit)
            days++;
    }
    return days;
}
First question: CountMatches is called thousands of times, mostly with InStock. After the app has been running for a while, is rule.Matches(book) still an interface call in this method's machine code?
Second question: how many bytes does each call to ShippingDays allocate on the heap for limits? Is the answer the same on .NET 9 and .NET 10?
NoInlining is only there for observation: we want to see each method's machine code on its own.
IL: A Stack-Based Intermediate Language
Roslyn does not compile these methods to machine code but to IL. Let's write two different counting loops; we will need both later in the post:
// i < books.Length: the JIT can prove every index is valid
[MethodImpl(MethodImplOptions.NoInlining)]
public static int CountInStock(Book[] books)
{
    int count = 0;
    for (int i = 0; i < books.Length; i++)
    {
        if (books[i].Stock > 0)
            count++;
    }
    return count;
}

// i < take: nothing tells the JIT that take <= books.Length
[MethodImpl(MethodImplOptions.NoInlining)]
public static int CountInStock(Book[] books, int take)
{
    int count = 0;
    for (int i = 0; i < take; i++)
    {
        if (books[i].Stock > 0)
            count++;
    }
    return count;
}
Let's look at the IL of the first one with ilspycmd, the command-line version of the ILSpy decompiler:
$ ilspycmd -il -t Bookstore.JitLab.Lab samples/JitLab/bin/Release/net10.0/JitLab.dll
...
    int32 CountInStock (
    class [Bookstore.Filter]Bookstore.Catalog.Book[] books
) cil managed noinlining
{
// Method begins at RVA 0x2450
// Header size: 12
// Code size: 33 (0x21)
.maxstack 2
.locals init (
    [0] int32,
    [1] int32
)

IL_0000: ldc.i4.0
IL_0001: stloc.0
IL_0002: ldc.i4.0
IL_0003: stloc.1
IL_0004: br.s IL_0019
// loop start (head: IL_0019)
    IL_0006: ldarg.0
    IL_0007: ldloc.1
    IL_0008: ldelem.ref
    IL_0009: callvirt instance int32 [Bookstore.Filter]Bookstore.Catalog.Book::get_Stock()
    IL_000e: ldc.i4.0
    IL_000f: ble.s IL_0015

    IL_0011: ldloc.0
    IL_0012: ldc.i4.1
    IL_0013: add
    IL_0014: stloc.0

    IL_0015: ldloc.1
    IL_0016: ldc.i4.1
    IL_0017: add
    IL_0018: stloc.1

    IL_0019: ldloc.1
    IL_001a: ldarg.0
    IL_001b: ldlen
    IL_001c: conv.i4
    IL_001d: blt.s IL_0006
// end loop

IL_001f: ldloc.0
IL_0020: ret
} // end of method Lab::CountInStock
IL has no registers. Every instruction pushes values onto, or pops them from, a stack called the evaluation stack. Reading from IL_0006: ldarg.0 pushes the array, ldloc.1 pushes i; ldelem.ref pops both and pushes books[i]; callvirt pops that and pushes Stock; ldc.i4.0 pushes zero and ble.s compares the top two values and branches. This form is portable: the number of registers and which value goes into which register are none of IL's business; the JIT makes those decisions on each platform.
IL sits on disk but is never executed as it is. When a method is called for the first time, its entry point still points to a stub; the stub calls the JIT, the JIT produces machine code and the entry point is redirected to the new code. Later calls go straight to the machine code. In post 01 we saw 1,500 calls correspond to three compilations; now let's look at those compilations.
Tiered Compilation: One Method, Several Compilations
For the experiment we write a method that is called once but runs for a long time; it calls both CountInStock overloads:
static void Tiers(Book[] books)
{
    int total = 0;
    // a single long-running loop in a method that is called only once
    for (int i = 0; i < 2_000_000; i++)
        total += Lab.CountInStock(books) + Lab.CountInStock(books, 3);
    Console.WriteLine($"total: {total}");
}
$ dotnet build -c Release samples/JitLab
$ DOTNET_JitStdOutFile=jit.txt DOTNET_JitDisasmSummary=1 dotnet samples/JitLab/bin/Release/net10.0/JitLab.dll tiers
total: 14000000
$ grep -E 'Lab:|Tiers' jit.txt
8: JIT compiled Program:<<Main>$>g__Tiers|0_0(Bookstore.Catalog.Book[]) [Instrumented Tier0, IL size=77, code size=241]
9: JIT compiled Bookstore.JitLab.Lab:CountInStock(Bookstore.Catalog.Book[]) [Instrumented Tier0, IL size=33, code size=195]
11: JIT compiled Bookstore.JitLab.Lab:CountInStock(Bookstore.Catalog.Book[],int) [Instrumented Tier0, IL size=31, code size=194]
12: JIT compiled Program:<<Main>$>g__Tiers|0_0(Bookstore.Catalog.Book[]) [Tier1-OSR @0x1b with Synthesized PGO, IL size=77, code size=1794]
14: JIT compiled Bookstore.JitLab.Lab:CountInStock(Bookstore.Catalog.Book[]) [Instrumented Tier0, IL size=33, code size=195]
15: JIT compiled Bookstore.JitLab.Lab:CountInStock(Bookstore.Catalog.Book[],int) [Instrumented Tier0, IL size=31, code size=194]
17: JIT compiled Bookstore.JitLab.Lab:CountInStock(Bookstore.Catalog.Book[]) [Tier1 with Dynamic PGO, IL size=33, code size=53]
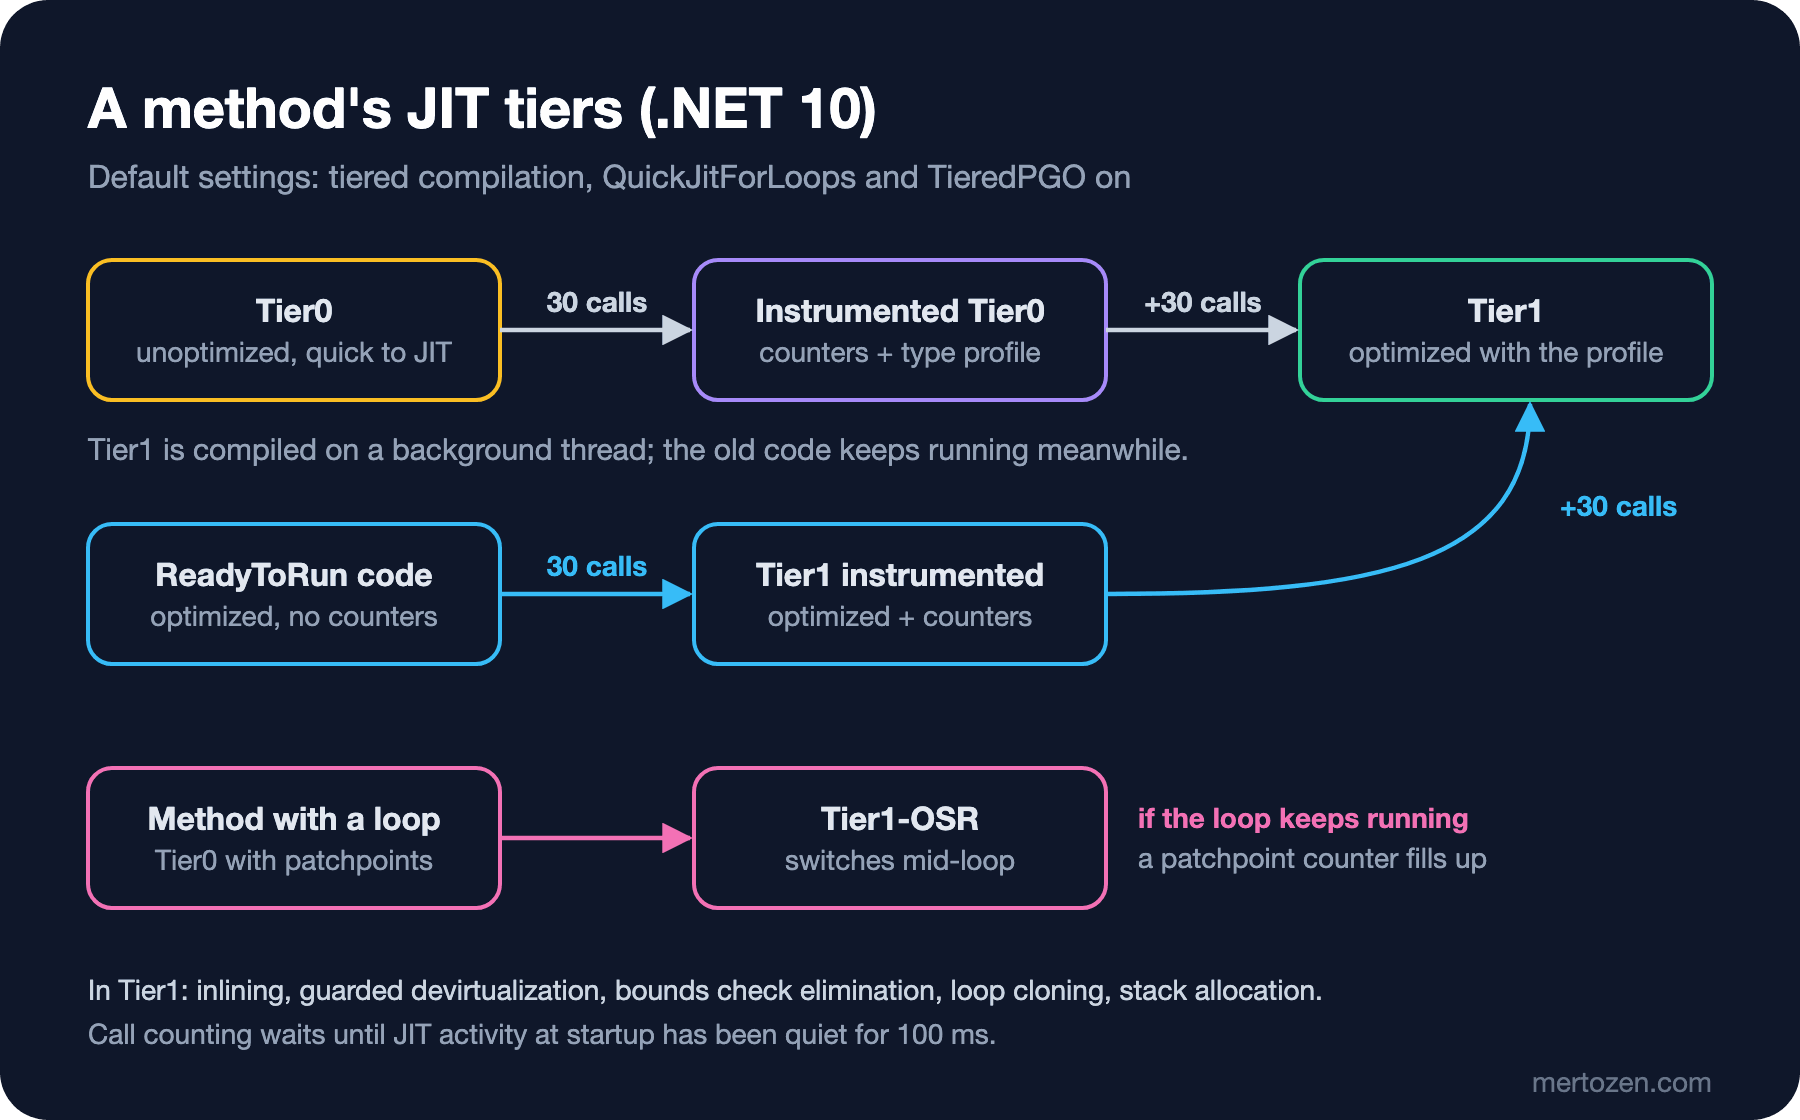
18: JIT compiled Bookstore.JitLab.Lab:CountInStock(Bookstore.Catalog.Book[],int) [Tier1 with Synthesized PGO, IL size=31, code size=81]The idea of tiered compilation is simple: compile every method quickly and without optimization first (Tier0), then recompile the ones that really run often, optimized, in the background (Tier1). That way startup does not spend time optimizing thousands of methods that will never run often. According to the defaults in the runtime's source code, a method counts as frequently used after 30 calls, and that counting starts only once JIT activity at startup has been quiet for 100 ms.
Dynamic PGO has been on by default since .NET 8 and adds a tier in between: IsCheap in post 01 went through Tier0, Instrumented Tier0 and Tier1. Instrumented Tier0 is an unoptimized copy with counters added; it records how often each branch is taken and which classes arrive behind an interface call. Tier1 is compiled with that profile (with Dynamic PGO).
Our output is different because all three methods contain loops. For the first compilation of a method with loops, the runtime tells the JIT to add counters if there is a loop. Tiers is called only once and will never reach 30 calls; this is where OSR, on-stack replacement, comes in. Tier0 code puts counting points called patchpoints at loop heads; when a counter fills up, the JIT compiles a version of the method that covers only what comes after the loop head and moves the running frame onto the new code. @0x1b is the IL offset where the switch happens, the loop head. Methods with loops are instrumented from the start so that the OSR code can also be compiled with a profile.
That is also why CountInStock shows up twice as Instrumented Tier0: the runtime still considers the first compilation an ordinary Tier0 and, after 30 calls, produces its instrumented copy like for any other method. Tier1 compilations happen on a background thread; meanwhile the app keeps running the old code.
QuickJitForLoops: The Docs or the Runtime?
The compilation settings page on Microsoft Learn says that quick JIT (Tier0) for methods with loops is off when the setting is omitted. The output above shows it is on. The runtime itself settles which is right: in clrconfigvalues.h on the .NET 10 branch, the default of TC_QuickJitForLoops is 1 on platforms that support OSR and 0 on those that do not. switches.h enables OSR for 64-bit targets, so on x64 and Arm64 methods with loops start at Tier0 as well. Turning the setting off makes the difference clear:
$ DOTNET_TC_QuickJitForLoops=0 DOTNET_JitStdOutFile=jit.txt DOTNET_JitDisasmSummary=1 dotnet samples/JitLab/bin/Release/net10.0/JitLab.dll tiers
total: 14000000
$ grep -E 'Lab:|Tiers' jit.txt
   8: JIT compiled Program:<<Main>$>g__Tiers|0_0(Bookstore.Catalog.Book[]) [Tier-0 switched to FullOpts, IL size=77, code size=398]
   9: JIT compiled Bookstore.JitLab.Lab:CountInStock(Bookstore.Catalog.Book[]) [Tier-0 switched to FullOpts, IL size=33, code size=55]
  10: JIT compiled Bookstore.JitLab.Lab:CountInStock(Bookstore.Catalog.Book[],int) [Tier-0 switched to FullOpts, IL size=31, code size=89]
All three methods are fully optimized in one go, without a profile, and are never compiled again; that is also the default behaviour on 32-bit platforms without OSR. When the docs and the runtime disagree, the runtime's source code and your own measurement decide.
Dynamic PGO and Guarded Devirtualization
Back to the first guess. The pgo command calls CountMatches with InStock nine times out of ten and with PublishedBefore once:
static void Pgo(Book[] books)
{
    IBookRule inStock = new InStock();
    IBookRule old = new PublishedBefore(1900);
    int total = 0;
    for (int round = 0; round < 50; round++)
    {
        // 9 calls out of 10 go to InStock
        for (int i = 0; i < 1_000; i++)
            total += Lab.CountMatches(books, i % 10 == 0 ? old : inStock);
        Thread.Sleep(10);
    }
    Console.WriteLine($"total: {total}");
}
DOTNET_JitDisasm prints the machine code of the named method; DOTNET_JitDisasmOnlyOptimized=1 shows only the optimized version and DOTNET_JitDisasmDiffable=1 replaces addresses with a fixed value (0xD1FFAB1E). I shortened the prolog, the epilog and some of the header lines:
$ DOTNET_JitDisasm=CountMatches DOTNET_JitDisasmOnlyOptimized=1 DOTNET_JitDisasmDiffable=1 dotnet samples/JitLab/bin/Release/net10.0/JitLab.dll pgo
total: 245000
; Assembly listing for method Bookstore.JitLab.Lab:CountMatches(Bookstore.Catalog.Book[],Bookstore.JitLab.IBookRule):int (Tier1)
; optimized using Dynamic PGO

...
G_M000_IG04:
       mov      rsi, gword ptr [r13]
       mov      rdi, 0xD1FFAB1E
       cmp      qword ptr [rbx], rdi
       jne      SHORT G_M000_IG10
G_M000_IG05:
       cmp      dword ptr [rsi+0x24], 0
       jle      SHORT G_M000_IG07
G_M000_IG06:
       inc      r15d
G_M000_IG07:
       add      r13, 8
       dec      r14d
       jne      SHORT G_M000_IG04
...
G_M000_IG10:
       mov      rdi, rbx
       mov      r11, 0xD1FFAB1E
       call     [r11]Bookstore.JitLab.IBookRule:Matches(Bookstore.Catalog.Book):bool:this
       test     eax, eax
       je       SHORT G_M000_IG07
       jmp      SHORT G_M000_IG06
; Total bytes of code 103
The answer: there is no interface call on the hot path of the loop. cmp qword ptr [rbx], rdi compares the type of the rule object with the type of InStock. If they are equal, the body of InStock.Matches runs directly: cmp dword ptr [rsi+0x24], 0 is book.Stock > 0 itself. Both Matches and Stock were inlined. If the type differs, the real interface call in G_M000_IG10 is made. This is called guarded devirtualization: the profile said "this is almost always InStock", and the JIT turned the virtual call into direct code, protecting that guess with a type check.
Running the same program with Dynamic PGO off gives an interface call on every iteration:
$ DOTNET_TieredPGO=0 DOTNET_JitDisasm=CountMatches DOTNET_JitDisasmOnlyOptimized=1 DOTNET_JitDisasmDiffable=1 dotnet samples/JitLab/bin/Release/net10.0/JitLab.dll pgo
total: 245000
; Assembly listing for method Bookstore.JitLab.Lab:CountMatches(Bookstore.Catalog.Book[],Bookstore.JitLab.IBookRule):int (Tier1)
; No PGO data

...
G_M000_IG04:
       mov      rsi, gword ptr [r13]
       mov      rdi, rbx
       mov      r11, 0xD1FFAB1E
       call     [r11]Bookstore.JitLab.IBookRule:Matches(Bookstore.Catalog.Book):bool:this
       test     eax, eax
       je       SHORT G_M000_IG06
G_M000_IG05:
       inc      r15d
G_M000_IG06:
       add      r13, 8
       dec      r14d
       jne      SHORT G_M000_IG04
...
; Total bytes of code 80
I measured the cost of the difference with BenchmarkDotNet; the same benchmark runs in two jobs, one of them with DOTNET_TieredPGO=0. The benchmark counts the InStock rule over an array of 1,000 books. I removed the header lines that contain machine details; absolute times depend on the machine:
$ dotnet run -c Release --project benchmarks/Bookstore.Filter.Benchmarks -- --filter '*RuleBenchmarks*'
...
| Method       | Job     | EnvironmentVariables | Mean       | Error    | StdDev   |
|------------- |-------- |--------------------- |-----------:|---------:|---------:|
| CountMatches | PGO off | DOTNET_TieredPGO=0   | 1,085.0 ns | 21.27 ns | 38.89 ns |
| CountMatches | PGO on  | Empty                |   369.0 ns |  7.38 ns | 10.10 ns |
With PGO on it is about three times faster. Most of the gain does not come from the call itself but from what devirtualization makes possible: once the body is visible at the call site, the JIT can inline it and optimize the inlined code together with its surroundings. When I ran the experiment several times, once I saw the JIT move the type check out of the loop; since the profile is collected depending on timing, the shape of the Tier1 code can change from run to run.
Inlining, Bounds Checks and Loop Cloning
In C#, books[i] checks on every access whether the index is within the array's bounds; if not, an IndexOutOfRangeException is thrown. The JIT removes the check wherever it can prove it is unnecessary. The Tier1 code of the first CountInStock:
; Assembly listing for method Bookstore.JitLab.Lab:CountInStock(Bookstore.Catalog.Book[]):int (Tier1)
; optimized using Dynamic PGO

G_M000_IG01:
       push     rbp
       mov      rbp, rsp
G_M000_IG02:
       xor      eax, eax
       mov      ecx, dword ptr [rdi+0x08]
       test     ecx, ecx
       jle      SHORT G_M000_IG07
G_M000_IG03:
       add      rdi, 16
       align    [15 bytes for IG04]
G_M000_IG04:
       mov      rdx, gword ptr [rdi]
       cmp      dword ptr [rdx+0x24], 0
       jle      SHORT G_M000_IG06
G_M000_IG05:
       inc      eax
G_M000_IG06:
       add      rdi, 8
       dec      ecx
       jne      SHORT G_M000_IG04
G_M000_IG07:
       pop      rbp
       ret
; Total bytes of code 53
There is no call and no bounds check. Because the condition i < books.Length guarantees that every index is valid, the JIT removed the check; it does not even keep the index but advances a pointer by 8 bytes and counts the remaining elements down with dec ecx. The get_Stock call is gone too; small methods are inlined by default and reading the property becomes a single cmp instruction.
In the second version the bound is take; the JIT cannot know that take does not exceed the length of the array:
; Assembly listing for method Bookstore.JitLab.Lab:CountInStock(Bookstore.Catalog.Book[],int):int (Tier1)
; optimized using Synthesized PGO

G_M000_IG01:
       push     rbp
       mov      rbp, rsp
G_M000_IG02:
       xor      eax, eax
       xor      ecx, ecx
       test     esi, esi
       jle      SHORT G_M000_IG09
G_M000_IG03:
       test     rdi, rdi
       je       SHORT G_M000_IG12
G_M000_IG04:
       cmp      dword ptr [rdi+0x08], esi
       jl       SHORT G_M000_IG12
G_M000_IG05:
       add      rdi, 16
G_M000_IG06:
       mov      rcx, gword ptr [rdi]
       cmp      dword ptr [rcx+0x24], 0
       jle      SHORT G_M000_IG08
G_M000_IG07:
       inc      eax
G_M000_IG08:
       add      rdi, 8
       dec      esi
       jne      SHORT G_M000_IG06
G_M000_IG09:
       pop      rbp
       ret
G_M000_IG10:
       inc      eax
G_M000_IG11:
       inc      ecx
       cmp      ecx, esi
       jge      SHORT G_M000_IG09
G_M000_IG12:
       cmp      ecx, dword ptr [rdi+0x08]
       jae      SHORT G_M000_IG13
       mov      edx, ecx
       mov      rdx, gword ptr [rdi+8*rdx+0x10]
       cmp      dword ptr [rdx+0x24], 0
       jle      SHORT G_M000_IG11
       jmp      SHORT G_M000_IG10
G_M000_IG13:
       call     CORINFO_HELP_RNGCHKFAIL
       int3
; Total bytes of code 81
Here the JIT performs loop cloning: there are two copies of the loop. It checks once before the loop; if the array is not null and its length is not smaller than take, it enters the fast copy without checks (G_M000_IG06). Otherwise the slow copy (G_M000_IG12) runs, which checks the bound on every iteration with cmp ecx, dword ptr [rdi+0x08] and throws through CORINFO_HELP_RNGCHKFAIL when the bound is exceeded. The meaning does not change: one of the tests verifies that the exception still comes when take is larger than the array.
.NET 10: Escape Analysis and Stack Allocation
For the second guess, let's put two more methods next to ShippingDays:
// a lambda that captures 'limit': closure object + delegate
[MethodImpl(MethodImplOptions.NoInlining)]
public static int CountCheaperThan(Book[] books, decimal limit)
{
    Func<Book, bool> cheap = book => book.Price < limit;
    int count = 0;
    foreach (Book book in books)
    {
        if (cheap(book))
            count++;
    }
    return count;
}

// an array seen through IEnumerable<Book>: foreach asks for an enumerator object
[MethodImpl(MethodImplOptions.NoInlining)]
public static int CountInStockSeq(Book[] books)
{
    IEnumerable<Book> sequence = books;
    int count = 0;
    foreach (Book book in sequence)
    {
        if (book.Stock > 0)
            count++;
    }
    return count;
}
The alloc command first runs every method enough to reach Tier1, then measures the bytes that 10,000 calls make the thread allocate with GC.GetAllocatedBytesForCurrentThread:
static void Measure(string name, Func<int> action)
{
    const int calls = 10_000;
    long before = GC.GetAllocatedBytesForCurrentThread();
    for (int i = 0; i < calls; i++)
        action();
    long perCall = (GC.GetAllocatedBytesForCurrentThread() - before) / calls;
    Console.WriteLine(string.Create(CultureInfo.InvariantCulture, $"{name,-18} {perCall,4} bytes/call"));
}
The project targets both net10.0 and net9.0; on a machine with the .NET 9 runtime installed you can run the same code on both runtimes:
$ dotnet run -c Release --project samples/JitLab -f net9.0 -- alloc
.NET 9.0.22
ShippingDays         40 bytes/call
CountCheaperThan     96 bytes/call
CountInStockSeq      32 bytes/call
$ dotnet run -c Release --project samples/JitLab -f net10.0 -- alloc
.NET 10.0.15
ShippingDays          0 bytes/call
CountCheaperThan     32 bytes/call
CountInStockSeq       0 bytes/call
The answer to the second guess: on .NET 9 every call allocates 40 bytes (three int values plus the object header and the length field), on .NET 10 zero. The code and the IL are the same; the JIT is what changed. .NET 10's escape analysis sees that limits never leaves the method: it is not returned, not written to a field and not passed to a method that is not inlined. Such an object can be created in the method's stack frame instead of on the heap. The machine code shows this too:
$ DOTNET_JitDisasm=ShippingDays DOTNET_JitDisasmOnlyOptimized=1 DOTNET_JitDisasmDiffable=1 dotnet samples/JitLab/bin/Release/net9.0/JitLab.dll alloc
...
; Assembly listing for method Bookstore.JitLab.Lab:ShippingDays(int):int (Tier1)
...
G_M000_IG02:
       mov      rdi, 0xD1FFAB1E
       mov      esi, 3
       call     CORINFO_HELP_NEWARR_1_VC
       mov      rcx, 0xD1FFAB1E
       mov      rdx, qword ptr [rcx]
       mov      qword ptr [rax+0x10], rdx
       mov      edx, dword ptr [rcx+0x08]
       mov      dword ptr [rax+0x18], edx
       mov      ecx, 1
       add      rax, 16
       mov      edx, 3
       align    [0 bytes for IG03]
...
; Total bytes of code 90
$ DOTNET_JitDisasm=ShippingDays DOTNET_JitDisasmOnlyOptimized=1 DOTNET_JitDisasmDiffable=1 dotnet samples/JitLab/bin/Release/net10.0/JitLab.dll alloc
...
; Assembly listing for method Bookstore.JitLab.Lab:ShippingDays(int):int (Tier1)
...
G_M000_IG02:
       mov      rax, 0xD1FFAB1E
       mov      qword ptr [rbp-0x20], rax
       lea      rax, [rbp-0x20]
       mov      dword ptr [rax+0x08], 3
       lea      rax, [rbp-0x20]
       mov      rcx, 0xD1FFAB1E
       mov      rdx, qword ptr [rcx]
       mov      qword ptr [rax+0x10], rdx
       mov      edx, dword ptr [rcx+0x08]
       mov      dword ptr [rax+0x18], edx
       mov      ecx, 1
       add      rax, 16
       mov      edx, 3
       align    [10 bytes for IG03]
...
; Total bytes of code 118
.NET 9 calls the CORINFO_HELP_NEWARR_1_VC helper, which allocates the array on the heap. .NET 10 writes the same array's header and length (3) into its own stack frame at [rbp-0x20]; the GC never even hears about it. The code grew by 28 bytes, but every call has one allocation less, and the GC has less work later.
In CountCheaperThan, the part that went from 96 bytes down to 32 is the delegate. For the lambda, the C# compiler produces a closure class that holds limit and a Func<Book, bool> that points to its method. .NET 10 moves the delegate that does not escape to the stack; the closure object is still on the heap. Microsoft's page on what's new in the .NET 10 runtime says stack allocation of closures is left for future releases.
CountInStockSeq shows .NET 10's array interface devirtualization. On .NET 9, walking an array as IEnumerable<Book> means interface calls for every element and an enumerator on the heap:
$ DOTNET_JitDisasm=CountInStockSeq DOTNET_JitDisasmOnlyOptimized=1 DOTNET_JitDisasmDiffable=1 DOTNET_JitStdOutFile=seq-net9.txt dotnet samples/JitLab/bin/Release/net9.0/JitLab.dll alloc > /dev/null
$ DOTNET_JitDisasm=CountInStockSeq DOTNET_JitDisasmOnlyOptimized=1 DOTNET_JitDisasmDiffable=1 DOTNET_JitStdOutFile=seq-net10.txt dotnet samples/JitLab/bin/Release/net10.0/JitLab.dll alloc > /dev/null
$ grep -E 'call|Total' seq-net9.txt
       call     [r11]System.Collections.Generic.IEnumerable`1[System.__Canon]:GetEnumerator():System.Collections.Generic.IEnumerator`1[System.__Canon]:this
       call     [System.ThrowHelper:ThrowInvalidOperationException_EnumCurrent(int)]
       call     [r11]System.Collections.IEnumerator:MoveNext():ubyte:this
       call     [r11]System.Collections.Generic.IEnumerator`1[System.__Canon]:get_Current():System.__Canon:this
       call     CORINFO_HELP_RNGCHKFAIL
       call     [r11]System.IDisposable:Dispose():this
       call     [r11]System.IDisposable:Dispose():this
; Total bytes of code 275
$ grep -E 'call|Total' seq-net10.txt
       call     [System.ThrowHelper:ThrowInvalidOperationException_EnumCurrent(int)]
; Total bytes of code 52
The GetEnumerator, MoveNext, get_Current and Dispose calls in .NET 9's 275 bytes of code are gone in .NET 10; the JIT devirtualizes and inlines the array's enumerator, moves the enumerator object to the stack, and the result is a plain 52-byte array loop. The only remaining call is an error path that never runs.
Stack allocation only happens for small objects whose size is known at compile time (the default of JitObjectStackAllocationSize is 528 bytes). If the object is returned, written to a field or passed to a method that is not inlined, it goes back to the heap. Do not shape your code around this optimization; the JIT applies it where it can.
The Same Ideas in V8: Hidden Classes and Deoptimization
V8, the JavaScript engine of Chrome and Node.js, solves the same problem without type information. As we saw in post 01, code starts in the Ignition interpreter and then climbs to the Sparkplug, Maglev and TurboFan tiers. What the optimizing tiers rely on is the shape of objects. V8 gives the same hidden class (called a "map" inside V8) to objects that get the same properties in the same order:
// Run with: node --allow-natives-syntax shapes.js
const dune = { title: "Dune", price: 349.9 };
const emma = { title: "Emma", price: 199 };
const hobbit = { price: 289.5, title: "The Hobbit" };

console.log("dune/emma same hidden class:", %HaveSameMap(dune, emma));
console.log("dune/hobbit same hidden class:", %HaveSameMap(dune, hobbit));
$ node --allow-natives-syntax samples/v8-tiers/shapes.js
dune/emma same hidden class: true
dune/hobbit same hidden class: false%HaveSameMap is an internal V8 function enabled only by --allow-natives-syntax; it is not for production code. The fields are the same but the order differs, so hobbit has a different shape. The optimizing compiler produces code that reads price from a fixed offset, assuming "book always came with this map", and protects that assumption with a map check; very much like .NET's guarded devirtualization. The difference is what happens when the check fails:
function totalPrice(books) {
  let total = 0;
  for (const book of books) total += book.price;
  return total;
}

const books = [
  { title: "Dune", price: 349.9 },
  { title: "Emma", price: 199 },
  { title: "The Hobbit", price: 289.5 },
];

let sum = 0;
for (let i = 0; i < 100_000; i++) sum += totalPrice(books);

// a book from another source: same fields, different order -> another hidden class
books.push({ price: 310, title: "Middlemarch" });
sum += totalPrice(books);
console.log(`sum: ${sum.toFixed(1)}`);
$ node --trace-deopt samples/v8-tiers/deopt.js 2>&1 | grep -E 'totalPrice|sum'
[bailout (kind: deopt-eager, reason: wrong map): begin. deoptimizing 0x24520daab141 <JSFunction totalPrice (sfi = 0x24520daa8249)>, 0x2ac1f3e41e71 <Code MAGLEV>, opt id 2, bytecode offset 52, deopt exit 11, FP to SP delta 48, caller SP 0x00016baa5150, pc 0x0001226809b0]
sum: 83841148.4reason: wrong map: the totalPrice compiled by Maglev saw an object of an unexpected shape, was discarded and the function went back to the interpreter. This is called deoptimization. .NET has no such mechanism: the slow path of guarded devirtualization sits inside the same machine code, and the code is not discarded when the guess misses. Because types are known at compile time in C#, the only thing the JIT guesses is "which subtype"; the question "is this value really a number" never comes up.
Production Notes
The first seconds of the app pay the price of tiered compilation: a freshly started API serves its first requests with Tier0 code. That is one reason a new instance behind a load balancer is slow on its first requests when it gets full traffic right away. Ways to start with ready-made machine code, ReadyToRun and Native AOT, are the topic of the next post.
In a container with a CPU limit of 1 or less, the runtime sees a single processor and multiplies the 100 ms call counting delay by 10 (TC_DelaySingleProcMultiplier). Tier transitions are delayed by about a second, and the background Tier1 compilations share the same CPU with the app; this is one reason services with small limits take long to warm up.
Do not touch settings such as DOTNET_TieredPGO=0 or TieredCompilation=false without a measurement that justifies it. In the benchmark above, turning PGO off meant a threefold slowdown. The DOTNET_JitDisasm family also works on the Release runtime but writes to stdout; use it on a local copy of the same build, not in production. Watching JIT statistics in production is a topic of the Profiling and Diagnostics in .NET series.
Common Pitfalls
Measuring without warm-up. If you measure the first few rounds with Stopwatch, you measure Tier0 code. The warmup command measures the same CountMatches call for eight rounds:
$ dotnet run -c Release --project samples/JitLab -f net10.0 -- warmup
round 1:      208 us
round 2:      287 us
round 3:      237 us
round 4:      232 us
round 5:     5300 us
round 6:       16 us
round 7:       18 us
round 8:       33 us
The first four rounds run Tier0 and instrumented code, from the sixth round on it is Tier1: the same work becomes more than ten times faster, and the round in which the switch happens is clearly slower. BenchmarkDotNet does the warm-up rounds itself and reports the result with statistics; how to use it is covered in the C# Advanced series post "Performance in C#: Allocations, Structs and Measuring with BenchmarkDotNet".
Interpreting performance in a Debug build. dotnet run builds Debug by default, and JIT optimization is off for Debug assemblies:
$ dotnet build samples/JitLab
$ DOTNET_JitStdOutFile=jit.txt DOTNET_JitDisasmSummary=1 dotnet samples/JitLab/bin/Debug/net10.0/JitLab.dll tiers
total: 14000000
$ grep -E 'Lab:|Tiers' jit.txt
   8: JIT compiled Program:<<Main>$>g__Tiers|0_0(Bookstore.Catalog.Book[]) [MinOpts, IL size=85, code size=233]
   9: JIT compiled Bookstore.JitLab.Lab:CountInStock(Bookstore.Catalog.Book[]) [MinOpts, IL size=50, code size=173]
  11: JIT compiled Bookstore.JitLab.Lab:CountInStock(Bookstore.Catalog.Book[],int) [MinOpts, IL size=48, code size=172]
MinOpts means compilation without optimization so the debugger can see every variable; there are no tier transitions, no OSR and no PGO. Any performance comparison made in Debug is meaningless.
Putting [MethodImpl(MethodImplOptions.AggressiveInlining)] everywhere. Small methods are inlined already; .NET 10 can also inline bigger ones at call sites that have profile data. The attribute switches off the JIT's cost model: copying a big method into every call site grows the code and fills the instruction cache. For virtual and interface calls it does nothing at all, because the body to inline is not known. Use it only where a benchmark shows a difference.
A Small Experiment
★☆☆ Run the tiers command with DOTNET_TieredCompilation=0 and compare the JitDisasmSummary output with the ones above. How many times was each method compiled, and with which label?
★★☆ Add a third class to IBookRule and spread the calls in the pgo command evenly over three rules. How many type checks do you see in the Tier1 code of CountMatches? What changes when the split is 8/1/1?
★★★ Let the array in ShippingDays escape: first return it from the method, then write it to a static field, and finally make its size depend on run time with new int[quantity % 4 + 1]. In each case check the alloc output and where CORINFO_HELP_NEWARR_1_VC appears.
In this post machine code was produced while the program ran, step by step. In the next post we move that work to build time: we publish the same Bookstore API with JIT, ReadyToRun and Native AOT and measure startup time, memory and throughput; what our filter language's Expression.Compile() call turns into under Native AOT is there as well.