

Finding the Slow Request with a Trace Backend: Jaeger v2, Grafana Tempo and the N+1 Query in Checkout
Finding the slow request in a trace backend depends on asking the right question: Jaeger v2 searches indexed tags, Tempo uses TraceQL with conditions across spans. We open Bookstore's 7.6-second checkout in the waterfall, find the retry storm and the N+1 query, measure two fixes and hedging, and show why percentiles computed from tail-sampled traces mislead.
Version note: The examples in this post were run with .NET 10, OpenTelemetry .NET 1.21, Microsoft.Extensions.Http.Resilience 10.11, Jaeger 2.23.0 and the grafana/otel-lgtm 0.41.0 image (Tempo 3.1.1, Prometheus 3.16.0, Grafana 13.3.0).
Guess First
We sent 1,200 orders to Bookstore, the online bookstore used as the shared example across this site's series. The traffic tool measured checkout's median at 108 ms and its p95 at 5.08 seconds. For the same minutes we asked Tempo with TraceQL: { span.http.route = "/api/orders/" } | quantile_over_time(duration, .5, .95). The answer was a median of 1.40 seconds and a p95 of 7.51 seconds. When we asked how many checkouts there were, it said 374, not 1,200. Is Tempo measuring wrong, or the traffic tool? The answer lies in how traces get to Tempo; it's in the Pitfalls section.
Jaeger v2 and Tempo: Two Different Architectures
The two open-source trace backends do the same job on different assumptions. Jaeger v2 is a customized distribution of the OpenTelemetry Collector: a single binary that, depending on its config, runs as collector, query, ingester or all of them together (all-in-one), and it takes OTLP directly. It writes traces to a storage such as Cassandra, Elasticsearch, OpenSearch or Badger and keeps an index by service, operation, tag and duration. Search is fast, but the index has a cost: an index entry is written for every span, and the storage has to be run to carry that load.
Tempo keeps no index. It writes spans in blocks (in Parquet format) to object storage: S3, Azure Blob Storage, GCS or a local disk. Fetching by trace id is cheap; search is done by scanning blocks with TraceQL. Because the storage is cheap, keeping everything for a long time is possible; in return, searches over a wide time range can be slower than Jaeger's indexed search. Tempo 3.0 also changed its architecture: ingesters were removed entirely. In microservices mode the write path goes through a Kafka-compatible system, block-builders produce the blocks and live-stores query recent data. In monolithic mode everything runs in one process without Kafka; the Tempo inside otel-lgtm uses this mode.
The practical questions for choosing are these. If the team already uses Grafana and wants traces on the same screen as metrics and logs, Tempo is the natural choice. For a team that already runs Elasticsearch or Cassandra, Jaeger uses the existing infrastructure. If retention and volume are large, the cost of object storage decides. Both take OTLP, so nothing changes in the application; only the exporter in the Collector changes.
Searching with Jaeger v2
We started Jaeger with the all-in-one image from the official docs; the default config keeps data in memory, so a restart loses it:
docker run -d --name bookstore-jaeger -p 16686:16686 -p 4317:4317 -p 4318:4318 cr.jaegertracing.io/jaegertracing/jaeger:2.23.0
# log: No '--config' flags detected, using default All-in-One configuration with memory storage.
This time the application sent straight to Jaeger instead of the Collector (OTEL_EXPORTER_OTLP_ENDPOINT=http://localhost:4317), and we placed 200 orders; the traffic tool counted 6 orders slower than 7 seconds. Jaeger's UI is on port 16686. We ran the same search through Jaeger's v3 HTTP API:
curl -s -G http://localhost:16686/api/v3/traces \
  --data-urlencode 'query.service_name=bookstore-api' \
  --data-urlencode 'query.operation_name=POST /api/orders/' \
  --data-urlencode 'query.duration_min=7s' \
  --data-urlencode 'query.start_time_min=2026-11-14T19:00:00Z' \
  --data-urlencode 'query.start_time_max=2026-11-14T21:00:00Z' \
  --data-urlencode 'query.search_depth=20' \
  | jq -c '[.result.resourceSpans[].scopeSpans[].spans[] | select(.name=="POST /api/orders/") | {traceId, ms: (((.endTimeUnixNano|tonumber) - (.startTimeUnixNano|tonumber))/1e6|floor)}]'

[{"traceId":"b4743bd8e07fbdd45e4ffe2ffc6a27e5","ms":7595},{"traceId":"389b645409874ff9f129aadd80c37243","ms":7598},{"traceId":"aa12a897578191c6173d1be97f34ba4a","ms":7642},{"traceId":"06585bdacce910ec94229ecfdf8bc769","ms":9540},{"traceId":"95bb98fbb30cfdb7063792949da95575","ms":7610},{"traceId":"8b67c35430d157bac48d45806376282d","ms":7638}]
All six traces are there, because there is no sampling in this setup. The query.attributes parameter searches by span attribute too; {"bookstore.cart.line_count":"12"} returned all 20 institutional orders. That's Jaeger's search model: service, operation, duration and tag filters. A question that combines conditions on different spans, such as "carts with 12 lines that took longer than 5 seconds", is hard to ask. TraceQL exists for exactly that kind of question.
Tempo and TraceQL
We removed Jaeger and went back to otel-lgtm; here traces reach Tempo through the Collector's tail sampling. In TraceQL { } is a spanset, the spans that match the condition. Inside it, span. selects a span attribute, resource. a resource attribute, and fields such as name, duration, status and kind select the span's own properties. The queries we ran over the 1,200-order run and the number of traces they returned:
{ span.http.route = "/api/orders/" }                                                          374
{ span.http.route = "/api/orders/" && duration > 5s }                                         71
{ span.bookstore.cart.line_count = 12 && duration > 5s }                                     0
{ span.bookstore.cart.line_count = 12 && traceDuration > 5s }                                3
{ name = "authorize payment" } > { kind = client && status = error } | count() >= 3            15
{ name = "check availability" } > { span.db.system.name = "microsoft.sql_server" } | count() > 10   35
The 0 on the third line is instructive. && inside one spanset applies to the same span: the span that carries the cart's line count is "check availability", and that span never takes 5 seconds. If you want the trace's total duration, use traceDuration. The last two lines are structural queries: > means "direct child", >> means "any descendant". The fifth query found 15 traces with at least three failed HTTP attempts under the payment span; the sixth found 35 traces with more than 10 SQL queries under the stock check. They are the case's two causes.
Reading the Waterfall
We fetched the trace of the 7.64-second institutional order that the fourth query found from Tempo's API and printed its span tree (start and duration in milliseconds; repeated lines shortened):
trace deea369ce9b1bcdfc8a8efca90e25b4a 41 spans
      0.0    7639.5  POST /api/orders/
      0.2       0.7    SELECT [c].[Id] [c].[CreatedAtUtc] [c].[UpdatedAtUtc] [ordering].[Carts] [ordering].[CartItems]
      1.0       0.4    SELECT [catalog].[Books]
      1.5       6.5    check availability
      1.5       0.4      SELECT [inventory].[StockItems]
      1.9       0.4      SELECT [inventory].[StockItems]
      ...                (12 SELECTs, 0.3–0.8 ms each)
      7.7       0.3      SELECT [inventory].[StockItems]
      8.4       4.5    reserve stock
      8.4       0.4      UPDATE
      ...                (12 UPDATEs)
     21.6    7617.8    authorize payment
     21.7    1999.9      POST ERROR
   2521.8    2000.3      POST ERROR
   5024.3    2000.7      POST ERROR
   7526.6     107.3      POST
   7634.1       5.3      UPDATE
   7639.4       0.0      order-confirmations publish
   7639.5      47.1        order-confirmations process
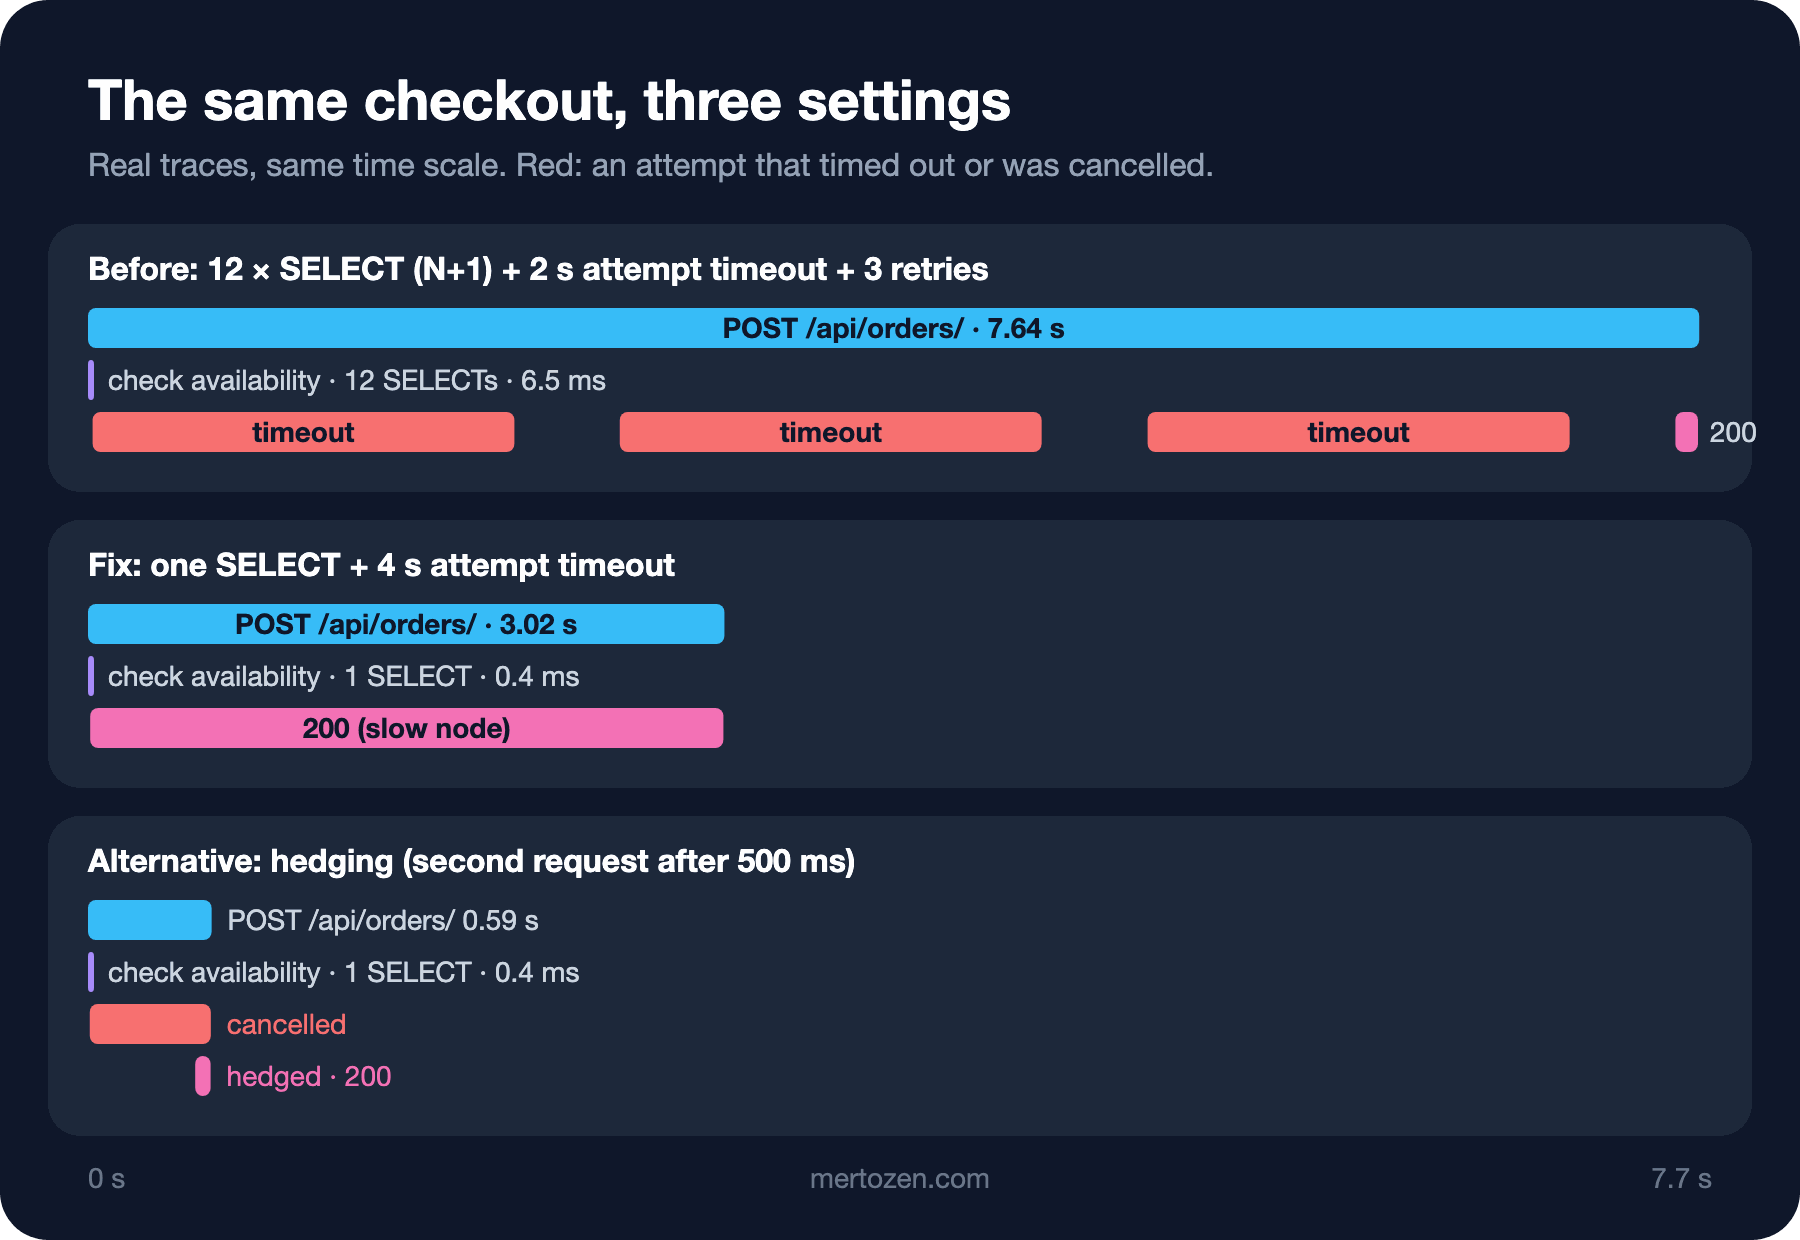
The trace shows two things clearly. The first is time: 7.62 of the 7.64 seconds are in the payment span. Three attempts were cut at exactly 2,000 ms (error type TaskCanceledException), with 500 ms waits between them, and the fourth attempt succeeded in 107 ms. The payment provider's slow node answers in 3 seconds; with a 2-second attempt timeout every attempt that lands on the slow node is certain to fail, and the retry again has a 25 percent chance of landing on the same node. Looking at Prometheus, in the same run about 1,200 payment calls got 379 retries on top; more than 30 percent extra load on the provider. Loading a slow provider with even more requests like this is a retry storm.
The second is structure: 12 separate SELECTs under "check availability". One query per cart line, an N+1. On this machine the database runs on the same computer, so the 12 queries took 6.5 ms in total; that's not what slows the checkout down. But the trace shows it from its structure, independent of time. When the database is on the other end of a network, every round trip adds 1–2 ms and grows with the number of lines; for a 200-line school order the difference becomes noticeable. The mechanics of N+1 and avoiding it in EF Core were covered in the EF Core series; what matters here is seeing it in the trace.
Fix 1: One Query
public async Task<IReadOnlyDictionary<int, int>> GetAvailableAsync(IReadOnlyCollection<int> bookIds, CancellationToken ct) =>
    await db.StockItems.AsNoTracking()
        .Where(s => bookIds.Contains(s.BookId))
        .ToDictionaryAsync(s => s.BookId, s => s.QuantityOnHand - s.QuantityReserved, ct);
check?.SetTag("bookstore.cart.line_count", cart.Items.Count);
// One query for the whole cart: the per-line query was an N+1 (12 SELECTs for an institutional order).
IReadOnlyDictionary<int, int> available =
await inventory.GetAvailableAsync([.. cart.Items.Select(i => i.BookId)], ct);
foreach (CartItem item in cart.Items)
{
if (available.GetValueOrDefault(item.BookId) < item.Quantity)
{
shortIsbns.Add(books[item.BookId].Isbn);
}
}We didn't touch the per-line UPDATE in reserve stock: that's a deliberate choice (a conditional UPDATE per book, taking locks always in the same order). We also added a test for the change: in TracingTests an ActivityListener checks that, for an order with a 4-line cart, the "check availability" span has exactly one child. With the old code the test broke with Assert.Single() Failure: The collection contained 4 matching items. Turning a problem found in a trace into a regression test like this keeps the same N+1 from quietly coming back in the next refactoring. After the fix, the same TraceQL metrics query ({ name = "check availability" && span.bookstore.cart.line_count = 12 } | quantile_over_time(duration, .5)) brought the median for 12-line carts from 5.3 ms down to 0.4 ms.
Fix 2: Stopping the Retry Storm
.AddResilienceHandler("payment-provider", pipeline =>
{
    // Outer: the whole call, retries included, never takes longer than 10 seconds.
    pipeline.AddTimeout(TimeSpan.FromSeconds(10));
    // Retry only transient failures (5xx, 408, 429, network errors, attempt timeouts), backing off with jitter.
    pipeline.AddRetry(new HttpRetryStrategyOptions
    {
        MaxRetryAttempts = 2,
        Delay = TimeSpan.FromMilliseconds(200),
        BackoffType = DelayBackoffType.Exponential,
        UseJitter = true
    });
    // Inner: one attempt may take 4 seconds, above the provider's slowest normal answer (3 s, seen in the traces).
    pipeline.AddTimeout(TimeSpan.FromSeconds(4));
});
The real change is the attempt timeout going from 2 to 4 seconds. The rule is simple: the attempt timeout must not cut the dependency's normal but slow answer. The traces showed the provider's slow answer takes 3 seconds; as long as the timeout stayed below that, retries saved nothing and only added load and waiting. We added two more things: a 10-second total timeout on the outside (the longest a user waits is now written in one place) and an exponential, jittered backoff instead of a fixed 500 ms, so that many clients retrying at once don't hit the provider at the same moment. The details of retries and timeouts belong to the External Service Integration and Resilience series. The result of a 600-order run:
orders=600 concurrency=4
status: 201=600
POST /api/orders ms: avg=868 p50=106 p95=3017 p99=3044 max=3173
slower than 2 s: 159, slower than 7 s: 0
In the earlier run p95 was 5.08 and p99 7.61 seconds, and 4 orders ended with a 502. Now there are no errors, the slowest order took 3.17 seconds, and the provider's log has exactly 600 requests for 600 orders; the retry storm is over. In Tempo, { span.http.route = "/api/orders/" && duration > 5s } now returns 0 traces for the same minutes. But 26 percent of orders still wait 3 seconds; that's the provider's slow node, and our timeout setting doesn't solve it.
One way to reduce that too is hedging: if the answer doesn't come within a certain time, send the same request once more in parallel and take the first answer. We tried that as well:
// Hedging: if the provider hasn't answered within 500 ms, send the same request once more in parallel
// and take whichever answer comes first. Safe only because the provider honours Idempotency-Key.
.AddStandardHedgingHandler()
.Configure(options =>
{
    options.Hedging.MaxHedgedAttempts = 1;
    options.Hedging.Delay = TimeSpan.FromMilliseconds(500);
    options.Endpoint.Timeout.Timeout = TimeSpan.FromSeconds(4);
    options.TotalRequestTimeout.Timeout = TimeSpan.FromSeconds(10);
});
orders=600 concurrency=4
status: 201=600
POST /api/orders ms: avg=360 p50=105 p95=3011 p99=3021 max=3027
slower than 2 s: 36, slower than 7 s: 0The number of orders waiting 3 seconds dropped from 159 to 36; the rest are orders where both requests landed on the slow node (25 percent × 25 percent ≈ 6 percent). The price is in the provider's log: 744 requests arrived for 600 orders, and 144 were cancelled because we got the answer elsewhere. That's 24 percent extra load, on a provider that's already struggling. Hedging is right only if the provider is idempotent and can take the extra load; turning it on without talking to the provider brings back a retry storm under another name. In Bookstore we put the first fix into the repo and leave hedging as a measured option. The traces of the three settings side by side:
Span Metrics and the Service Graph
Tempo's metrics-generator can produce metrics from incoming spans and write them to Prometheus; in otel-lgtm two processors are on. Span metrics give request count, errors and a duration histogram per span name (traces_spanmetrics_calls_total, traces_spanmetrics_latency); the service graph derives edges between services from client and server span pairs (traces_service_graph_request_total). Grafana's Service Graph view is drawn from these metrics. We asked for the 1,200-order run:
sum by (span_name) (increase(traces_spanmetrics_calls_total{span_name=~"POST /api/orders/|authorize payment|check availability"}[341s]))
{span_name="POST /api/orders/"}   399.4546066374182
{span_name="authorize payment"}   399.4546066374182
{span_name="check availability"}  399.4546066374182

sum by (client, server, connection_type) (increase(traces_service_graph_request_total[341s]))
{client="user", connection_type="virtual_node", server="bookstore-api"}         955.8764706255834
{client="bookstore-api", connection_type="database", server="localhost"}        6935.7877092843855
{client="bookstore-api", connection_type="messaging_system", server="bookstore-api"}  395.1244754001562
Two observations. First, span metrics count about 400 checkouts, not 1,200; the reason is the same as the difference in Guess First. Second, the service graph has database and in-process queue edges, but no edge to the payment provider: the provider doesn't send spans of its own, and our client spans weren't enough to produce an edge in this Tempo setup. The service graph only shows dependencies that send spans or are marked by attributes it recognizes; external services missing from the map is normal.
In Production
Think about the trace backend's retention and search window together. Tempo makes long retention cheap, but a TraceQL search over a wide window scans many blocks; narrowing the window to the time of the problem is both fast and cheap. In Jaeger the retention is also the index's retention, and storage capacity is planned accordingly.
A trace's spans come from different machines, and every span is timestamped with its own machine's clock. If the clocks drift apart (clock skew), in the waterfall a child appears to start before its parent or end after it. Synchronizing with NTP is a precondition for readable traces. Everything in our example ran in one process, so we didn't see this problem.
After fixing a problem found in a trace, run the same search again. The "duration > 5s" query dropping from 71 to 0 is the proof of the fix; putting it in the pull request description shortens the next review.
Common Pitfalls
Computing percentiles and counts from tail-sampled traces. This is the answer to Guess First. The Collector keeps every error and every trace slower than 1 second, and 10 percent of the rest. The 374 checkouts in Tempo are a sample of the 1,200 skewed toward slow ones; the median computed from them is 1.40 seconds, the real one 108 ms. Span metrics are produced after sampling, so they carry the same skew. For rates, counts and percentiles look at the application's own metrics (the histogram in Prometheus); the trace backend is for the "which request and why" question.
The trace you're looking for isn't there. As we saw with exemplars, the sampling decision may have dropped it. If you're looking for the trace of a fast request that didn't fail, not finding it is normal; knowing the sampling rules is essential so you don't confuse "no trace" with "the request never arrived".
Combining conditions on different spans with && inside one spanset. The result is silently empty. For different spans use { A } && { B } or the structural operators, and traceDuration for the total duration.
Keeping the timeout below the dependency's normal response time. Then the retry always loses and only adds load; pick the value from the real distribution seen in the traces, not from a guess.
Looking only at the longest bar in the waterfall. The N+1 here didn't decide the duration, but its structure was plainly visible in the trace. Repeated short spans become a problem when the data grows, if not today.
A Small Experiment
★☆☆ Run { name = "reserve stock" } > { span.db.system.name = "microsoft.sql_server" } | count() > 10 in Tempo and see how many traces it returns. Is this an N+1 or a deliberate choice? Compare your answer with the comment in the code.
★★☆ Start the payment provider with Provider:SlowDelayMs=5000. Show in the traces that our new setting (a 4-second attempt timeout) turns into a retry storm again in this case, and think about which metric you should look at to set the timeout instead of a fixed number.
★★★ Set the probabilistic rate of the Collector's tail sampling to 100 percent, send the same traffic again and compare quantile_over_time with the median measured by the traffic tool. Then set the rate back to 10 percent and measure the difference in Tempo's span count and disk usage.
We found the traces and fixed the case. On this journey we never looked at logs, but the details of "what exactly happened" are still in the logs: whose order it was, which error message. In the next post we move to log backends: sending logs to Loki with OpenTelemetry logs, the difference between labels and structured metadata, LogQL, and jumping from a log line to its trace in one click; a comparison with ELK and where Seq fits.