

A Query's Journey Inside SQL Server: Relational Engine, Storage Engine, Buffer Pool and Transaction Log
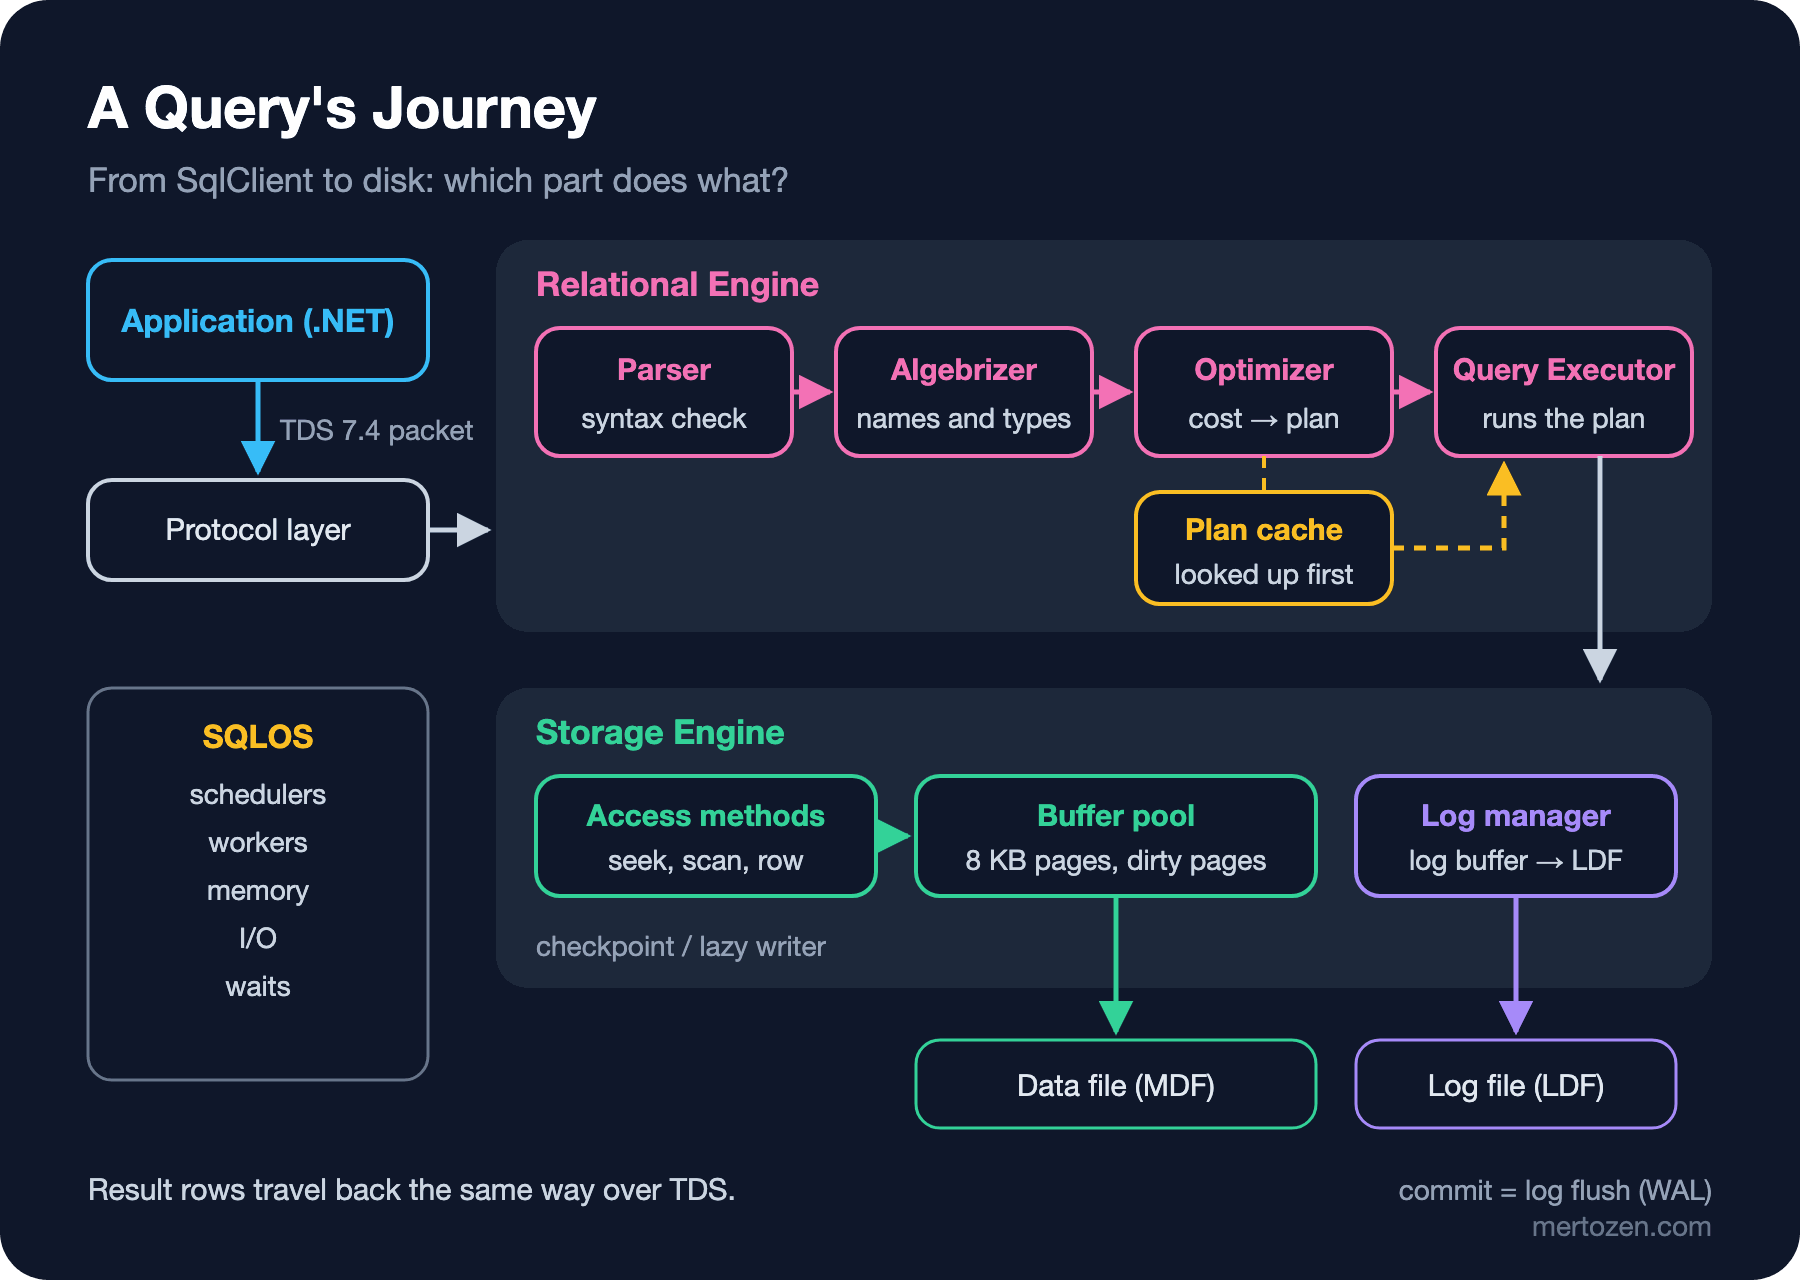
A query reaches SQL Server over TDS, is parsed, bound and optimized in the Relational Engine and lands in the plan cache; the Storage Engine reads pages through the buffer pool, and changes go to the transaction log first (WAL) and to the data file later via checkpoint. Also: the deterministic 5.6-million-row Bookstore lab data used across the series, the 2025 editions and how compatibility level differs from engine version.
Version note: The T-SQL (Transact-SQL, Microsoft's dialect of SQL (Structured Query Language)) examples in this post were run on SQL Server 2025 RTM (Release To Manufacturing) CU10 (Cumulative Update 10; 17.0.5035.5, Enterprise Developer Edition, compatibility level 170), and the C# examples with .NET 10, Microsoft.Data.SqlClient 7.1.1 and Dapper 2.1.89.
Guess First
The Bookstore database holds 1,000,000 orders. We run the same report query twice in a row, and nothing changes between the two runs:
SET STATISTICS IO ON;
SELECT COUNT(*) AS Orders2026, SUM(TotalAmount) AS Revenue
FROM dbo.Orders
WHERE CreatedAt >= '2026-01-01';
/* the same query a second time */
SELECT COUNT(*) AS Orders2026, SUM(TotalAmount) AS Revenue
FROM dbo.Orders
WHERE CreatedAt >= '2026-01-01';
Both runs return the same result: 210,880 orders and 16,560,619.87 in revenue. Does SQL Server read the same number of pages in both? How many times does it go to disk? Make your guess, then look at the real output:
Table 'Orders'. Scan count 11, logical reads 7709, physical reads 1, read-ahead reads 4551, ...
Table 'Orders'. Scan count 11, logical reads 7709, physical reads 0, read-ahead reads 0, ...
Logical reads are 7,709 in both runs. The difference is on disk: the first run fetched 4,552 pages from disk, the second none. Same query, same plan, same work, yet the "disk" never took part the second time. Now consider this: when an UPDATE that changes the status of 100 orders commits, how many pages have been written to the data file? The answer is "none, at that moment". This post walks through the parts behind those two answers one by one: the TDS (Tabular Data Stream) protocol, the Relational Engine, the Storage Engine, the buffer pool, the transaction log and SQLOS (SQL Server Operating System) underneath them all. It also sets up the data we will use throughout the series.
The Lab Data for the Whole Series
A few thousand rows are not enough to see inside the engine: index levels, statistics histograms and parameter sniffing only show up with realistic volume and skewed distributions. To avoid depending on an external data set such as the Stack Overflow database, the series folder holds a single SCHEMA.sql. It builds the Bookstore schema with set-based T-SQL and GENERATE_SERIES and fills it with about 5.6 million rows. There is no RAND() or NEWID(); every value comes from a deterministic hash of the row number, so two loads produce identical data and you will see exactly the logical reads quoted in these posts:
/* every post has its own database */
CREATE DATABASE sqls_01;
GO
/* with sqlcmd: sqlcmd -S localhost -d sqls_01 -I -i SCHEMA.sql */
/* the script protects itself from running in the wrong database: */
DECLARE @Db sysname = DB_NAME();
IF @Db NOT LIKE 'sqls[_]%'
BEGIN
    RAISERROR('SCHEMA.sql must run inside a sqls_<NN> database. Current database: %s', 16, 1, @Db) WITH NOWAIT;
    RETURN;
END;
TableName Rows
---------- -------
Authors 5000
Books 40000
Customers 100000
OrderItems 2500496
Orders 1000000
Payments 1000000
Shipments 954755
StockItems 40000The load took about 13 seconds on this container; data and indexes together take 416 MB. The distribution is skewed on purpose: customer 1 (Grace Hopper, the corporate account of a university library) owns exactly 20% of the orders, 200,000 of them; the remaining customers follow a power-law distribution, and 2,190 customers have no orders at all. The Status column has 940,502 Delivered rows against only 4,800 Pending ones, all of them among the newest orders. CreatedAt and OrderId grow together. The only indexes are the primary key, unique and foreign key indexes that Entity Framework Core (EF Core) conventions would create; we will build the rest step by step in later posts. The table and column list lives in the series' SCHEMA.md.
From the Application to the Engine: TDS and the Protocol Layer
When your .NET application opens a SqlConnection, SqlClient talks TDS to the server. TDS is the application-level protocol SQL Server speaks with its clients: login, query text, RPC (Remote Procedure Call) calls, result rows and error messages all travel inside TDS packets. We can ask about our own connection through a DMV (Dynamic Management View):
await using var conn = new SqlConnection(connectionString);
await conn.OpenAsync();

var session = await conn.QuerySingleAsync<SessionInfo>("""
    SELECT c.net_transport AS NetTransport, c.protocol_type AS ProtocolType,
           CONVERT(varchar(10), CONVERT(varbinary(4), c.protocol_version), 2) AS TdsVersion,
           c.encrypt_option AS EncryptOption, c.auth_scheme AS AuthScheme,
           s.program_name AS ProgramName
    FROM sys.dm_exec_connections AS c
    JOIN sys.dm_exec_sessions AS s ON s.session_id = c.session_id
    WHERE c.session_id = @@SPID
    """);
Console.WriteLine(session);

sealed record SessionInfo(string NetTransport, string ProtocolType, string TdsVersion,
    string EncryptOption, string AuthScheme, string ProgramName);
SessionInfo { NetTransport = TCP, ProtocolType = TSQL, TdsVersion = 74000004, EncryptOption = TRUE, AuthScheme = SQL, ProgramName = Core Microsoft SqlClient Data Provider }0x74000004 means TDS 7.4. EncryptOption = TRUE is the result of Encrypt being on by default since SqlClient 4.0; we will cover TDS 8.0 and strict encryption separately in the security post. The protocol layer unpacks the packet and hands the request to the Relational Engine. Result rows travel back the same way.
The Relational Engine: Parse, Bind, Optimize, Execute
The Relational Engine (the query processor) turns query text into an executable plan. It does so in consecutive phases, and each phase produces a different class of error. Three broken queries are the easiest way to tell the phases apart:
SELEC OrderId FROM dbo.Orders;           /* 1 */
SELECT OrderId, Discount FROM dbo.Orders; /* 2 */
SELECT OrderId FROM dbo.Orderz;           /* 3 */
Msg 156, Level 15, State 1, Line 2
Incorrect syntax near the keyword 'FROM'.
Msg 207, Level 16, State 1, Line 2
Invalid column name 'Discount'.
Msg 208, Level 16, State 1, Line 2
Invalid object name 'dbo.Orderz'.The first one came back from the parser: the text does not fit the T-SQL grammar, a Level 15 syntax error. The second and third queries are syntactically fine; the algebrizer (the binding phase) rejected them. The algebrizer binds names to metadata, resolves column types, adds implicit conversions where needed and finally produces the query tree the optimizer works on. A missing table or column fails here.
The optimizer's work is the most expensive part, so the plan cache is checked first. Let's run the same parameterized query with three different values and look at the cache:
ALTER DATABASE SCOPED CONFIGURATION CLEAR PROCEDURE_CACHE;  /* only this database's plans */

EXEC sp_executesql N'SELECT o.OrderNumber, o.Status, o.TotalAmount FROM dbo.Orders AS o WHERE o.OrderId = @OrderId',
     N'@OrderId int', @OrderId = 42;
/* the same with @OrderId = 43 and 44 */

SELECT cp.objtype, cp.usecounts, cp.size_in_bytes, LEFT(st.text, 50) AS text
FROM sys.dm_exec_cached_plans AS cp
CROSS APPLY sys.dm_exec_sql_text(cp.plan_handle) AS st
WHERE st.text LIKE '%WHERE o.OrderId = @OrderId%' AND st.text NOT LIKE '%dm_exec%';
objtype usecounts size_in_bytes text
-------- --------- ------------- --------------------------------------------------
Prepared 3 49152 (@OrderId int)SELECT o.OrderNumber, o.Status, o.ToThree executions, one plan, usecounts = 3. The first call compiled; the other two reused the ready plan. The plan XML (Extensible Markup Language) also shows how hard the optimizer worked for this query:
OptmLevel CE  CompileMemoryKB FirstOp
--------- --- --------------- --------------------
TRIVIAL   170 168             Clustered Index Seek
TRIVIAL means that for queries with only one sensible plan, such as an equality search on the primary key, the optimizer never starts its cost-based search. A query with joins and aggregates goes to FULL optimization: the optimizer estimates row counts from statistics (CE, cardinality estimation), costs alternative plans and picks one that is "good enough". CE = 170 is the version of the cardinality estimation model in use; we will see shortly that it comes from the compatibility level. The chosen plan goes to the Query Executor, and the executor asks the Storage Engine for the rows each operator needs. We will dig into statistics in post four, reading plans in post five, and the plan cache with parameter sniffing in post seven.
The Storage Engine and the Buffer Pool
The Storage Engine's access methods turn requests like "seek this key in this index" or "scan this table from start to end" into page requests. But no operator reads directly from disk; every page is read through the buffer pool. The buffer pool is the memory area where SQL Server keeps data pages in 8 KB buffers. If a requested page is not there, the buffer manager brings it from disk (a physical read), and when it detects sequential access it reads ahead in bulk (read-ahead). If the page is there, the work ends in memory (a logical read).
To make the opening experiment repeatable on a shared server, I did not use a server-wide command such as DBCC DROPCLEANBUFFERS. Taking the database offline and back online drops only that database's pages from the buffer pool. Then I ran the query and checked how many pages of each table were in the buffer pool:
SELECT OBJECT_NAME(p.object_id) AS TableName,
       COUNT(*) AS cached_pages,
       SUM(CASE WHEN bd.is_modified = 1 THEN 1 ELSE 0 END) AS dirty_pages
FROM sys.dm_os_buffer_descriptors AS bd
JOIN sys.allocation_units AS au ON au.allocation_unit_id = bd.allocation_unit_id
JOIN sys.partitions AS p ON p.hobt_id = au.container_id
WHERE bd.database_id = DB_ID() AND OBJECT_SCHEMA_NAME(p.object_id) = 'dbo'
GROUP BY p.object_id;
TableName cached_pages dirty_pages
---------- ------------ -----------
Authors 1 0
Books 1 0
Customers 2 0
Orders 7604 0
OrderItems 1 0
StockItems 1 0
Payments 1 0
Shipments 2 0The clustered index of Orders consists of 7,601 leaf pages; since there is no index on CreatedAt, the query scanned all of them, and now almost all of them are in memory. That is why the second run had zero physical reads. Two practical consequences follow. First: when comparing performance, look at logical reads, because physical reads depend on the cache state at that moment and vary from run to run for the same query. Second: Scan count 11 tells you the query ran in parallel; the server has 10 schedulers and the scan was split across threads. We will talk about parallelism in post six.
The Write Path: Dirty Pages, Write-Ahead Logging and Checkpoint
Reads end in the buffer pool, and so do writes. An UPDATE changes the page in the buffer pool and the page is marked "dirty". Nothing is written to the data file at that moment:
CHECKPOINT;
UPDATE dbo.Orders SET Status = 'Delivered'
WHERE OrderId BETWEEN 999001 AND 999100 AND OrderId % 25 <> 7;

SELECT ISNULL(OBJECT_NAME(p.object_id), '(other)') AS ObjectName, COUNT(*) AS dirty_pages
FROM sys.dm_os_buffer_descriptors AS bd
LEFT JOIN sys.allocation_units AS au ON au.allocation_unit_id = bd.allocation_unit_id
LEFT JOIN sys.partitions AS p ON p.hobt_id = au.container_id
WHERE bd.database_id = DB_ID() AND bd.is_modified = 1
GROUP BY p.object_id;
ObjectName dirty_pages
---------- -----------
Orders 2So if the server goes down right now, how is the update not lost? The answer is WAL (write-ahead logging): the log record describing the change is written to the transaction log (the LDF file) before the data page, and at the latest at commit time. A commit saying "done" means the log records have been flushed to disk; data pages are written later, on their own schedule. We can see what a single-row transaction leaves in the log with sys.fn_dblog (an undocumented function; use it only in a lab):
BEGIN TRANSACTION;
UPDATE dbo.StockItems SET QuantityOnHand = QuantityOnHand - 1 WHERE BookId = 1;
COMMIT;
Current LSN Operation Context Transaction ID AllocUnitName
---------------------- --------------- ------------- -------------- ---------------------------
00000041:000021D8:0001 LOP_BEGIN_XACT LCX_NULL 0000:00002e33 NULL
00000041:000021D8:0002 LOP_MODIFY_ROW LCX_CLUSTERED 0000:00002e33 dbo.StockItems.PK_StockItems
00000041:000021D8:0003 LOP_COMMIT_XACT LCX_NULL 0000:00002e33 NULLEvery log record has an LSN (Log Sequence Number), and the page it changes also carries the LSN of its latest change. If the server crashes, recovery reads the log at startup: it reapplies changes that were committed but never reached the data file (redo) and reverses those that never committed (undo). Two mechanisms write dirty pages to disk. Checkpoint writes dirty pages periodically, limiting the amount of log recovery has to read; since SQL Server 2016, new databases come with indirect checkpoint and a 60-second target recovery time (sys.databases.target_recovery_time_in_seconds is 60 in our database too). The lazy writer frees cold pages under memory pressure, writing them to disk first when needed. Running CHECKPOINT by hand brought the dirty page count down to zero. Transactions, log growth and recovery models are the topic of post nine.
SQLOS: Schedulers, Workers and Waits
Under all of these parts sits SQLOS: the layer SQL Server puts between itself and the operating system. Instead of leaving threads to the OS, it runs them cooperatively (non-preemptively) on its own schedulers, manages memory with its own clerks and does its own I/O. Thanks to this layer, the same engine runs on Linux and on Windows.
SELECT status, COUNT(*) AS schedulers FROM sys.dm_os_schedulers GROUP BY status;
SELECT r.session_id, r.scheduler_id, r.status, r.command
FROM sys.dm_exec_requests AS r WHERE r.session_id = @@SPID;
status schedulers
-------------------- ----------
HIDDEN ONLINE 9
VISIBLE ONLINE 10
VISIBLE ONLINE (DAC) 1
session_id scheduler_id status command
---------- ------------ ------- -------
59 0 running SELECTThere are 10 visible schedulers for 10 CPUs (Central Processing Units), plus one reserved for the DAC (Dedicated Admin Connection). When a worker gives up the CPU to wait for something (a page coming from disk, a lock, a log flush), it records this as a wait type: PAGEIOLATCH_SH, LCK_M_X, WRITELOG and so on. These waits are the starting point for solving a "the database is slow" complaint by measurement; we will return to this layer in the diagnostics post.
Editions and Compatibility Level
SQL Server 2025 (17.x) became generally available on November 18, 2025. The edition table changes with this release as follows:
| Edition | Key limit | Note |
|---|---|---|
| Enterprise | Operating system maximum | All IQP (Intelligent Query Processing) feedback features live here |
| Standard | 4 sockets or 32 cores, 256 GB buffer pool | It was 24 cores in 2022; Resource Governor is now in Standard too |
| Express | 50 GB per database, 1,410 MB buffer pool | It was 10 GB in 2022; Advanced Services is gone as a separate edition |
| Enterprise Developer | Same as Enterprise | Free, development and test only |
| Standard Developer | Same as Standard | Free; new, for teams whose production runs Standard |
Splitting the Developer edition in two solves a practical problem: you used to test on a developer machine with Enterprise features (batch mode on rowstore, adaptive joins, memory grant feedback), then run Standard in production and struggle to understand why the plans differed. The container I use in this series is Enterprise Developer; whenever we see a feature that Standard lacks, I will say so.
The engine version and the database compatibility level are different things. The engine is 17.x, but each database chooses its set of behaviors through its compatibility level. Let's lower the level to 150 on the same server and try:
ALTER DATABASE CURRENT SET COMPATIBILITY_LEVEL = 150;
GO
SELECT value FROM GENERATE_SERIES(1, 3);
GO
SET SHOWPLAN_XML ON;
GO
SELECT COUNT(*) FROM dbo.Orders WHERE CustomerId = 42;
GO
SET SHOWPLAN_XML OFF;
GO
ALTER DATABASE CURRENT SET COMPATIBILITY_LEVEL = 170;
Msg 208, Level 16, State 1, Line 1
Invalid object name 'GENERATE_SERIES'.
CardinalityEstimationModelVersion="150"Even though the engine is 2025, GENERATE_SERIES (which needs level 160) was not recognized and the optimizer used version 150 of the CE model. Most features such as PSP (Parameter Sensitive Plan) optimization, DOP (degree of parallelism) feedback and OPPO (Optional Parameter Plan Optimization) also depend on the compatibility level. So "we upgraded the server to 2025" means, as long as the databases stay on an old level, that we got few of the new optimizer behaviors. The upgrade strategy is in the last post of the series.
How SQL Server 2019/2022 differ: the default level is 150 in 2019 and 160 in 2022; GENERATE_SERIES arrived with 2022, so this series' SCHEMA.sql does not run on 2019. In 2022, Standard is limited to 24 cores and a 128 GB buffer pool, Express to 10 GB, and there is a single Developer edition. The parser, algebrizer, buffer pool and WAL architecture are the same in all three versions.
In Production
Use logical reads as your yardstick. Physical reads and duration change with the cache state, disk speed and other load on the server; logical reads are stable for the same plan and the same data. That is also why this series shows logical reads, row counts, plan operators and wait types instead of durations: the container runs under emulation and absolute timings prove nothing.
Do not run cache-flushing commands in production. DBCC DROPCLEANBUFFERS and DBCC FREEPROCCACHE cold-start the whole server; in the following minutes every query goes to disk and recompiles. If you need to clear the plan cache of a single database, there is ALTER DATABASE SCOPED CONFIGURATION CLEAR PROCEDURE_CACHE.
Commit speed is log disk speed. Because of WAL, every commit waits for a log flush; in an application that opens many small transactions, the WRITELOG wait climbs. That is why grouping bulk work into one transaction or putting the log on a fast disk is effective.
Common Pitfalls
Treating the first run's duration as a benchmark. The first run compiles and brings pages from disk; the second does neither. Half of an "I added an index and the query got 10 times faster" result is sometimes just a warmed-up cache.
Forgetting the compatibility level. A database restored or moved from an old server keeps its old level. SELECT name, compatibility_level FROM sys.databases is the first thing to check after an upgrade.
Assuming "it committed, so it is in the data file". At any moment the data file can contain uncommitted changes and can lack committed ones. Consistency comes from the log and recovery, not from the data file; that is why copying data files while SQL Server is running is not a backup.
Not seeing edition differences in test. A plan that works nicely on Enterprise Developer can behave differently on Standard, which lacks batch mode and memory grant feedback. If production is Standard, test on Standard Developer.
A Small Experiment
★☆☆ Create your own sqls_01 database, load SCHEMA.sql and verify that the table row counts match the ones in this post. Then check the database size with EXEC sp_spaceused.
★★☆ Run the opening query with a WHERE CustomerId = 42 filter. Why are the logical reads far fewer than 7,709? Find out which index the plan uses with SET SHOWPLAN_TEXT ON.
★★★ Start an UPDATE with BEGIN TRANSACTION but do not commit. From another session, inspect the log bytes that transaction produced with sys.dm_tran_database_transactions, and why the log cannot be truncated with sys.databases.log_reuse_wait_desc. Then ROLLBACK and look at the same values again.
On the query's journey we saw how pages arrive in the buffer pool, but we never looked inside a page. In the next post we will examine the structure of the 8 KB page, the difference between a heap and a clustered index, B-tree levels and why GUID (Globally Unique Identifier) keys cause page splits, using real pages.