

A Diagnostic Method: Solving "the Database Is Slow" with Wait Statistics, DMVs and Extended Events
A "database is slow" complaint is solved by measuring, not guessing: session or server waits say what is waited on, DMVs and Extended Events say which query does how many logical reads, the plan says why, and the fix is verified with the same metric. In the example the slowness was blocking, not an index; an index took the status list from 7,707 to 3 logical reads. Duplicate index detection, 2025 time-bound XE sessions and OpenTelemetry from endpoint to query.
Version note: The SQL (Structured Query Language) examples in this post were run on SQL Server 2025 (17.0.5035.5, Cumulative Update 10); the .NET example was built and run with .NET 10, Microsoft.Data.SqlClient 7.1.1, Dapper 2.1.89, OpenTelemetry 1.20.1 and OpenTelemetry.Instrumentation.SqlClient 1.20.2. The lab is a shared container running under emulation, so we use durations not as speed claims but only to show which wait dominates.
Guess First: What Did This Query Wait For?
The support team writes: "The order screen sometimes opens very slowly." Behind the screen there are two queries: an order's details and the list of pending orders. We run both in the same session and look at the session's own wait statistics:
SELECT OrderId, Status FROM dbo.Orders WHERE OrderId = 999001;
SELECT TOP (20) OrderId, CreatedAt, TotalAmount FROM dbo.Orders WHERE Status = 'Pending' ORDER BY CreatedAt DESC;

SELECT TOP (6) wait_type, waiting_tasks_count, wait_time_ms
FROM sys.dm_exec_session_wait_stats
WHERE session_id = @@SPID
ORDER BY wait_time_ms DESC;
The second query scans the million-order table without an index. Is that the cause of the slowness? Or is it the disk, or the CPU (Central Processing Unit)?
wait_type|waiting_tasks_count|wait_time_ms
---------|-------------------|------------
LCK_M_S|1|3970
CXSYNC_PORT|11|114
LATCH_EX|24|71
LATCH_SH|7|6
SESSION_WAIT_STATS_CHILDREN|9|1
RESERVED_MEMORY_ALLOCATION_EXT|122|0
Almost all of the time the session waited went to a single LCK_M_S wait: the first query waited to read an order that another session had modified without committing. The scanning second query ran in parallel (CXSYNC_PORT, latches), but that's a small part of the waiting. In this example the answer to the "slow" complaint is not an index but blocking. If we had added an index on a hunch, the problem would still be there. This post builds a method that approaches such complaints with a measurement at every step: waits, queries, plans, the fix and verification.
Wait Statistics: What Is the Server Waiting For?
SQL Server records every moment a task can't run with a wait type. The accumulated totals at server level live in sys.dm_os_wait_stats; but these numbers accumulate since the server started. What matters is the difference (delta) between two moments:
SELECT wait_type, waiting_tasks_count, wait_time_ms, signal_wait_time_ms
INTO #before
FROM sys.dm_os_wait_stats;

WAITFOR DELAY '00:05:00';

SELECT w.wait_type,
       w.waiting_tasks_count - b.waiting_tasks_count AS waits,
       w.wait_time_ms - b.wait_time_ms AS wait_ms,
       w.signal_wait_time_ms - b.signal_wait_time_ms AS signal_ms
FROM sys.dm_os_wait_stats AS w
JOIN #before AS b ON b.wait_type = w.wait_type
WHERE w.wait_time_ms - b.wait_time_ms > 0
  AND w.wait_type NOT IN (N'SLEEP_TASK', N'LAZYWRITER_SLEEP', N'XE_TIMER_EVENT', N'BROKER_TO_FLUSH',
                          N'REQUEST_FOR_DEADLOCK_SEARCH', N'SQLTRACE_INCREMENTAL_FLUSH_SLEEP',
                          N'CHECKPOINT_QUEUE', N'DIRTY_PAGE_POLL', N'HADR_FILESTREAM_IOMGR_IOCOMPLETION')
ORDER BY wait_ms DESC;
The types waited on most in a five-minute window are the first clue to the server's bottleneck. Because this lab is a shared server where other work runs too, we don't show the server-level output here; when examining a single request, the session-level sys.dm_exec_session_wait_stats gives a cleaner result. The list of "harmless" wait types (sleeps of background tasks) is shortened; the community publishes longer filter lists. signal_wait_time_ms is the time spent waiting in the CPU queue after the resource became free; if its share of the total wait is high, there is CPU pressure. The waits you'll see most often:
| Wait type | What is waited on | Where to look first |
|---|---|---|
LCK_M_* | Another transaction's lock | Head blocker, transaction length (post 11) |
PAGEIOLATCH_* | Reading a page from disk into the buffer pool | Queries that read a lot, missing indexes, memory |
CXPACKET, CXCONSUMER | Coordination between parallel plan threads | Large scans running in parallel, MAXDOP (Max Degree of Parallelism) |
SOS_SCHEDULER_YIELD | A task giving up the CPU and queuing again | CPU-heavy queries, scalar UDFs (User-Defined Functions) |
WRITELOG | Waiting for a transaction log write to finish | Many small commits, the log disk |
RESOURCE_SEMAPHORE | A memory grant for a query | Oversized memory grants, bad estimates (post 6) |
PAGELATCH_* | Access to a page in memory | tempdb contention, last-page inserts |
ASYNC_NETWORK_IO | The client reading the result | The application consumes rows slowly |
Waits tell you "what" is waited on, not "who" causes it. If PAGEIOLATCH_SH is high, the disk may be slow, but the more frequent cause is a query reading more pages than necessary. So the next step is finding the queries.
Finding the Most Expensive Queries with DMVs
A small .NET application imitating the Bookstore API (Application Programming Interface) runs three queries a few times: the order list by status, order details by order number, and a customer's orders. From the statistics in the plan cache, the queries with the most logical reads in this database:
SELECT TOP (4)
       qs.execution_count,
       qs.total_logical_reads / qs.execution_count AS avg_logical_reads,
       qs.total_rows / qs.execution_count AS avg_rows,
       LEFT(SUBSTRING(t.text, qs.statement_start_offset / 2 + 1, 200), 80) AS statement_text
FROM sys.dm_exec_query_stats AS qs
CROSS APPLY sys.dm_exec_sql_text(qs.sql_handle) AS t
CROSS APPLY sys.dm_exec_plan_attributes(qs.plan_handle) AS pa
WHERE pa.attribute = 'dbid' AND CAST(pa.value AS int) = DB_ID()
  AND t.text LIKE '%FROM dbo.Orders%' AND t.text NOT LIKE '%dm_exec%'
ORDER BY qs.total_logical_reads DESC;
execution_count|avg_logical_reads|avg_rows|statement_text
---------------|-----------------|--------|--------------
5|7707|20|SELECT TOP (20) OrderId, CreatedAt, TotalAmount FROM dbo.Orders WHERE Status = @
4|7707|4458|SELECT OrderId, CreatedAt, TotalAmount FROM dbo.Orders WHERE CustomerId = @custoBoth queries read about 7,700 pages every time they run; since the clustered index of Orders is 7,601 pages, both scan the table from start to end. But there's an important difference: the first reads the whole table to return 20 rows, the second returns 4,458 rows. 7,707 reads for 20 rows shows how bad the ratio of rows returned per page read is; this is the first candidate. For parameterized queries the dbid of sys.dm_exec_sql_text comes back empty, so we read the database from the plan attribute.
Know the limits of this DMV (Dynamic Management View): it only shows queries that are in the plan cache; history is lost if the server restarts, if a plan is evicted under memory pressure, or if OPTION (RECOMPILE) is used. For a persistent history you can compare over time, use Query Store (post 8). For the live picture, the community's free tool sp_WhoIsActive (a stored procedure written by Adam Machanic) brings sys.dm_exec_requests, sessions, locks and plan information together in one readable output; it's widely used in production and is a mature version of the DMV queries in this post.
Index Usage: Unused and Duplicate Indexes
The opposite of the read side is the write side: every index is updated on every INSERT, UPDATE and DELETE. We deliberately added two unnecessary indexes to the lab: an exact copy of IX_Orders_CustomerId and IX_Payments_Method, which no query uses:
SELECT OBJECT_NAME(i.object_id) AS table_name, i.name AS index_name,
       ISNULL(us.user_seeks, 0) AS seeks, ISNULL(us.user_scans, 0) AS scans,
       ISNULL(us.user_lookups, 0) AS lookups, ISNULL(us.user_updates, 0) AS updates
FROM sys.indexes AS i
LEFT JOIN sys.dm_db_index_usage_stats AS us
    ON us.object_id = i.object_id AND us.index_id = i.index_id AND us.database_id = DB_ID()
WHERE i.object_id IN (OBJECT_ID('dbo.Orders'), OBJECT_ID('dbo.Payments'))
ORDER BY table_name, index_name;
table_name|index_name|seeks|scans|lookups|updates
----------|----------|-----|-----|-------|-------
Orders|IX_Orders_CustomerId|0|4|0|0
Orders|IX_Orders_CustomerId_Copy|0|0|0|0
Orders|PK_Orders|0|15|4|2
Orders|UX_Orders_OrderNumber|4|0|0|0
Payments|IX_Payments_Method|0|0|0|0
Payments|PK_Payments|0|0|0|1
Payments|UX_Payments_OrderId|0|1|0|0The copy and IX_Payments_Method were never read. You can also find duplicates by comparing key columns; a query that lists pairs of indexes with the same columns in the same order found IX_Orders_CustomerId_Copy as a copy of IX_Orders_CustomerId in this lab. Careful: sys.dm_db_index_usage_stats resets when the server restarts. Before dropping an index as "unused", watch a period long enough to cover rarely running jobs such as the month-end report.
Capturing with Extended Events
DMVs show totals; to see individual executions, which application they came from and with which parameters, you need Extended Events. A session that captures only requests in this database that finish above 1,000 logical reads:
CREATE EVENT SESSION sqls_18_slow ON SERVER
ADD EVENT sqlserver.rpc_completed
    (ACTION (sqlserver.client_app_name, sqlserver.query_hash)
     WHERE sqlserver.database_name = N'sqls_18' AND logical_reads > 1000),
ADD EVENT sqlserver.sql_batch_completed
    (ACTION (sqlserver.client_app_name, sqlserver.query_hash)
     WHERE sqlserver.database_name = N'sqls_18' AND logical_reads > 1000)
ADD TARGET package0.ring_buffer
WITH (MAX_DURATION = 30 MINUTES);
GO
ALTER EVENT SESSION sqls_18_slow ON SERVER STATE = START;
event_name|app|logical_reads|row_count|statement
----------|---|-------------|---------|---------
rpc_completed|Bookstore.Api|7737|20|exec sp_executesql N'SELECT TOP (20) OrderId, CreatedAt, TotalAmount FROM dbo.Orders WHERE
rpc_completed|Bookstore.Api|7707|20|exec sp_executesql N'SELECT TOP (20) OrderId, CreatedAt, TotalAmount FROM dbo.Orders WHERE
rpc_completed|Bookstore.Api|7777|4458|exec sp_executesql N'SELECT OrderId, CreatedAt, TotalAmount FROM dbo.Orders WHERE CustomerEvery parameterized query the application sends arrives as rpc_completed, ad hoc batches from sqlcmd or SSMS (SQL Server Management Studio) as sql_batch_completed; if you don't take both, you miss half of the picture. Because the filter is on the event's own field (logical_reads), thousands of fast requests below the threshold are never collected; that's what keeps Extended Events cheap in production. The client_app_name action brings the Application Name from the connection string; the simplest way to tell apart services that share the same server. query_hash lets you group executions of the same query with different parameters.
MAX_DURATION = 30 MINUTES is the time-bound session feature that came with SQL Server 2025: a session opened for diagnosis stops itself after half an hour. The most common mistake in production is a session left running after the problem is solved, collecting events for weeks. In earlier versions you'd manage that with a SQL Agent job or by stopping it by hand.
Connecting to the Application: OpenTelemetry
Complaints come from an endpoint, not from the database. Seeing on the application side which SQL commands each HTTP (Hypertext Transfer Protocol) request ran is the shortest way down from "slow endpoint" to "slow query". OpenTelemetry's SqlClient instrumentation produces a span for every command:
ActivitySource api = new("Bookstore.Api");

using TracerProvider tracing = Sdk.CreateTracerProviderBuilder()
    .AddSource("Bookstore.Api")
    .AddSqlClientInstrumentation()
    .AddConsoleExporter()
    .Build();

await using SqlConnection connection = new(connectionString);

using (Activity? request = api.StartActivity("GET /orders?status=Pending"))
{
    IEnumerable<OrderRow> rows = await connection.QueryAsync<OrderRow>(
        "SELECT TOP (20) OrderId, CreatedAt, TotalAmount FROM dbo.Orders WHERE Status = @status ORDER BY CreatedAt DESC",
        new { status = new DbString { Value = "Pending", IsAnsi = true, Length = 20 } });
    request?.SetTag("orders.count", rows.Count());
}
Activity.TraceId: ea1724588f09528815421995b061ee3b
Activity.ParentSpanId: 5466b422839844df
Activity.DisplayName: SELECT dbo.Orders
Activity.Kind: Client
Activity.Tags:
db.system.name: microsoft.sql_server
db.namespace: sqls_18
server.address: localhost
server.port: 14333
db.query.text: SELECT TOP (?) OrderId, CreatedAt, TotalAmount FROM dbo.Orders WHERE Status = @status ORDER BY CreatedAt DESC
db.query.summary: SELECT dbo.Orders
Activity.TraceId: ea1724588f09528815421995b061ee3b
Activity.SpanId: 5466b422839844df
Activity.DisplayName: GET /orders?status=Pending
Activity.Kind: Internal
Activity.Tags:
orders.count: 20The two spans share the same TraceId; the SQL span's ParentSpanId is the endpoint span. We removed the duration lines from the output so that measurements under emulation aren't read as speed claims; in a real system you'd see the durations of these two spans side by side in a UI such as Jaeger or Grafana. In db.query.text literals are masked with ? and parameters keep their names: sensitive values don't leak into the trace, but the query text is clear enough to match the statement in Extended Events and the text in sys.dm_exec_query_stats. Together with the logging and CancellationToken infrastructure we built in the ASP.NET Core Web API series, this is the application side of the path from complaint to query.
Note that we passed IsAnsi = true with DbString when writing the query: the Status column is varchar. Without it the parameter would go as nvarchar, and because of the implicit conversion a seek might not be possible even with an index (post 6 and the SQL Server post of the Dapper series).
The Whole Flow: Fix and Verify
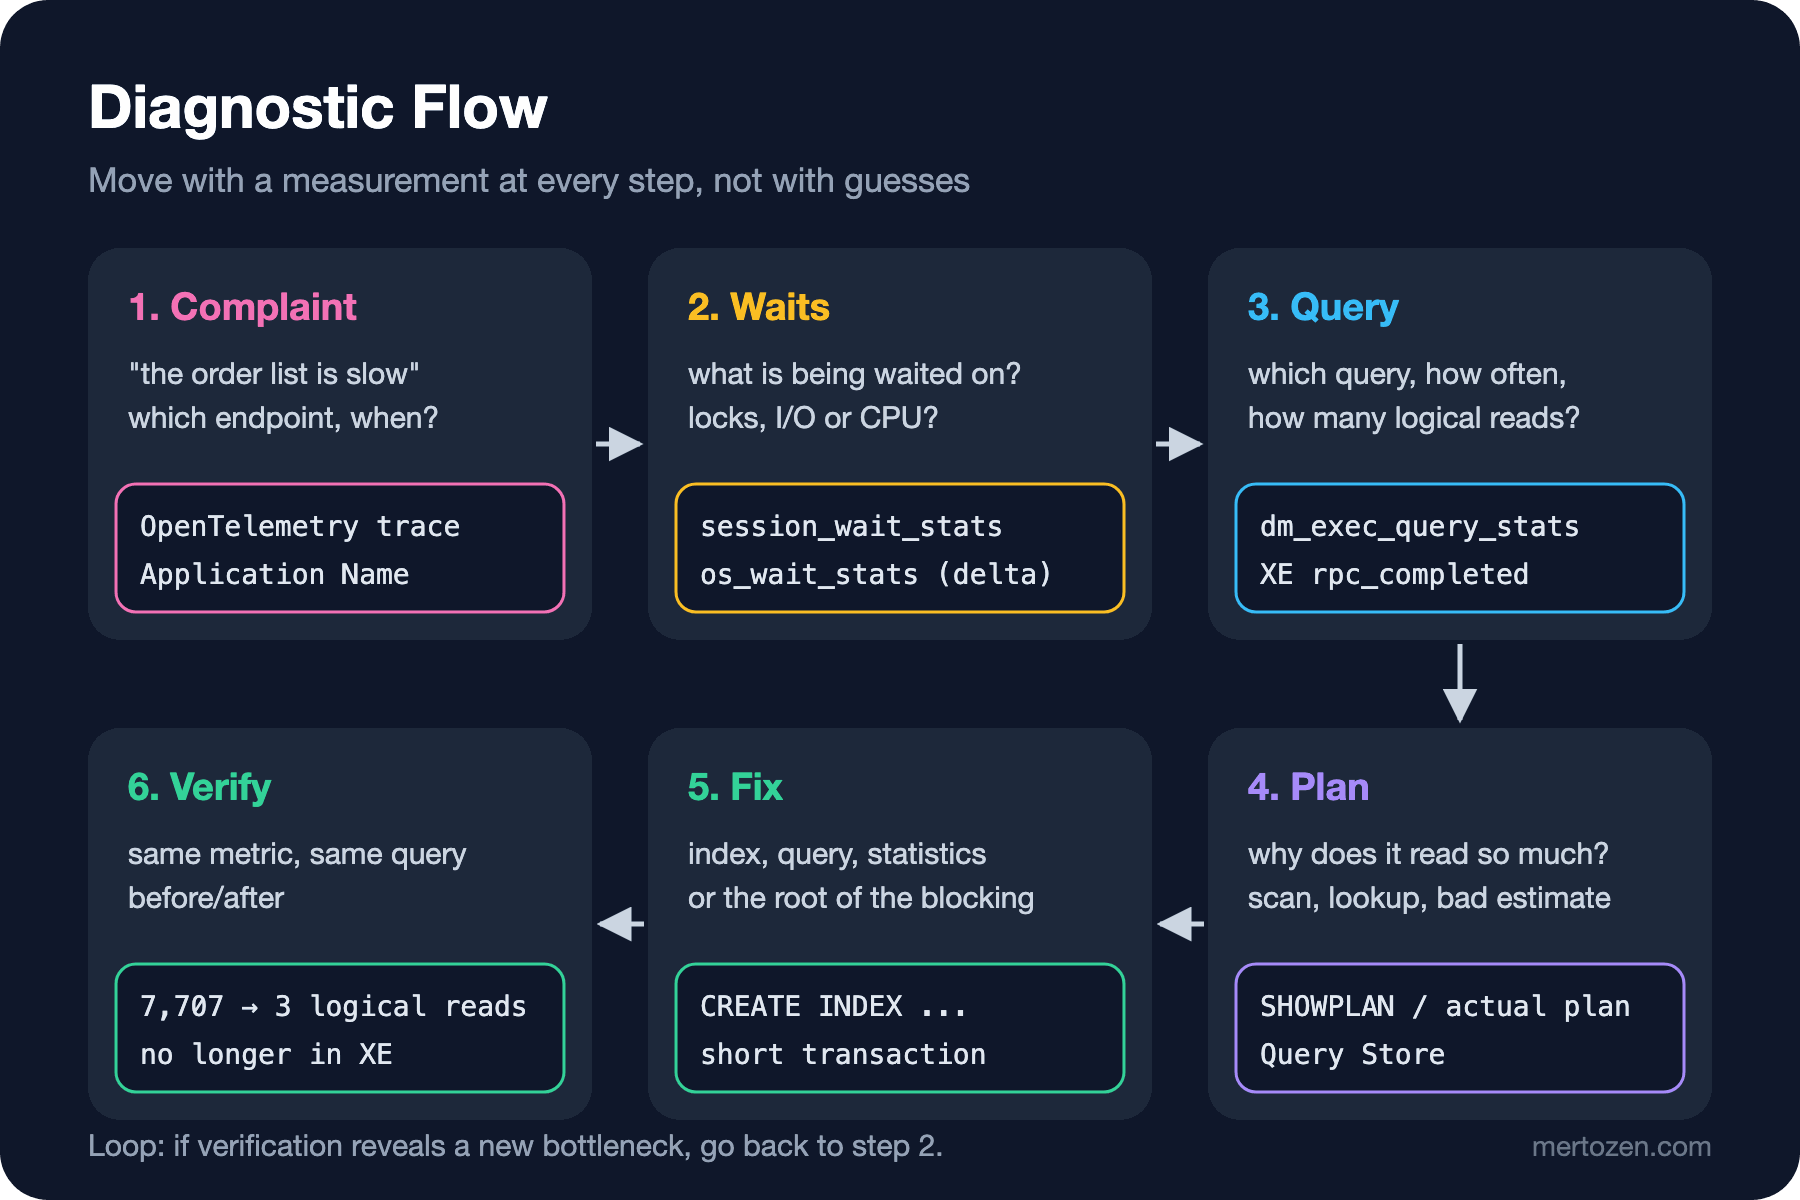
The plan shows that the status list scans the clustered index from start to end; there's no index on Status. We apply the fix, drop the copy index too, and run the same workload again:
CREATE INDEX IX_Orders_Status_CreatedAt ON dbo.Orders (Status, CreatedAt) INCLUDE (TotalAmount);
DROP INDEX IX_Orders_CustomerId_Copy ON dbo.Orders;
execution_count|avg_logical_reads|avg_rows|statement_text
---------------|-----------------|--------|--------------
4|7708|4458|SELECT OrderId, CreatedAt, TotalAmount FROM dbo.Orders WHERE CustomerId = @custo
4|6|1|SELECT OrderId, CreatedAt, TotalAmount FROM dbo.Orders WHERE OrderNumber = @numb
5|3|20|SELECT TOP (20) OrderId, CreatedAt, TotalAmount FROM dbo.Orders WHERE Status = @The status list went from 7,707 down to 3 logical reads and no longer shows up in the Extended Events session; in the restarted session only the four executions of the customer query remain. Verification is done with the same metric as the fix: not "it feels faster" but "same query, same measure, 7,707 before, 3 after". The customer query left in the list is the candidate for the next round: a table scan for 4,458 rows is the very tipping point topic from post 3 of the series.
What's Different in SQL Server 2019/2022
Wait statistics, DMVs and Extended Events work the same way in 2019 and 2022; all the queries in this post are valid on those versions. The differences: time-bound sessions with MAX_DURATION are specific to 2025. SQL Server 2019 brought the LAST_QUERY_PLAN_STATS database setting and the sys.dm_exec_query_plan_stats DMV to always keep the last actual plan; 2022 turned Query Store on by default for new databases. In 2025, with optimized locking on, you see blocking as LCK_M_S_XACT_* waits (post 13); monitoring that only looks at LCK_M_U/LCK_M_X misses them.
Watch Out in Production
Keep a baseline. Without knowing the "normal" wait profile and the list of the most expensive queries, you can't recognize "abnormal". A small job that writes hourly wait deltas and Query Store's top queries to a table provides the most valuable data at the first complaint.
Keep Extended Events narrow. Put the filter on the event's own fields (logical_reads, duration, database_name), add only the actions you need, and use event_file instead of a ring buffer for persistent analysis. A session that collects everything can be a bigger load than the problem it diagnoses.
Make the application identifiable. A separate Application Name for each service, and a separate SQL user if possible. Seeing SQLCMD or ".Net SqlClient Data Provider" in a blocking chain or in Extended Events means leaving half the job to guesswork.
Make the fix with a single change. If you add an index, change the query and update statistics at the same time, you can't know which one helped. One change, one measurement.
Common Pitfalls
Reading cumulative wait statistics. The raw values of sys.dm_os_wait_stats include months ago too; on their own they say nothing. Always look at the difference between two moments.
Thinking CXPACKET is a "bad wait". It's the natural consequence of parallel plans. The problem isn't parallelism but the unnecessarily large scan that has to run in parallel; lowering MAXDOP hides the symptom.
Applying missing index suggestions in bulk. sys.dm_db_missing_index_details produces a separate suggestion for each query; most are similar, and adding all of them multiplies the write cost. Evaluate suggestions per query and consider widening existing indexes first.
Treating duration as the only metric. A query's duration varies with the current load, how warm the cache is, and blocking. Logical reads, row counts and plan operators are repeatable; show the effect of a fix with them.
A Small Experiment
★☆☆ Add the sql_statement_completed event to the sqls_18_slow session and examine how the statements inside a stored procedure show up separately. How does it differ from rpc_completed?
★★☆ Turn the wait delta query into a procedure and call it over a one-minute window while the blocking chain demo from post 11 is running. Which wait type comes out on top?
★★★ In an ASP.NET Core application, add an Entity Framework Core (EF Core) interceptor that writes the request's trace id to SQL Server with SET CONTEXT_INFO when the connection opens, and connect a trace directly to an Extended Events event by adding the sqlserver.context_info action to the session.
The diagnostic method doesn't depend on the version; but the version decides which tools you have. In the last post of the series we learn to read older SQL Servers: how the engine changed from 2016 to 2025, what the compatibility level means, and a plan for doing an upgrade safely with Query Store.