

Query Store and Intelligent Query Processing: Finding Regressions, Forcing Plans and Hinting Without Code Changes
Query Store keeps query texts, plans and runtime statistics durably in the database, so it answers the "what was it like yesterday" question the plan cache forgets, and lets you force a plan and add hints without changing code. A regression query, the price of plan forcing, FORCE_LAST_GOOD_PLAN, RECOMPILE on an EF Core query via a Query Store hint, 2025's ABORT_QUERY_EXECUTION and the IQP family.
Version note: The T-SQL (Transact-SQL, Microsoft's dialect of SQL (Structured Query Language)) examples in this post were run on SQL Server 2025 CU10 (17.0.5035.5, Enterprise Developer Edition, compatibility level 170), and the C# examples with .NET 10, Entity Framework Core (EF Core) 10.0.14 and Dapper 2.1.89.
Guess First
On Monday morning the customer panel's "my orders" endpoint slowed down. No deploy over the weekend, no index changes, the same data. The dbo.GetCustomerOrders procedure from the previous post (with PSP (Parameter Sensitive Plan) optimization off in this experiment too) ran ten times for customer 42; then a weekend maintenance job marked the procedure for recompilation, the first request came from customer 1 (200,000 orders), and after that small customers called it ten more times. The plan cache only shows you the current plan. So where is the answer to "what was it like yesterday"? Guess, then look at Query Store's answer:
query_id plan_id is_forced_plan executions avg_logical_reads max_logical_reads
-------- ------- -------------- ---------- ----------------- -----------------
1        1       0              10         1513.2            1536
1        2       0              11         7707.0            7707
Same query (query_id = 1), two plans. Plan 1 ran ten times with an average of 1,513 logical reads; plan 2 arrived after the recompile and read 7,707 on every call, small customers included. The plan cache is cleared on restart, under memory pressure and on recompile; Query Store keeps query texts, plans and runtime statistics durably inside the database. In this post we discuss how Query Store is built, finding regressions, forcing plans, automatic tuning, hinting without code changes and the IQP (Intelligent Query Processing) family built on top of all this.
How Query Store Is Built and Its Defaults
Since SQL Server 2022, Query Store is on by default for new databases. The settings of our sqls_08 database:
SELECT actual_state_desc, query_capture_mode_desc, size_based_cleanup_mode_desc, max_storage_size_mb,
       interval_length_minutes, flush_interval_seconds, stale_query_threshold_days,
       max_plans_per_query, wait_stats_capture_mode_desc
FROM sys.database_query_store_options;
actual_state_desc query_capture_mode_desc size_based_cleanup_mode_desc max_storage_size_mb interval_length_minutes
----------------- ----------------------- ---------------------------- ------------------- -----------------------
READ_WRITE AUTO AUTO 1000 60
flush_interval_seconds stale_query_threshold_days max_plans_per_query wait_stats_capture_mode_desc
---------------------- -------------------------- ------------------- ----------------------------
900 30 200 ONQuery Store collects three things. Query text and query (sys.query_store_query_text, sys.query_store_query), the plans compiled for each query (sys.query_store_plan), and runtime statistics for each plan split into time intervals (60 minutes here) (sys.query_store_runtime_stats and sys.query_store_wait_stats): execution count, duration, CPU (Central Processing Unit), logical reads, row count, memory grant and wait categories. Data is gathered in memory and written to disk every 900 seconds; to avoid waiting in my experiments I called sys.sp_query_store_flush_db. AUTO capture mode skips insignificant, very cheap or one-off queries, so an application raining ad hoc queries does not fill up Query Store. When it reaches 1,000 MB the oldest data is cleaned up; if it fills up and cannot clean up, Query Store switches itself to READ_ONLY, which you need to monitor.
Finding Regressions
The "Regressed Queries" and "Top Resource Consuming Queries" reports in SSMS (SQL Server Management Studio) are built on these views. Where you cannot open the reports, you can query the same information yourself; the view that produced the opening table:
CREATE OR ALTER VIEW dbo.QsPlans AS
SELECT q.query_id, p.plan_id, p.is_forced_plan,
       SUM(rs.count_executions) AS executions,
       CAST(SUM(rs.avg_logical_io_reads * rs.count_executions) / SUM(rs.count_executions) AS decimal(12,1)) AS avg_logical_reads,
       MAX(rs.max_logical_io_reads) AS max_logical_reads
FROM sys.query_store_query AS q
JOIN sys.query_store_query_text AS qt ON qt.query_text_id = q.query_text_id
JOIN sys.query_store_plan AS p ON p.query_id = q.query_id
JOIN sys.query_store_runtime_stats AS rs ON rs.plan_id = p.plan_id
WHERE q.object_id = OBJECT_ID('dbo.GetCustomerOrders')
GROUP BY q.query_id, p.plan_id, p.is_forced_plan;
What we call a regression is a newly arrived plan for the same query_id being noticeably more expensive than the old one. Here plan 2 is five times more expensive on average. Note: the logical reads Query Store counts can differ slightly from what STATISTICS IO shows (1,513 versus 1,460 for plan 1); compare within the same source. For stored procedures you search by object_id, for queries coming from an ORM (Object-Relational Mapping) by query text or query_hash; we will see an example of the latter with EF Core below.
You also need to know a query's identity in Query Store. A query_id is the combination of the query text and the context it was compiled in (SET options, database, parameter definitions). If you run the same text from two clients with different ARITHABORT settings, you see two separate query_ids; that is the classic reason why SSMS and the application get different plans for the same query. Queries that differ only in their literals share a common query_hash; in an application raining ad hoc queries, grouping total cost by query_hash reveals the single shape behind thousands of distinct queries.
Forcing a Plan
The fastest intervention is to force the known good plan:
EXEC sys.sp_query_store_force_plan @query_id = 1, @plan_id = 1;

SET STATISTICS IO ON;
EXEC dbo.GetCustomerOrders 42;
EXEC dbo.GetCustomerOrders 1;
Table 'Orders'. Scan count 1, logical reads 1460
Table 'Orders'. Scan count 1, logical reads 612850
plan_id is_forced_plan force_failure_count last_force_failure_reason_desc plan_forcing_type_desc
------- -------------- ------------------- ------------------------------ ----------------------
1 1 0 NONE MANUAL
2 0 0 NONE NONESmall customers are back to their old speed. But forcing a plan is a decision, not a free lunch: customer 1 now does 612,850 logical reads on every call, because the forced plan is bad for it. For regressions caused by parameter sniffing, forcing a plan means picking a side; if most of the workload is small customers, that may be the right choice, but make it knowingly. If the forced plan becomes invalid (for example, an index it uses is dropped), forcing fails, the query still runs, and force_failure_count and last_force_failure_reason_desc go up; you should monitor them.
Optimized plan forcing, introduced with SQL Server 2022, stores the plan's compilation steps as a "compile replay script" to speed up compiling the forced plan; sys.query_store_plan.has_compile_replay_script shows it. For our simple query compilation is cheap, so no script was created (the value is 0).
Automatic Tuning: FORCE_LAST_GOOD_PLAN
Query Store can automatically force the last good plan when a query's new plan gets noticeably worse:
SELECT name, desired_state_desc, actual_state_desc, reason_desc FROM sys.database_automatic_tuning_options;name desired_state_desc actual_state_desc reason_desc
-------------------- ------------------ ----------------- ---------------
FORCE_LAST_GOOD_PLAN DEFAULT OFF AUTO_CONFIGUREDIt is off by default on SQL Server; you turn it on with ALTER DATABASE CURRENT SET AUTOMATIC_TUNING (FORCE_LAST_GOOD_PLAN = ON);. When it is on, the engine detects regressions by CPU time, forces the last good plan and verifies whether forcing really helped; if it did not, it reverts the forcing. You can see its recommendations in sys.dm_db_tuning_recommendations even while it is off. According to the edition table, automatic tuning is Enterprise only. Because it relies on timing, I do not show a deterministic experiment on this emulated container.
Query Store Hints: Hinting Without Code Changes
Forcing a plan picked a side. In the previous post we saw that the most correct answer to sniffing for this query is OPTION (RECOMPILE). We can add that hint through Query Store without touching the procedure's code:
EXEC sys.sp_query_store_unforce_plan @query_id = 1, @plan_id = 1;
EXEC sys.sp_query_store_set_hints @query_id = 1, @query_hints = N'OPTION (RECOMPILE)';

SELECT query_hint_id, query_id, query_hint_text, source_desc FROM sys.query_store_query_hints;
query_hint_id query_id query_hint_text source_desc
------------- -------- ------------------ -----------
1 1 OPTION (RECOMPILE) User
Table 'Orders'. Scan count 1, logical reads 1460 /* customer 42 */
Table 'Orders'. Scan count 11, logical reads 7707 /* customer 1 */Both customers got their own best plan. Its real value, though, is for queries whose code you cannot change: queries EF Core generates, queries coming from inside a NuGet package, or ones you need to fix without waiting for a deploy. I repeated the same scenario with an EF Core query, with PSP off. The application code is the same throughout; we find the query in Query Store by its text and attach the hint:
async Task<int> LoadAsync(int customerId) =>
    (await ctx.Orders.Where(o => o.CustomerId == customerId)
        .OrderByDescending(o => o.CreatedAt)
        .Select(o => new { o.OrderId, o.OrderNumber, o.Status, o.CreatedAt, o.TotalAmount })
        .ToListAsync()).Count;

await LoadAsync(1);   /* the big customer compiles the plan */
Console.WriteLine($"customer 42: {await LoadAsync(42)} rows, {await LastReadsAsync(conn)} logical reads");

long queryId = await conn.QuerySingleAsync<long>("""
    SELECT TOP (1) q.query_id
    FROM sys.query_store_query AS q
    JOIN sys.query_store_query_text AS qt ON qt.query_text_id = q.query_text_id
    WHERE qt.query_sql_text LIKE '%WHERE \[o\].\[CustomerId\] = @customerId%' ESCAPE '\'
    ORDER BY q.query_id DESC
    """);
await conn.ExecuteAsync("EXEC sys.sp_query_store_set_hints @query_id = @queryId, @query_hints = N'OPTION (RECOMPILE)'",
    new { queryId });
customer 42: 473 rows, 7707 logical reads
query_id 8: OPTION (RECOMPILE) attached
customer 42: 473 rows, 1536 logical reads
customer 1: 200000 rows, 7707 logical readsI read the logical reads from Query Store's last_logical_io_reads column. Before the hint, the small customer read 7,707 pages with the big customer's plan; after the hint, 1,536. Nothing changed on the EF Core side. Query Store hints support hints such as RECOMPILE, MAXDOP, USE HINT and QUERY_OPTIMIZER_COMPATIBILITY_LEVEL, which changes the compatibility level per query. One warning: the hint is tied to the query text. If the EF Core version changes and even one space changes in the SQL it generates, a new query_id appears and the hint no longer applies. Keep a record of your hints and check them after upgrades.
ABORT_QUERY_EXECUTION: Stopping a Problem Query
SQL Server 2025 added a new option to Query Store hints: blocking future executions of a specific query. For example, a heavy report that someone runs again and again from a BI (Business Intelligence) tool during business hours:
EXEC sys.sp_query_store_set_hints @query_id = @qid,
     @query_hints = N'OPTION (USE HINT(''ABORT_QUERY_EXECUTION''))';

SELECT b.Category, SUM(oi.Quantity * oi.UnitPrice) AS Revenue
FROM dbo.OrderItems AS oi JOIN dbo.Books AS b ON b.BookId = oi.BookId
GROUP BY b.Category;
Msg 8778, Level 16, State 1, Line 1
Query execution has been aborted because the ABORT_QUERY_EXECUTION hint was specified.The query no longer runs, and the client gets an understandable error. This is an emergency brake: it does not fix the problem, but it protects the system until you do. It is removed with sp_query_store_clear_hints.
The Intelligent Query Processing Family
Most of the feedback features we saw in previous posts rely on Query Store, and they are all part of the family called IQP. Which feature arrived with which version and compatibility level:
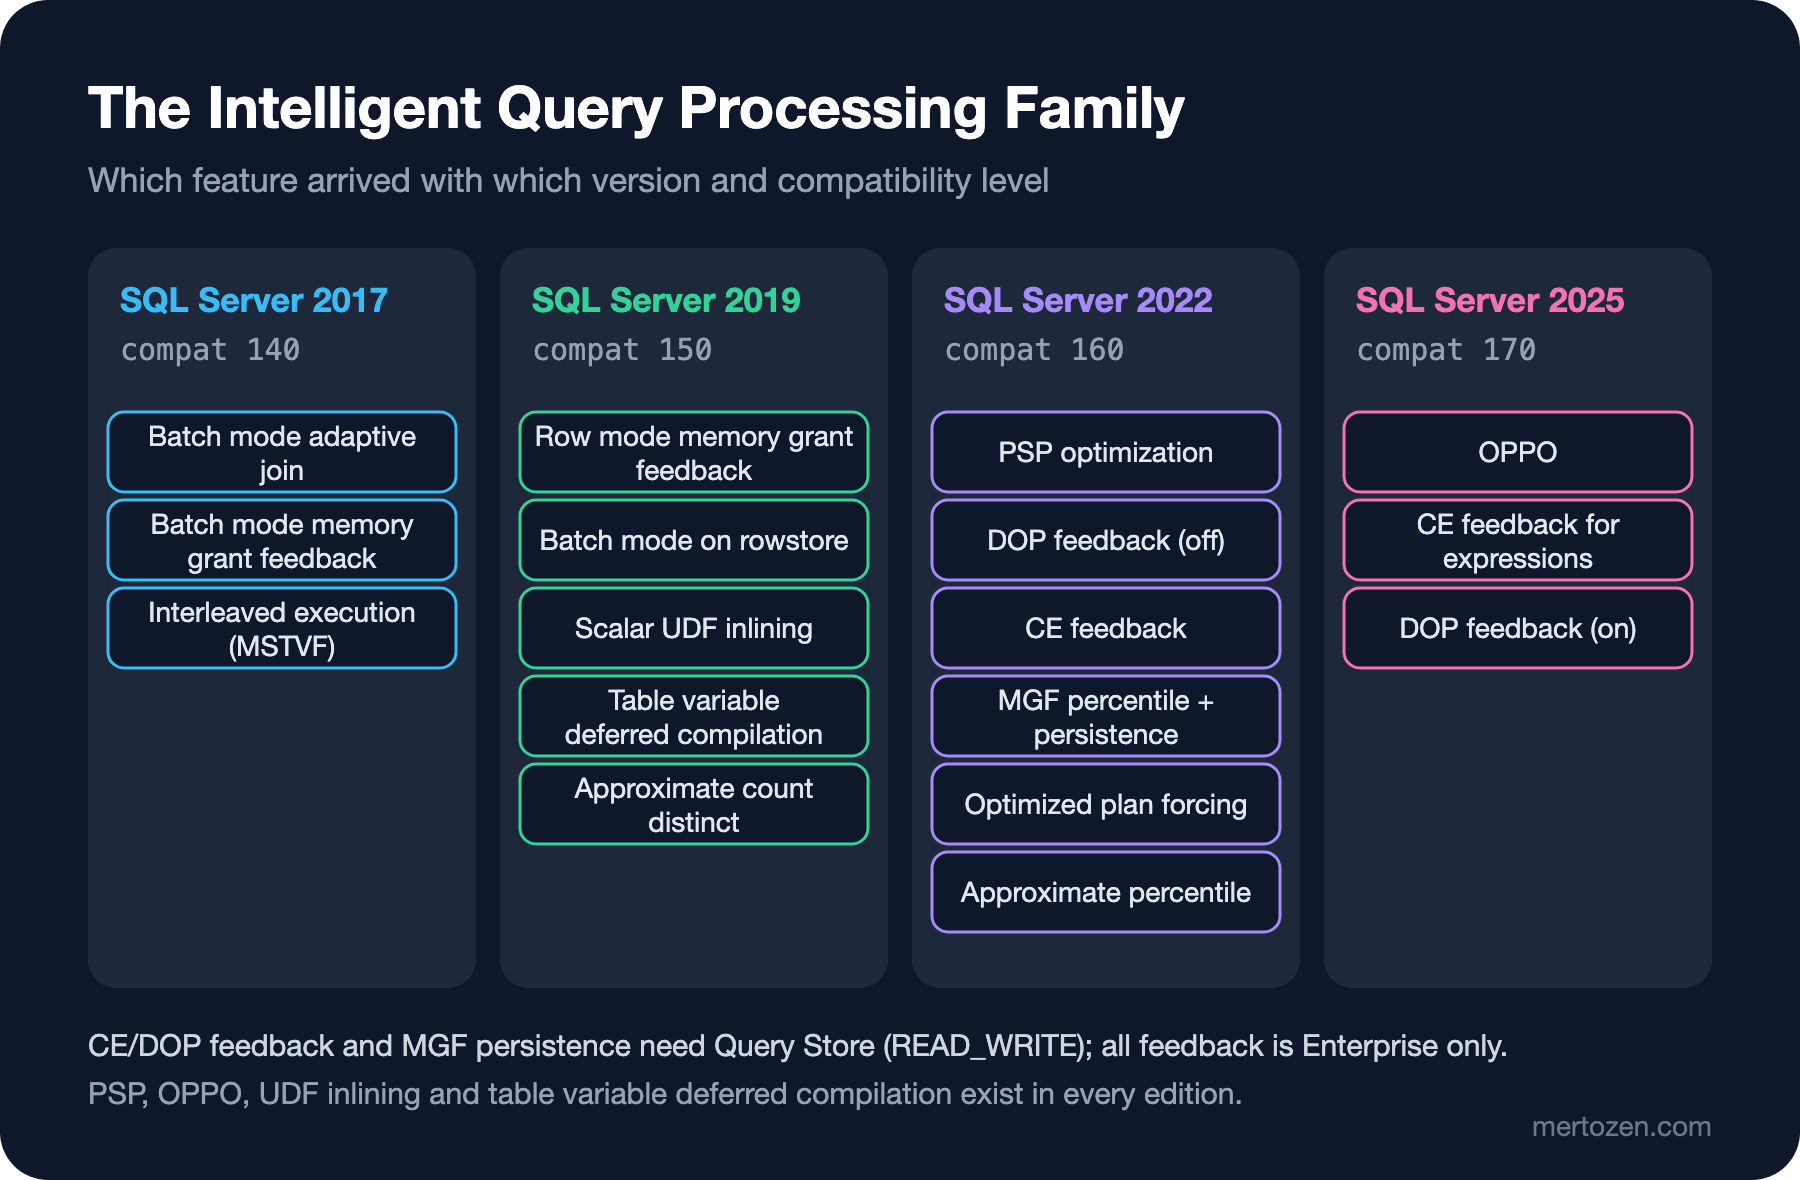
The practical meaning of this table: most of these features arrive just by raising the compatibility level, without code changes; but the same upgrade also changes the plans of some queries. Query Store is the tool both for seeing that change and for undoing it; the upgrade plan in the last post of the series relies on exactly that.
How SQL Server 2019/2022 differ: Query Store has existed since 2016, but being on by default for new databases arrived with 2022; on 2019 you have to turn it on yourself. Query Store hints and optimized plan forcing came with 2022; on 2019, the way to add a hint without touching code was plan guides. ABORT_QUERY_EXECUTION and Query Store on by default on readable secondaries exist only in 2025.
In Production
Monitor Query Store's health. Make sure actual_state_desc is READ_WRITE and current_storage_size_mb is not hitting the limit; a Query Store that silently fell to READ_ONLY will not have recorded the regression on exactly the day you need it.
Keep an inventory of forced plans and hints. sys.query_store_plan.is_forced_plan and sys.query_store_query_hints should be reviewed regularly. A plan forced a year ago can be the worst plan today, now that the data has changed.
Compare before and after a deploy. For every plan-affecting change, such as an index change, a compatibility level upgrade or an ORM version upgrade, Query Store is an A/B testing tool: compare the cost of the same query_hash before and after.
Choose the capture mode for your workload. AUTO is the right default for most systems; but on a system that produces a large number of short, distinct queries, CUSTOM capture mode lets you set your own thresholds for execution count, total compile time and total CPU. ALL is only for short diagnostic sessions; left on permanently, it fills Query Store quickly.
Common Pitfalls
Treating plan forcing as a permanent fix. Forcing is a patch; if you do not fix the cause (a missing index, sniffing, stale statistics), the same problem returns in another form as the data changes.
Turning Query Store off over performance concerns. With AUTO capture mode its cost is small for most workloads; if you turn it off, you lose your most valuable diagnostic tool and the persistence of the feedback features.
Adding hints to ORM queries and forgetting them. When the text generated by EF Core or Dapper changes, the hint is silently disabled; after an upgrade, check whether the query_ids in sys.query_store_query_hints still run.
Declaring a regression from a single measure. Look at execution count and maximum next to average logical reads: in our example, plan 2's average was spoiled not by the big customer's single execution but by ten executions from small customers.
A Small Experiment
★☆☆ Create the dbo.QsPlans view in your own database and run GetCustomerOrders with different customers to see how many plans are created. How does the table change with PSP on?
★★☆ Read plan 2's wait categories from sys.query_store_wait_stats. Find which wait category the parallel scan is recorded under.
★★★ Add OPTION (USE HINT(''QUERY_OPTIMIZER_COMPATIBILITY_LEVEL_150'')) as a Query Store hint for GetCustomerOrders. How did the plan and PSP behavior change? How would you use this technique during a compatibility level upgrade?
So far we have been on the read side. In the next post we move to the engine of the write side: transactions, the transaction log, XACT_ABORT, savepoints and Accelerated Database Recovery.