

Async and Multi-Threaded Debugging: Parallel Stacks, the Tasks Window, Deadlocks and Race Conditions
In an async hang, the waiting code isn't on any thread's stack; you need the Tasks view of Parallel Stacks or the async chain in a dump. We read a lock-order deadlock and a .Result sync-over-async deadlock through dotnet-stack output, measure thread pool starvation, show Dictionary, counter and check-then-act race conditions with real runs, and explain forcing a race with freeze/thaw.
Version note: The code in this post was built and run with .NET 10 and dotnet-stack 10.0. The Parallel Stacks, Tasks and Threads windows of Visual Studio 2026 were not run on this machine (macOS); their description comes from Microsoft Learn. The thread stacks were taken from the same processes with dotnet-stack.
Guess First
Bookstore's checkout occasionally freezes in the test environment: the request goes out, the response never comes back, and CPU (Central Processing Unit) usage is close to zero. You attach the debugger and hit Break All. In the Call Stack window the main thread is waiting in Main, and none of the methods like CheckoutAsync or WaitForPaymentAsync are on any thread's stack. Where do you think the code is stuck? And which window should you look at in this situation?
This post is about two kinds of bugs: bugs where something never happens (deadlocks, hangs) and bugs where something happens twice (race conditions). Async itself is covered in the C# Async series; the focus here is seeing these bugs and proving them.
Reading Async Call Stacks: No Thread, No Stack
We reproduced the situation above for real with a small program. A checkout whose payment callback never arrives:
public static class AsyncHang
{
    private static readonly TaskCompletionSource<string> PaymentCallback = new();

    public static async Task RunAsync() => Console.WriteLine(await CheckoutAsync(1042));

    private static async Task<string> CheckoutAsync(int orderId)
    {
        string paymentId = await WaitForPaymentAsync(orderId);
        return $"order {orderId} paid with {paymentId}";
    }

    private static async Task<string> WaitForPaymentAsync(int orderId)
    {
        await Task.Yield();
        return await PaymentCallback.Task;
    }
}
While the process was hanging, we took a snapshot of every thread's stack with dotnet-stack report -p <pid>. The main thread's stack (the idle stacks of the thread pool workers are omitted):
Thread (0xCE3379):
  [Native Frames]
  System.Private.CoreLib!System.Threading.Monitor.Wait(class System.Object,int32)
  System.Private.CoreLib!System.Threading.ManualResetEventSlim.Wait(int32,value class System.Threading.CancellationToken)
  System.Private.CoreLib!System.Threading.Tasks.Task.SpinThenBlockingWait(int32,value class System.Threading.CancellationToken)
  System.Private.CoreLib!System.Threading.Tasks.Task.InternalWaitCore(int32,value class System.Threading.CancellationToken)
  System.Private.CoreLib!System.Threading.Tasks.Task.InternalWait(int32,value class System.Threading.CancellationToken)
  System.Private.CoreLib!System.Runtime.CompilerServices.TaskAwaiter.HandleNonSuccessAndDebuggerNotification(class System.Threading.Tasks.Task,value class System.Threading.Tasks.ConfigureAwaitOptions)
  Bookstore.Concurrency!Program.<Main>(class System.String[])
CheckoutAsync and WaitForPaymentAsync are on no thread at all. That's not a gap, it's the nature of async: a method that is awaiting something not yet completed gives its thread back. What remains is a state machine object on the heap and a continuation saying "resume me when this completes". That's why every thread-oriented tool (the Call Stack window, the Threads view of Parallel Stacks, dotnet-stack) says "nobody is doing anything" in an async hang, and it's right: nobody is doing anything, everybody is waiting for something.
The question becomes: which task is waiting for which task? You look for that answer in the task chain, not in the threads. In Visual Studio that's the job of the Tasks view of Parallel Stacks; without an IDE (Integrated Development Environment), it's the job of the dumpasync command on a dump. The dump side is in the ninth post of this series.
Parallel Stacks and the Tasks Window
Parallel Stacks (Debug > Windows > Parallel Stacks) only opens while the debugger is paused, and it has three views. The Threads view shows the call stacks of all threads in a single graph; it gathers threads that share the same stack into one node and puts a count such as "4 Threads" in the node header. In an app with a hundred threads this grouping is a lifesaver: if 96 threads are idle in the same place they form a single box, and four threads stopped somewhere else stand out immediately. The Tasks view draws the same graph for async tasks; according to the docs it's the most helpful view for .NET apps that use async/await, because it shows the CheckoutAsync → WaitForPaymentAsync chain that was invisible in the example above as a logical call stack. Method View puts the method you select at the center and shows everything that calls it and everything it calls.
The Tasks window (Debug > Windows > Tasks) gives the same information as a table. The values in the Status column are what you really need to read:
- Scheduled: queued to run, doesn't have a thread or a stack yet.
- Active: was running code before the debugger broke in.
- Blocked: waiting for an event, a lock or another task by blocking its thread.
- Awaiting: waiting with async/await, without blocking a thread.
- Deadlocked: its thread is deadlocked with another thread.
Deadlock detection relies on Windows' WCT (Wait Chain Traversal) mechanism; as the docs warn, it's only reported for tasks blocked on synchronization primitives that WCT supports. So "it doesn't say Deadlocked" does not mean "there's no deadlock".
Two practical details. When the debugger is paused on one thread, F5 may land on the next breakpoint on a different thread; to follow the same thread you add a ThreadId filter or condition to the breakpoint. If everything is hung, no breakpoint fires at all; Break All (Ctrl+Alt+Break) stops every thread where it is. Since Visual Studio 2022 17.13, with Copilot enabled, nodes in the Threads view get short AI (Artificial Intelligence) generated thread descriptions and there's a Summarize button. Such a summary speeds up readings like "thread 12 is waiting for the order lock", but verify what you read against the stacks above.
Case 1: A Lock-Order Deadlock
Restocking and checkout run on separate threads and both take two locks, but in opposite order:
public static class RestockService
{
    public static void Restock()
    {
        lock (Inventory.StockLock)
        {
            LockOrder.WaitForOther();
            // asks for the order lock while holding the stock lock
            lock (Orders.OrderLock)
            {
                Console.WriteLine("restocked");
            }
        }
    }
}

public static class CheckoutService
{
    public static void Checkout()
    {
        lock (Orders.OrderLock)
        {
            LockOrder.WaitForOther();
            // asks for the stock lock while holding the order lock: opposite order
            lock (Inventory.StockLock)
            {
                Console.WriteLine("checked out");
            }
        }
    }
}
WaitForOther uses a Barrier to make the two threads meet after taking their first lock; in production this "meeting" happens by chance, at the busiest moment. Here it happens on every run. Two worker threads from the process's dotnet-stack output:
Thread (0xCE31F4):
  [Native Frames]
  System.Private.CoreLib!System.Threading.Monitor.Enter_Slowpath(class System.Object)
  System.Private.CoreLib!System.Threading.Monitor.Enter(class System.Object,bool&)
  Bookstore.Concurrency!Bookstore.Concurrency.RestockService.Restock()
  System.Private.CoreLib!System.Threading.Thread.StartCallback()

Thread (0xCE31F5):
  [Native Frames]
  System.Private.CoreLib!System.Threading.Monitor.Enter_Slowpath(class System.Object)
  System.Private.CoreLib!System.Threading.Monitor.Enter(class System.Object,bool&)
  Bookstore.Concurrency!Bookstore.Concurrency.CheckoutService.Checkout()
  System.Private.CoreLib!System.Threading.Thread.StartCallback()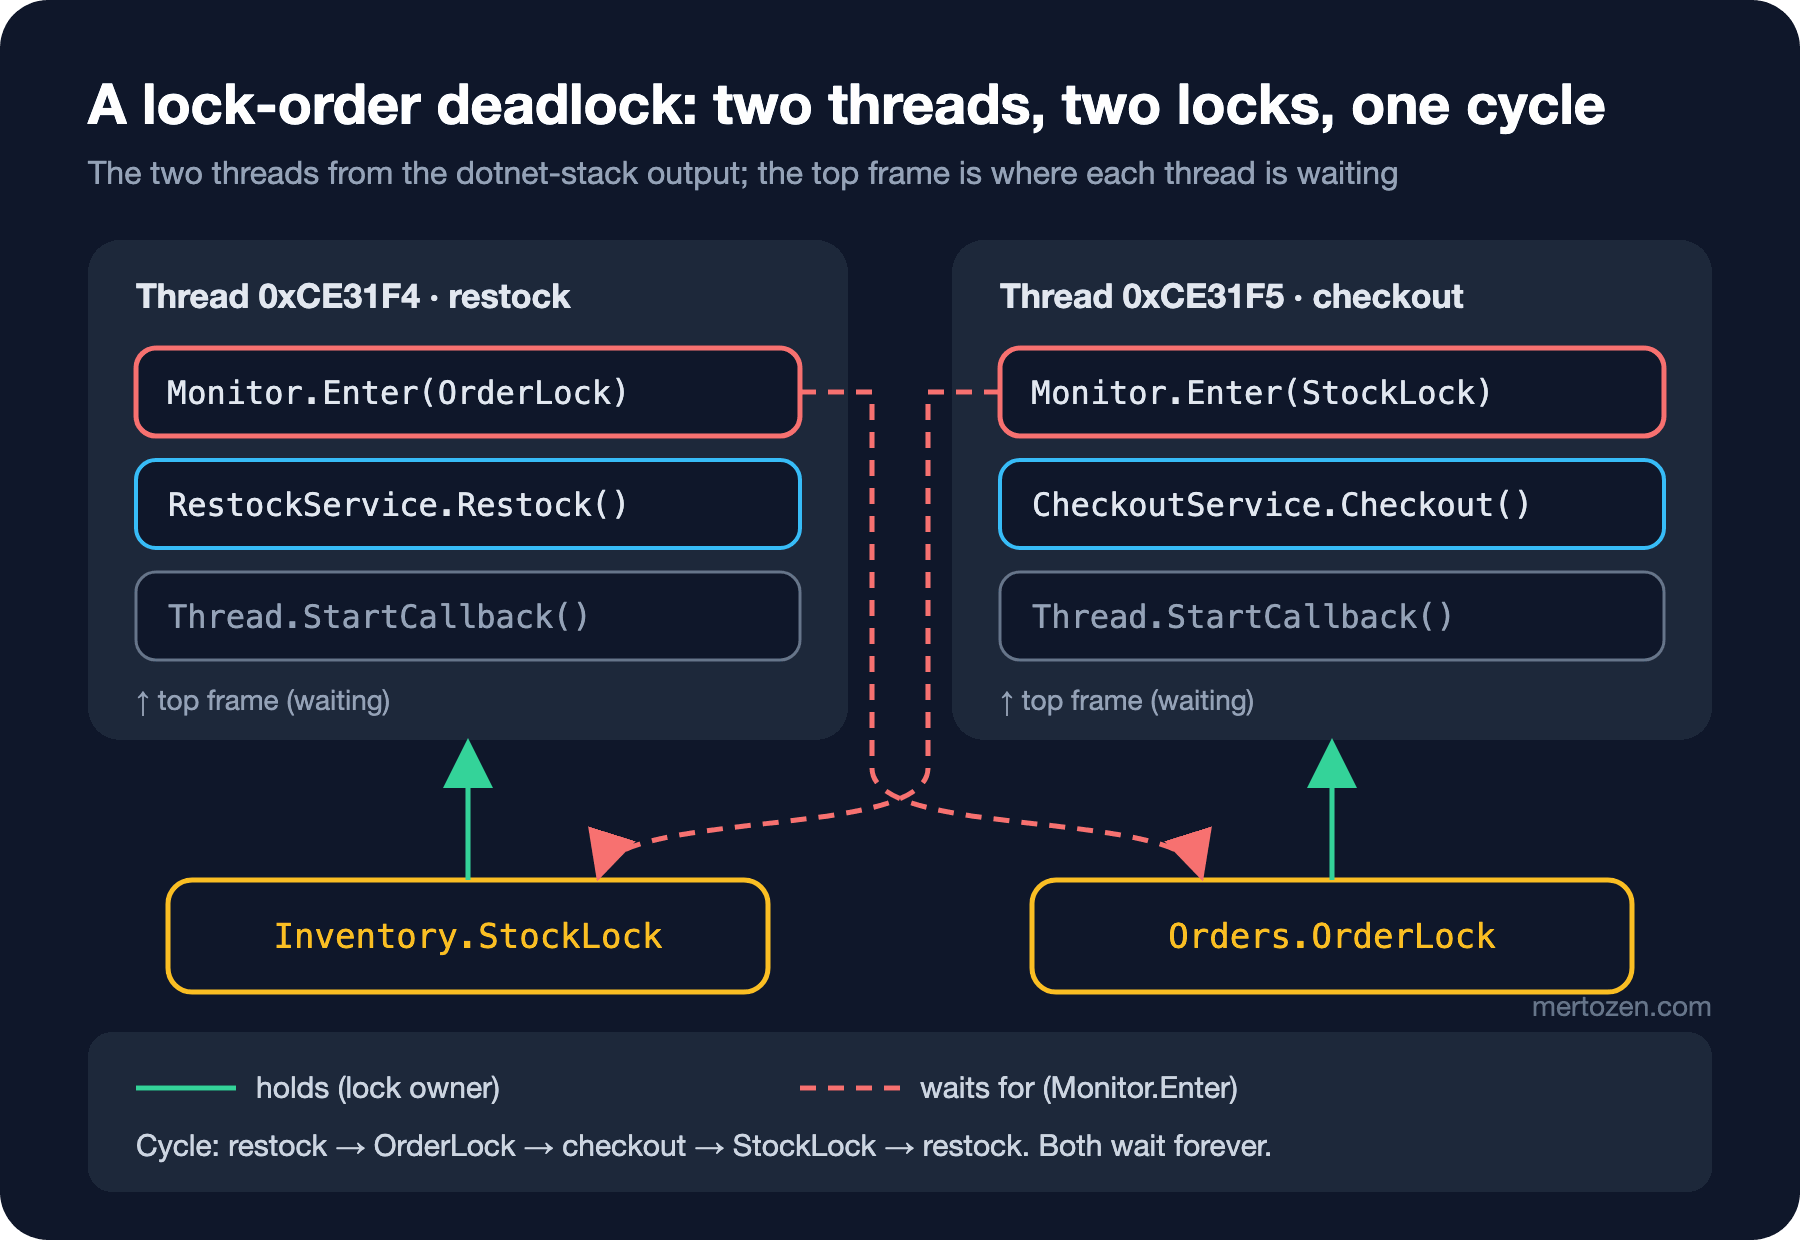
Here's how to read it: both threads are in Monitor.Enter, meaning they're waiting on a lock statement, and Enter_Slowpath tells you the lock is held by someone else. One comes from Restock, the other from Checkout. The stack doesn't say which lock they're waiting for or which one they hold; we infer that from the code (the lock names in the figure are that inference). On a dump, the syncblk command shows the lock owner directly; that's in the ninth post too. In Visual Studio, after Break All in the same situation, the two threads appear as separate nodes in the Threads view, and according to the docs a status icon marks the deadlock for .NET.
The fix: every code path that takes more than one lock takes them in the same global order (for example, always StockLock first, then OrderLock). Better still is a design that doesn't need two locks at once: put the stock and order updates behind a single lock or a database transaction. Taking the lock with Monitor.TryEnter(lockObject, TimeSpan.FromSeconds(5)) doesn't fix the deadlock, but it turns an endless freeze into a timeout that lands in the log; even that is a big win for diagnosis.
Case 2: Sync-over-Async and SynchronizationContext
The second classic: waiting on an async method with .Result. The theory is in the C# Async series post "C# Deadlocks, SynchronizationContext and ConfigureAwait". Console and ASP.NET Core apps have no default SynchronizationContext, so to see the deadlock we set up a context that imitates a UI (User Interface) thread:
public sealed class BlockingQueueContext : SynchronizationContext
{
    // imitates a UI thread: continuations only run when this thread is free
    private readonly System.Collections.Concurrent.BlockingCollection<(SendOrPostCallback, object?)> _queue = [];

    public override void Post(SendOrPostCallback d, object? state) => _queue.Add((d, state));
}

public static class SyncOverAsync
{
    public static void Run()
    {
        SynchronizationContext.SetSynchronizationContext(new BlockingQueueContext());
        decimal total = PriceService.GetTotalAsync(1042).Result;
        Console.WriteLine(total);
    }
}
Thread (0xCE32BC):
[Native Frames]
System.Private.CoreLib!System.Threading.Monitor.Wait(class System.Object,int32)
System.Private.CoreLib!System.Threading.ManualResetEventSlim.Wait(int32,value class System.Threading.CancellationToken)
System.Private.CoreLib!System.Threading.Tasks.Task.SpinThenBlockingWait(int32,value class System.Threading.CancellationToken)
System.Private.CoreLib!System.Threading.Tasks.Task.InternalWaitCore(int32,value class System.Threading.CancellationToken)
System.Private.CoreLib!System.Threading.Tasks.Task.InternalWait(int32,value class System.Threading.CancellationToken)
System.Private.CoreLib!System.Threading.Tasks.Task`1[System.Decimal].GetResultCore(bool)
System.Private.CoreLib!System.Threading.Tasks.Task`1[System.Decimal].get_Result()
Bookstore.Concurrency!Bookstore.Concurrency.SyncOverAsync.Run()What sets this stack apart from the lock deadlock is get_Result() and InternalWait: the thread isn't waiting for a lock, it's waiting for a task to finish. The task, in turn, has posted its continuation after Task.Delay to the context, and that continuation can't run until the context's only thread (this thread) is free. There's no second relevant thread in the process; there's a single thread waiting on its own queue. The other threads are thread pool workers and the timer thread, all idle.
The fix is await all the way up the chain: make Run an async Task and write await PriceService.GetTotalAsync(1042). In library code, ConfigureAwait(false) prevents this deadlock on the library side, but it doesn't legitimize the caller's .Result.
Symptoms of Thread Pool Starvation
Since ASP.NET Core has no context, .Result doesn't deadlock there, but something else happens: every blocking call holds a thread pool thread hostage, and the continuation of the blocked task also needs a thread pool thread. We started N Task.Run(() => GetTotalAsync(i).Result) calls at once and then measured how long it took an empty Task.Run to start running (10-core machine):
processors: 10, min worker threads: 10
0 blocking calls queued, a trivial Task.Run started after 1 ms, threads: 2
8 blocking calls queued, a trivial Task.Run started after 0 ms, threads: 10
50 blocking calls queued, a trivial Task.Run started after 217 ms, threads: 28
200 blocking calls queued, a trivial Task.Run started after 1478 ms, threads: 49
Once the number of blocking calls exceeds the minimum thread count (10), nothing throws; everything just slows down. The thread pool adds new threads gradually, and with 200 blocking calls an empty work item waits 1.5 seconds in the queue. In the debugger this shows up in Parallel Stacks as a single node of dozens of threads waiting on the same get_Result() stack. The production side of the diagnosis, the thread pool queue length in dotnet-counters and dotnet-trace, is in the tenth post of this series.
Race Conditions: A Dictionary, a Counter and Check-Then-Act
In a deadlock something never happened; in a race condition something happens twice or disappears as if it never happened. Three small experiments, all real runs:
Dictionary<int, int> soldByBook = [];
Parallel.For(0, 100_000, i =>
{
    int bookId = i % 1_000;
    soldByBook.TryGetValue(bookId, out int sold);
    soldByBook[bookId] = sold + 1;
});
AggregateException: InvalidOperationException: Operations that change non-concurrent collections must have exclusive access. A concurrent update was performed on this collection and corrupted its state. The collection's state is no longer correct.That's a lucky outcome: .NET's Dictionary noticed its internal structure was corrupted and threw an exception. You won't always be this lucky; the corruption can go unnoticed and carry on with wrong numbers. The moment you see the word "concurrent" in this exception message, know that the code writes to this collection from more than one thread.
Parallel.For(0, 1_000_000, _ =>
{
    sold++;
    Interlocked.Increment(ref safeSold);
});
sold++: 216,512, Interlocked: 1,000,000783,488 out of a million sales vanished, and there's no error. sold++ consists of read, increment, write; when two threads read the same value, one overwrites what the other wrote.
The third one, check-then-act, is the sneakiest. There's one book in stock and two customers reserve it at the same time:
public sealed class StockRoom(int stock)
{
    // test hook that holds both threads at the check line (like freezing a thread in the debugger)
    private readonly Barrier _bothChecked = new(2);

    public int Stock { get; private set; } = stock;

    public bool TryReserve(string customer)
    {
        if (Stock > 0)
        {
            _bothChecked.SignalAndWait();
            Stock--;
            return true;
        }
        return false;
    }
}
Ada: True, Alan: True, stock left: 0
Ada: True, Alan: True, stock left: 0
Ada: True, Alan: True, stock left: 0
Ada: True, Alan: True, stock left: -1
Ada: True, Alan: True, stock left: -1
Ada: True, Alan: True, stock left: 0In six runs out of six, the single book was sold to two customers. Worse, in four of them the stock shows 0: the second race in Stock-- also erased the trace of the oversell. Everything looks consistent in the report while a book is missing from the warehouse.
The Barrier here is the code equivalent of freeze/thaw in the debugger. In Visual Studio you get the same effect like this: put a breakpoint inside if (Stock > 0); when the first thread stops, Freeze it in the Threads window and continue with F5; the second thread reaches the same breakpoint. Both have passed the check; now you Thaw the first one and advance them one after the other, producing the race every time, in the order you choose. In the Tasks window you can also stop a task's thread with Freeze Assigned Thread. Once you've forced the race, it's time for a failing test: write an xUnit test with the same Barrier hook and verify the fix (check and decrement inside a lock, or UPDATE ... WHERE Stock > 0 in the database plus the affected row count) with that test.
In Production
Attaching a debugger to a frozen process in production and hitting Break All means stopping an already frozen system completely; health checks fail, the orchestrator kills the process, and the evidence dies with it. Collect evidence first: a stack snapshot with dotnet-stack (takes seconds, doesn't stop the process), and a dump if needed. Restarting is often the right call, but after, not before.
Timing bugs disappear under the debugger. Stopping at a breakpoint completely changes the relative timing of threads; the race window widens from milliseconds to hours or closes entirely. "I tried it in the debugger and it doesn't happen" is not evidence. For these bugs, use tracepoints, logs (with the thread ID) and dumps instead of the debugger.
Timeouts on locks are a safety net against deadlocks. When SemaphoreSlim.WaitAsync(timeout) or Monitor.TryEnter returns false, always log it: which lock, which operation, how long it waited. Instead of an endless freeze you get an error you can diagnose.
Race conditions show up under load. Code that runs a thousand times locally with one user can blow up in the first minute in production at a hundred requests per second. Look specifically for shared mutable state (a static Dictionary, a field in a singleton service) in code review; in ASP.NET Core, a field of a singleton service is a variable that every request writes to at the same time.
Common Pitfalls
Looking at thread stacks in an async hang and concluding "nothing is running, the problem is in an external system". In async code, pending work doesn't show up on threads; don't decide before looking at the Tasks view or the async chain in a dump.
"Fixing" a deadlock by adding Thread.Sleep or Task.Delay. It changes the timing and lowers the odds of the deadlock without removing the cycle; it comes back when the load goes up.
Replacing Dictionary with ConcurrentDictionary and calling the race closed. As long as TryGetValue and the following write remain two separate operations, the check-then-act race remains; you need an atomic method such as AddOrUpdate.
Freezing a thread while paused in the debugger and forgetting about it. A frozen thread doesn't continue; everything you see for the rest of the session is the result of that artificial state.
Trusting an AI thread summary as evidence. It saying "these two threads are deadlocked" doesn't replace reading the stacks and the code and verifying the lock order.
A Small Experiment
★☆☆ Make the lock order in CheckoutService.Checkout the same as in RestockService and run the program ten times. Does it ever freeze? Then remove the LockOrder.WaitForOther() calls, go back to the old, opposite-order code and run it a hundred times: how many times does it freeze?
★★☆ Fix StockRoom.TryReserve with a lock and write an xUnit test with the same Barrier hook: the test should be red before the fix and green after. How would you get the hook out of production code?
★★★ Repeat the starvation experiment with ThreadPool.SetMinThreads(200, 200). Does the delay disappear? Is that a fix or a way of hiding the symptom; what does it cost?
Stopping in the debugger hid half of the bugs in this post; we could only see the other half through stacks taken without stopping. In the next post we apply the same method to the frontend: hunting bugs in signals, change detection, RxJS and the HTTP (Hypertext Transfer Protocol) layer of an Angular app.