

Where Does a Slow Request Come From: Diagnosing the Network with curl -w, DevTools Timing and Wireshark
A slow request's time splits into DNS, TCP, TLS, server (TTFB) and download phases, and every phase has a recognizable signature. Five cases with curl -w under a 50 ms RTT via netem (no keep-alive, an IPv6 attempt, TLS 1.2, a slow server, a large response), .NET's System.Net metrics, dotnet-counters and a TLS key log file for Wireshark.
Version note: The measurements in this post were taken with curl 8.5.0 and .NET 10 in a mcr.microsoft.com/dotnet/sdk:10.0 container under a 50 ms RTT (round-trip time) added with Linux tc netem, and with dotnet-counters 10.0.750501 and OpenSSL 4.0.3 on macOS.
Guess First
A ticket from the support team: "The order summary page is slow, sometimes half a second." The only data the team attached is the curl -w output of a problematic request:
dns=0.000015 connect=0.051334 tls=0.108429 ttfb=0.466217 total=0.466325466 milliseconds in total. Is the problem in the network, in TLS (Transport Layer Security), in the server, or in the download? By the end of this post you'll read this line at a glance. Here we turn the pieces we saw throughout the series into a diagnosis method.
Splitting Latency into Phases
The time of an HTTP (Hypertext Transfer Protocol) request is made of phases added one after another: name resolution, the TCP (Transmission Control Protocol) connection, the TLS handshake, the server sending the first byte and the response downloading. The curl -w variables we saw in the first post give the moments these phases end, cumulatively from the start of the request. A phase's duration is the difference between two consecutive values:
| Phase | Calculation | Depends on |
|---|---|---|
| DNS (Domain Name System) | time_namelookup | The resolver and caches |
| TCP connect | time_connect − time_namelookup | 1 RTT (and failed address attempts) |
| TLS handshake | time_appconnect − time_connect | 1 RTT in TLS 1.3, 2 RTTs in TLS 1.2, plus CPU (Central Processing Unit) |
| Server (TTFB) | time_starttransfer − time_pretransfer | 1 RTT + the server's processing time |
| Download | time_total − time_starttransfer | Size, bandwidth, congestion window |
On loopback all these phases take microseconds and, as we saw in the first post, teach nothing. For a realistic network I used Linux's tc netem in my own container to add a 25-millisecond delay to every packet on the loopback interface, i.e. a 50-millisecond RTT. The server is Kestrel running inside the container; the client is curl in the same container:
$ tc qdisc add dev lo root netem delay 25ms
$ tc qdisc show dev lo
qdisc netem 8001: root refcnt 2 limit 1000 delay 25ms
$ F="dns=%{time_namelookup} connect=%{time_connect} tls=%{time_appconnect} ttfb=%{time_starttransfer} total=%{time_total}\n"
$ curl -s -o /dev/null -w "$F" --resolve bookstore.localhost:5492:127.0.0.1 --cacert /certs/ca.crt https://bookstore.localhost:5492/whoami
dns=0.000012 connect=0.052158 tls=0.109888 ttfb=0.163227 total=0.163305
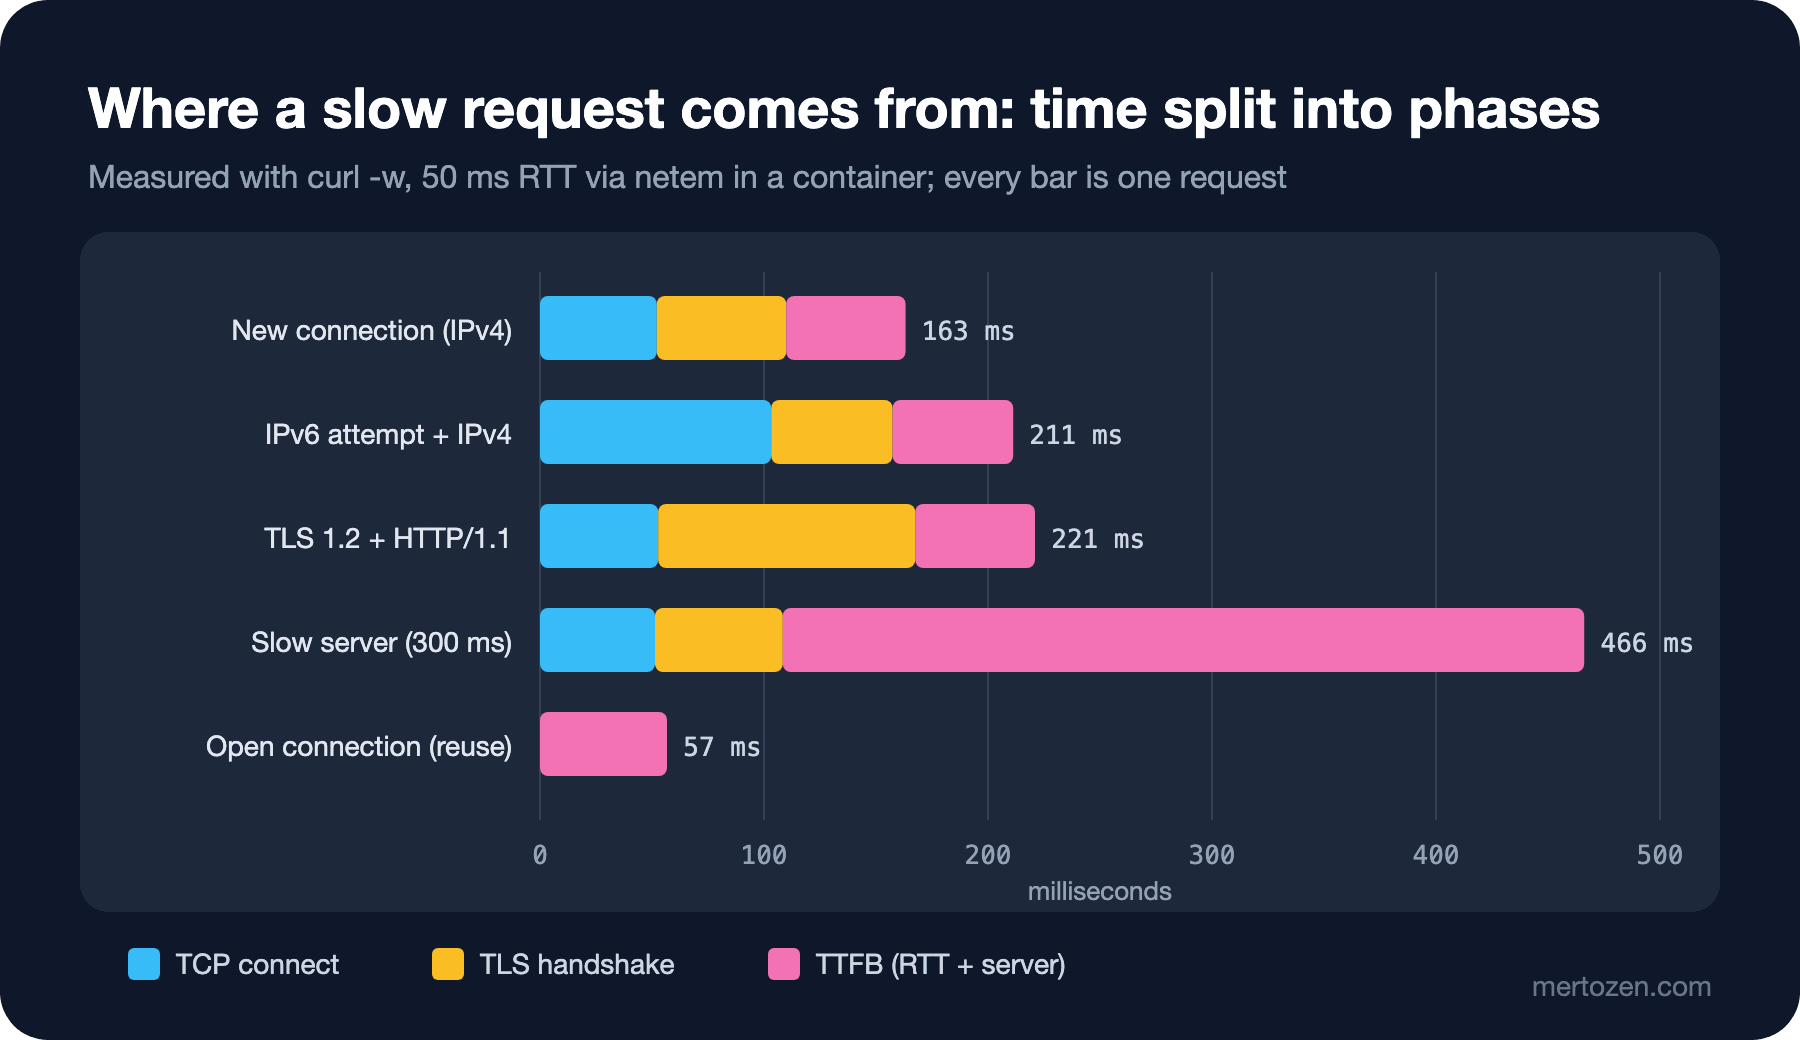
Just like the textbook: TCP 52 milliseconds (1 RTT), TLS 1.3 58 milliseconds (1 RTT), the first byte 53 milliseconds later (1 RTT, the server answers almost instantly). Three RTTs in total, 163 milliseconds. This line is the baseline we compare every case against. --resolve binds the name directly to the IPv4 address; you'll see why in the second case.
Five Cases
Case 1: No keep-alive, a handshake on every request
Three requests to the same endpoint: first with three separate curl processes (each a new connection), then in a single curl command (the connection is reused):
# 3 requests, 3 processes
dns=0.000015 connect=0.103984 tls=0.159989 ttfb=0.212692 total=0.212727
dns=0.000017 connect=0.105402 tls=0.160724 ttfb=0.213717 total=0.213809
dns=0.000017 connect=0.104159 tls=0.161287 ttfb=0.215353 total=0.215391
# reuse
dns=0.000017 connect=0.052227 tls=0.111365 ttfb=0.164948 total=0.165025
dns=0.000015 connect=0.000000 tls=0.000000 ttfb=0.056755 total=0.056843
The second request on the open connection takes 57 milliseconds, a single RTT; connect and tls are zero. A client that opens a new connection for every request pays all the handshakes every time. The signature: connect and tls are above zero on every request. In .NET the most common cause is the new HttpClient() per request we saw in the third post; other causes are a server sending Connection: close or a proxy in between closing connections early. Note too that connect is 104 milliseconds in those three lines; that's the next case.
Case 2: An IPv6 attempt, then IPv4
In the three requests above I didn't use --resolve, and connect took 104 milliseconds instead of 52. -v shows why:
$ curl -sv -o /dev/null --cacert /certs/ca.crt https://bookstore.localhost:5492/whoami 2>&1 | grep -E "Trying|connect to|Connected"
*   Trying [::1]:5492...
* connect to ::1 port 5492 from ::1 port 36740 failed: Connection refused
*   Trying 127.0.0.1:5492...
* Connected to bookstore.localhost (127.0.0.1) port 5492
curl resolves names ending in .localhost to both ::1 and 127.0.0.1 and tries IPv6 first. Since the server only listens on IPv4, the attempt is refused, but the refusal also arrives one RTT later: connection setup doubles. The real-world equivalent is worse: if a domain has an AAAA (IPv6 address) record but the IPv6 path is silently dropped somewhere, the client waits for a timeout instead of a refusal. This is the signature of the trap we saw in the second post: connect is a multiple of the RTT, and -v shows a failed Trying line.
Case 3: An old TLS version
$ curl -s -o /dev/null -w "$F" --resolve bookstore.localhost:5492:127.0.0.1 --tls-max 1.2 --http1.1 --cacert /certs/ca.crt https://bookstore.localhost:5492/whoami
dns=0.000015 connect=0.052807 tls=0.167522 ttfb=0.221019 total=0.221107
The TLS phase went from 58 to 115 milliseconds: TLS 1.2's two-RTT handshake. The signature: appconnect − connect is twice the RTT. As we saw in the fifth post, the cause is sometimes not the server but the client's platform; .NET staying on TLS 1.2 on macOS was an example of that.
Case 4: The real problem is the server
$ curl -s -o /dev/null -w "$F" --resolve bookstore.localhost:5492:127.0.0.1 --cacert /certs/ca.crt "https://bookstore.localhost:5492/slow?ms=300"
dns=0.000015 connect=0.051334 tls=0.108429 ttfb=0.466217 total=0.466325
This is the line from the guessing section. The connection phases match the baseline (51 and 57 milliseconds). The first byte, however, arrives 358 milliseconds after TLS finishes: one RTT (50) plus the server's 300 milliseconds of work. Nothing is wrong with the network; route the ticket to the application team. What's slow inside the server is now a tracing and profiling question; that's the topic of the upcoming Observability series, not this post. The signature: connection phases normal, TTFB far larger than the RTT.
Case 5: A large response
$ curl -s -o /dev/null -w "$F size=%{size_download}\n" --resolve bookstore.localhost:5492:127.0.0.1 --cacert /certs/ca.crt "https://bookstore.localhost:5492/big?kb=5120"
dns=0.000018 connect=0.051587 tls=0.112227 ttfb=0.185814 total=3.069849
 size=5242880
A 5 MB response: the first byte came at 186 milliseconds, but the download took 2.9 seconds. There's no bandwidth limit in this environment; what sets the time is the RTT and TCP's window. The data that can be sent per RTT is limited by the congestion window and the receiver's window, and every 50-millisecond round is waited out. The signature: total − starttransfer dominates. The fixes are compression (JSON (JavaScript Object Notation) compresses very well), pagination, not sending unnecessary fields, and a CDN (Content Delivery Network) for large files.
The Same Phases in DevTools Timing
In the browser the same diagnosis is done with the Timing tab of the DevTools Network panel; the mapping table from the first post applies here too: Initial connection and SSL (Secure Sockets Layer, TLS's old name) correspond to connect and appconnect, "Waiting for server response" to TTFB, and Content Download to total − starttransfer. There are two more browser-specific phases. Queueing and Stalled are the time the request waits inside the browser: it shows up there if the 6 connections per host are full over HTTP/1.1 or the browser gave the request a low priority. When you see a long Stalled time, the first question should be whether this origin speaks HTTP/1.1 or HTTP/2.
The .NET Side: System.Net Metrics
You can't run curl on the outbound calls of a .NET service, but you can see the same phases as metrics. The System.Net.Http and System.Net.NameResolution meters have been built in since .NET 8. A small demo that listens to them in-process with a MeterListener:
// Prints the built-in System.Net metrics as they are recorded
listener.InstrumentPublished = (instrument, l) =>
{
    if (instrument.Meter.Name is "System.Net.Http" or "System.Net.NameResolution"
        && instrument.Name is "http.client.request.duration" or "http.client.connection.duration"
            or "http.client.request.time_in_queue" or "dns.lookup.duration")
    {
        l.EnableMeasurementEvents(instrument);
    }
};
In the same 50-millisecond container, one client sending a fast, a slow and another fast request in turn:
$ dotnet /lab/Bookstore.Net.Lab.dll metrics /certs/ca.crt https://bookstore.localhost:5492/whoami "https://bookstore.localhost:5492/slow?ms=300" https://bookstore.localhost:5492/whoami
dns.lookup.duration                     0.7 ms  dns.question.name=bookstore.localhost
http.client.request.time_in_queue     194.5 ms  network.protocol.version=1.1 server.address=bookstore.localhost
http.client.request.duration          255.8 ms  server.address=bookstore.localhost http.response.status_code=200 network.protocol.version=1.1
http.client.request.duration          357.7 ms  server.address=bookstore.localhost http.response.status_code=200 network.protocol.version=1.1
http.client.request.duration           61.9 ms  server.address=bookstore.localhost http.response.status_code=200 network.protocol.version=1.1
http.client.connection.duration       484.0 ms  network.protocol.version=1.1 server.address=bookstore.localhost
time_in_queue is the time the request waited for a connection; here 194.5 milliseconds, including setting up the new connection (TCP, TLS and the cost of first use in the process). This metric only shows up on the first request; the later requests found a ready connection. The slow request took 357.7 milliseconds, the third 61.9: a single RTT and a little processing. connection.duration is recorded when the connection closes. In production, collecting these metrics with OpenTelemetry and breaking them down by server.address answers the question "which dependency is slow?"; a rising time_in_queue shows the connection pool running out, and a rising dns.lookup.duration shows the resolver causing trouble.
For a quick look at a running process without adding code, there's dotnet-counters. I installed it into my work folder with --tool-path, not as a global tool, and attached it to a process looping requests against a 20-millisecond endpoint:
$ dotnet tool install dotnet-counters --tool-path ./tools
$ ./tools/dotnet-counters collect -p 98955 --counters System.Net.Http,System.Net.NameResolution --format csv -o logs/counters.csv --duration 00:00:06
Starting a counter session. Press Q to quit.
File saved to logs/counters.csv
$ grep "Percentile" logs/counters.csv | head -2
11/08/2026 13:49:09,System.Net.Http,http.client.request.duration (s)[http.request.method=GET;http.response.status_code=200;network.protocol.version=1.1;server.address=127.0.0.1;server.port=5491;url.scheme=http;Percentile=50],Metric,0.022216796875
11/08/2026 13:49:09,System.Net.Http,http.client.request.duration (s)[http.request.method=GET;http.response.status_code=200;network.protocol.version=1.1;server.address=127.0.0.1;server.port=5491;url.scheme=http;Percentile=95],Metric,0.022491455078125
p50 (the time half the requests stay under) is 22.2 milliseconds and p95 22.5 milliseconds: the endpoint's own 20 milliseconds plus a few milliseconds of overhead. With dotnet-counters' monitor command you see the same values as a live table. In-depth metrics, traces and log correlation are the topic of the upcoming Observability series.
Decrypting Your Own Traffic: The Key Log File
Sometimes phases aren't enough and you need to look at the packets on the wire: which frame went when, whether TCP retransmitted, who closed the connection. Wireshark shows that, but because TLS is encrypted it can't see the content; it can decrypt it only if you hand it the session keys in a file. The standard format of that file is called the NSS (Network Security Services) key log format, and many clients support the SSLKEYLOGFILE environment variable or an option for it. I produced a key log file with OpenSSL's s_client while connecting to my own local server; I'm showing the values truncated:
$ openssl s_client -connect 127.0.0.1:5592 -servername localhost -CAfile certs/ca.crt -alpn http/1.1 -quiet -keylogfile logs/keys.log
$ awk '{print $1, substr($2,1,16)"...", substr($3,1,16)"..."}' logs/keys.log
# SSL/TLS... secrets...
SERVER_HANDSHAKE_TRAFFIC_SECRET 1a355a43e5fa8940... 3af855412c923699...
EXPORTER_SECRET 1a355a43e5fa8940... e512645cbcb55c0b...
SERVER_TRAFFIC_SECRET_0 1a355a43e5fa8940... d20dd99b2ee35cf5...
CLIENT_HANDSHAKE_TRAFFIC_SECRET 1a355a43e5fa8940... 1e3bb0dcdf87e16c...
CLIENT_TRAFFIC_SECRET_0 1a355a43e5fa8940... 63510801a2ca28a4...
Every line is a TLS 1.3 secret: the second field is the ClientHello's random value (it identifies the connection), the third is the secret itself. If you give this file to Wireshark in the "(Pre)-Master-Secret log filename" field of its TLS protocol settings, you see the HTTP messages inside that connection as plain text. Wireshark isn't installed on this machine, so I didn't run that step. This file is enough to decrypt all traffic of the connections in it: only produce it in your own environment, for your own test traffic, delete it when you're done, and never leave it enabled in production.
In Production
Measure from where the client is. On a request measured on the server itself the RTT is close to zero and the connection phases say nothing. For the user's experience you need Timing data from the browser (which can be collected with Real User Monitoring) and synthetic measurements from different regions.
Look at percentiles, not averages. Slowness complaints usually come from p95 and p99: requests that set up a new connection, have a cold DNS cache or sit on a lossy network. The average hides them.
The order of the diagnosis is simple: first separate the phases, then recognize the phase's signature. If connect is long, it's the address and the path (IPv6, firewall, a distant region); if tls is long, the version, the certificate chain and connection reuse; if TTFB is long, the server; if the download is long, size and window. Before blaming the network, a single curl -w line is often enough.
Common Pitfalls
Looking at total time and blaming the network. In the 466-millisecond request the network's share was 150 milliseconds; the rest was the server.
Taking TTFB for pure server time. It contains at least one RTT; for a distant client that share grows.
Measuring on loopback or on the server. Connection phases come out near zero and hide the real problem.
Leaving the key log file around. Anyone who gets the file can decrypt the recorded traffic.
Deciding from a single measurement. The first request is always different because of JIT (Just-In-Time) compilation, the DNS cache and connection setup; take several measurements and judge the first one separately.
A Small Experiment
★☆☆ Send requests to your own API (Application Programming Interface) with this post's curl -w format; compare connection reuse by passing two URLs (Uniform Resource Locator) in the same command with a new connection using two separate commands.
★★☆ In a Linux container, add 2 percent packet loss on top of the delay with tc qdisc add dev lo root netem delay 25ms loss 2% and repeat the 5 MB download. How do the time and its spread change? Compare HTTP/2 and HTTP/3.
★★★ Extend this post's MeterListener demo to produce a small summary table with p50/p95 for dns.lookup.duration and http.client.request.time_in_queue, and run it with 100 concurrent requests and MaxConnectionsPerServer = 2. What does the queueing time show?
The How Networking and HTTP Work series ends here. We read the addresses, TCP, DNS, TLS and the three versions of HTTP behind pressing Enter on a URL off the wire; now you can measure this post's phases in your own services. For server-side caching and HTTPS (HTTP Secure) settings you can continue with the ASP.NET Core Web API series, and for resilience and real-time communication with the upcoming External Service Integration and Real-time series.