

Analyzing Crash and Memory Dumps: dotnet-dump, SOS Commands and Taking Dumps in Containers
We take crash dumps automatically with DOTNET_DbgEnableMiniDump and use pe -lines, clrthreads, dumpheap -stat, gcroot, syncblk and dumpasync in dotnet-dump analyze to find the crashing thread, a growing static cache and a lock deadlock. Plus PID 1 versus --init in containers, getting the tool into an SDK-less image, the OOM risk of Heap/Full dumps and personal data inside dumps.
Version note: The code in this post was built and run with .NET 10 (runtime 10.0.14 in the container) and dotnet-dump 10.0.750501; the dumps were taken in Linux arm64 containers on Docker Desktop.
Guess First
The Bookstore API (Application Programming Interface) runs in a container. A request throws a NullReferenceException on a background thread and nobody catches it. You gave the container just three environment variables: DOTNET_DbgEnableMiniDump=1, a dump path and DOTNET_EnableCrashReport=1. Two questions: after the process crashes, what is the container's state, "Exited" or still "Up"? And what happens if you try to open the 180 MB dump with dotnet-dump analyze on macOS? Both answers are below, with real output. The first one surprised me too.
What Is a Dump, and Where Do Logs Fall Short?
A log records the moments you told the application to write down in advance. A dump is a snapshot of the process memory at one instant: every thread, its stack, every object on the heap, who holds whom. The log work in post 08 answered "when, and in which request"; a dump answers "what was inside at that moment". If the process crashed and the last log line says nothing, if memory keeps growing, or if the app got stuck somewhere, the dump is the richest evidence you have.
There are two ways to get a dump in .NET. The runtime can write one itself at crash time, or you can take one from a running process whenever you like with dotnet-dump collect. Analysis uses the same tool in both cases: dotnet-dump analyze, an interactive shell that runs SOS (Son of Strike, the .NET runtime's debugger extension) commands. I ran every command in this post against a small copy of Bookstore in Linux containers.
Automatic Dumps on Crash
First, code that crashes on purpose. A class that prints shipping labels hits null for an order without an address, and because the work runs on its own thread, the exception takes the process down:
namespace Bookstore.Api.Shipping;

public sealed class LabelPrinter
{
    private readonly Dictionary<int, string> _addresses = new() { [1] = "Kadikoy, Istanbul" };

    public void Print(int orderId)
    {
        // for an order without an address GetValueOrDefault returns null
        string address = _addresses.GetValueOrDefault(orderId)!;
        Console.WriteLine($"Printing label for order {orderId}: {address.ToUpperInvariant()}");
    }
}
The endpoint runs this method with new Thread(() => printer.Print(id)). The environment variables that turn on crash dumps are listed on the "Collect dumps on crash" page on Microsoft Learn; this is how I started it:
docker run -d --name debugwork-app-09 -p 5409:8080 -v "$PWD/dumps:/dumps" \
  -e DOTNET_DbgEnableMiniDump=1 \
  -e DOTNET_DbgMiniDumpType=2 \
  -e 'DOTNET_DbgMiniDumpName=/dumps/crash-%e-%p-%t.dmp' \
  -e DOTNET_EnableCrashReport=1 \
  debugwork-app-09

curl -s -i -X POST http://localhost:5409/orders/42/label
The tail of the container log:
Unhandled exception. System.NullReferenceException: Object reference not set to an instance of an object.
   at Bookstore.Api.Shipping.LabelPrinter.Print(Int32 orderId) in /src/Shipping/LabelPrinter.cs:line 10
   at Program.<>c__DisplayClass0_1.<<Main>$>b__6() in /src/Program.cs:line 30
   at System.Threading.Thread.StartHelper.Callback(Object state)
   at System.Threading.ExecutionContext.RunInternal(ExecutionContext executionContext, ContextCallback callback, Object state)
--- End of stack trace from previous location ---
   at System.Threading.ExecutionContext.RunInternal(ExecutionContext executionContext, ContextCallback callback, Object state)
[createdump] Gathering state for process 1 dotnet
[createdump] Crashing thread 0021 signal 6 (0006)
[createdump] Writing crash report to file /dumps/crash-dotnet-1-1794128114.dmp.crashreport.json
[createdump] Crash report successfully written
[createdump] Writing minidump with heap to file /dumps/crash-dotnet-1-1794128114.dmp
[createdump] Written 179118080 bytes (43730 pages) to core file
[createdump] Target process is alive
[createdump] Dump successfully written in 1164ms
What the variables mean, according to the table in the docs:
| Variable | Meaning | Default |
|---|---|---|
DOTNET_DbgEnableMiniDump | if 1, a dump is produced on crash | 0 |
DOTNET_DbgMiniDumpType | 1 Mini, 2 Heap, 3 Triage, 4 Full | 2 (Heap) |
DOTNET_DbgMiniDumpName | path of the dump file; takes templates since .NET 5 | /tmp/coredump.<pid> |
DOTNET_EnableCrashReport | writes a JSON (JavaScript Object Notation) crash report next to the dump; not on Windows | not set |
DOTNET_CreateDumpDiagnostics | diagnostic logging of the dump process itself | 0 |
Templates: %p is the PID (Process ID), %e the executable name, %h the host name, %t seconds since the Unix epoch, %% a single percent sign. Look at the file name in the output: %e became "dotnet", not "Bookstore.Api", because the host executable that started dotnet Bookstore.Api.dll is dotnet. If several services write dumps to the same volume, %e won't tell them apart; %h (in a container the host name is the container ID) or a service name hard-coded in the path works better.
The crash report is good for a first look without opening the dump:
jq -c '.payload.threads[] | select(.crashed == "true") | {managed_exception_type, managed_exception_hresult, native_thread_id}' \
crash-dotnet-1-1794128114.dmp.crashreport.json{"managed_exception_type":"System.NullReferenceException","managed_exception_hresult":"0x80004003","native_thread_id":"0x21"}Analysis: pe -lines and clrthreads
Now the second question from the start. I tried to open the dump on the Mac:
$ dotnet tool run dotnet-dump analyze p09/dumps3/after.dmp
Loading core dump: p09/dumps3/after.dmp ...
Analyzing Windows or Linux dumps not supported when running on MacOS
A Linux dump is analyzed on Linux. So I ran the analysis inside the application's image (I had put the tool there too). clrthreads shows the thread carrying the exception; the rightmost column is the giveaway:
docker run --rm -v "$PWD/dumps:/dumps" --entrypoint dotnet-dump debugwork-app-09 \
  analyze /dumps/crash-dotnet-1-1794128114.dmp -c "clrthreads" -c exit
DBG ID OSID ThreadOBJ State GC Mode GC Alloc Context Domain Count Apt Exception
0 1 1 0000AAAAFE06C590 2020020 Preemptive 0000FFBF7C8E15F0:0000FFBF7C8E2FF0 0000AAAAFE003490 -00001 Ukn
15 2 15 0000AAAAFE06E520 21220 Preemptive 0000FFBF7C85E1A8:0000FFBF7C8600D8 0000AAAAFE003490 -00001 Ukn (Finalizer)
27 13 21 0000FFBE801B9F60 21020 Cooperative 0000FFBF7C96A338:0000FFBF7C96B070 0000AAAAFE003490 -00001 Ukn System.NullReferenceException 0000ffbf7c95b390I kept three of the 13 threads. OSID (the operating system's thread ID) 0x21 matches native_thread_id in the crash report. Switching to that thread with setthread 27 and running pe -lines (printexception) gives the exception with its source line (I cut some of the runtime frames):
> setthread 27
> pe -lines
Exception object: 0000ffbf7c95b390
Exception type:   System.NullReferenceException
Message:          Object reference not set to an instance of an object.
InnerException:   <none>
StackTrace (generated):
    SP               IP               Function
    0000FFBE7EA65470 0000FFFF7E041F7C Bookstore.Api.dll!Bookstore.Api.Shipping.LabelPrinter.Print(Int32)+0xec [/src/Shipping/LabelPrinter.cs @ 10]
    0000FFBE7EA654D0 0000FFFF7E041780 Bookstore.Api.dll!Program+<>c__DisplayClass0_1.<<Main>$>b__6()+0x30 [/src/Program.cs @ 30]
    0000FFBE7EA654F0 0000FFFF7D0FE2E4 System.Private.CoreLib.dll!System.Threading.Thread+StartHelper.Callback(System.Object)+0x94

StackTraceString: <none>
HResult: 80004003
The line numbers are there because the .pdb file was published in the image; dotnet publish produces a portable PDB (Program Database) in Release as well. If your pipeline strips PDBs from the image, the dump keeps the method name but loses the line.
Dumps in Containers: PID 1, --init and Installing the Tool
The answer to the first question: about 50 seconds after the dump was written, the container still showed "Up 58 seconds", and docker top showed the process running at 85 percent CPU (Central Processing Unit). When I started the same image with --init, the picture changed:
$ docker ps -a --filter name=debugwork-app-09 --format '{{.Status}}'
Exited (134) 7 seconds ago
134 = 128 + 6, i.e. death by SIGABRT (the abort signal). The difference is that the process is PID 1 in the container. According to the pid_namespaces man page, Linux does not deliver signals to a PID namespace's init process unless it has installed a handler for them; with dotnet as PID 1 the abort didn't end the way it should. When --init (Docker's tiny init process) is PID 1, dotnet becomes an ordinary child process and really dies on crash. Your orchestrator's ability to restart the container depends on this; in Kubernetes you get the same effect by putting an init such as tini in the image or by sharing the process namespace in the pod. Don't assume "the pod restarts on crash" without testing it in your own environment.
Second topic: the production image has no SDK (Software Development Kit), so no dotnet tool install either. A multi-stage build that installs the tool into its own folder in the SDK stage and copies it into the runtime image is enough:
FROM mcr.microsoft.com/dotnet/sdk:10.0 AS build
WORKDIR /src
COPY src/ .
RUN dotnet publish -c Release -o /app
# install the tool into its own folder, not globally
RUN dotnet tool install dotnet-dump --version 10.0.750501 --tool-path /tools

FROM mcr.microsoft.com/dotnet/aspnet:10.0
WORKDIR /app
COPY --from=build /app .
COPY --from=build /tools /tools
ENV PATH="$PATH:/tools"
ENTRYPOINT ["dotnet", "Bookstore.Api.dll"]
The docs offer one more option: a single-file downloadable dotnet-dump for Linux x64/arm64. Running the tool with docker exec in the same container as the app needed no extra privileges with Docker Desktop's defaults. Attaching from a separate sidecar container is different: per the docs you need ptrace capability (usually --cap-add=SYS_PTRACE), a shared process namespace and the same /tmp. When you point at the wrong PID, the tool says so itself:
Unable to connect to Process 7. Please verify that /tmp/ is writable by the current user. If the target process is in a different container, ensure this process runs with 'pid: host' and has access to /proc/{pid}/root/ (requires CAP_SYS_PTRACE or privileged mode).Here the real cause was simple: with --init, the PID of dotnet was 6, not 7. First dotnet-dump ps, then collect.
Growing Memory: Two Dumps and gcroot
The second case: "the pod uses a bit more memory every day". The code looks innocent: a small static class that remembers recently viewed customers.
namespace Bookstore.Api.Customers;

public static class RecentCustomers
{
    // never cleared: every request adds one Customer to the list
    private static readonly List<Customer> Items = [];
    private static readonly Lock Sync = new();

    public static void Remember(Customer customer)
    {
        lock (Sync)
        {
            Items.Add(customer);
        }
    }
}
I started the container with --cpus 1 --memory 512m, sent 2,000 requests, took a Heap dump, then sent 18,000 more and took a second one:
docker exec debugwork-app-09 dotnet-dump ps
docker exec debugwork-app-09 dotnet-dump collect -p 7 --type Heap -o /dumps/before.dmp
# 18,000 more requests
docker exec debugwork-app-09 dotnet-dump collect -p 7 --type Heap -o /dumps/after.dmp
At those two moments docker stats showed 32.32 MiB and 76.72 MiB; the dump files were 155 MB and 214 MB. Dump size is not working set, so don't infer the size of a leak from the file size. The bottom lines of dumpheap -stat in the two dumps:
=== before
ffff78811140     4    28,768 Bookstore.Api.Customers.Customer[]
ffff78583f58 2,000    96,000 Bookstore.Api.Customers.Customer
ffff74dbdd58 8,292   527,344 System.String
ffff75935470 2,422 4,189,526 System.Byte[]
Total 60,918 objects, 8,544,368 bytes
=== after
ffff78811140      3    393,288 Bookstore.Api.Customers.Customer[]
ffff78583f58 20,000    960,000 Bookstore.Api.Customers.Customer
ffff74dbdd58 44,431  2,699,622 System.String
ffff75935470 20,445 41,519,257 System.Byte[]
Total 135,935 objects, 49,465,857 bytes
Reading order: the total first (from 8.5 MB to 49.5 MB), then the row that grew most. Byte[] is the biggest item but says nothing on its own; byte arrays are everywhere. The real clue is that the Customer count equals the request count exactly: 2,000 and 20,000. Each Customer's 2 KB ProfilePhoto array also explains the Byte[] row. The next step is to find the chain keeping a single Customer alive. List the addresses by MT (MethodTable) and hand any one of them to gcroot:
> dumpheap -mt ffff78583f58
         Address               MT           Size
    fffee60a2ef8     ffff78583f58             48
    fffee60abd48     ffff78583f58             48
    fffee60ac1c8     ffff78583f58             48
> gcroot fffeea0d8c20
Caching GC roots, this may take a while.
Subsequent runs of this command will be faster.

HandleTable:
    0000ffffb3de1308 (strong handle)
          -> fffee4003038     System.Object[]
          -> fffee60a3780     System.Collections.Generic.List<Bookstore.Api.Customers.Customer>
          -> fffee6c20080     Bookstore.Api.Customers.Customer[]
          -> fffeea0d8c20     Bookstore.Api.Customers.Customer

Found 1 unique roots.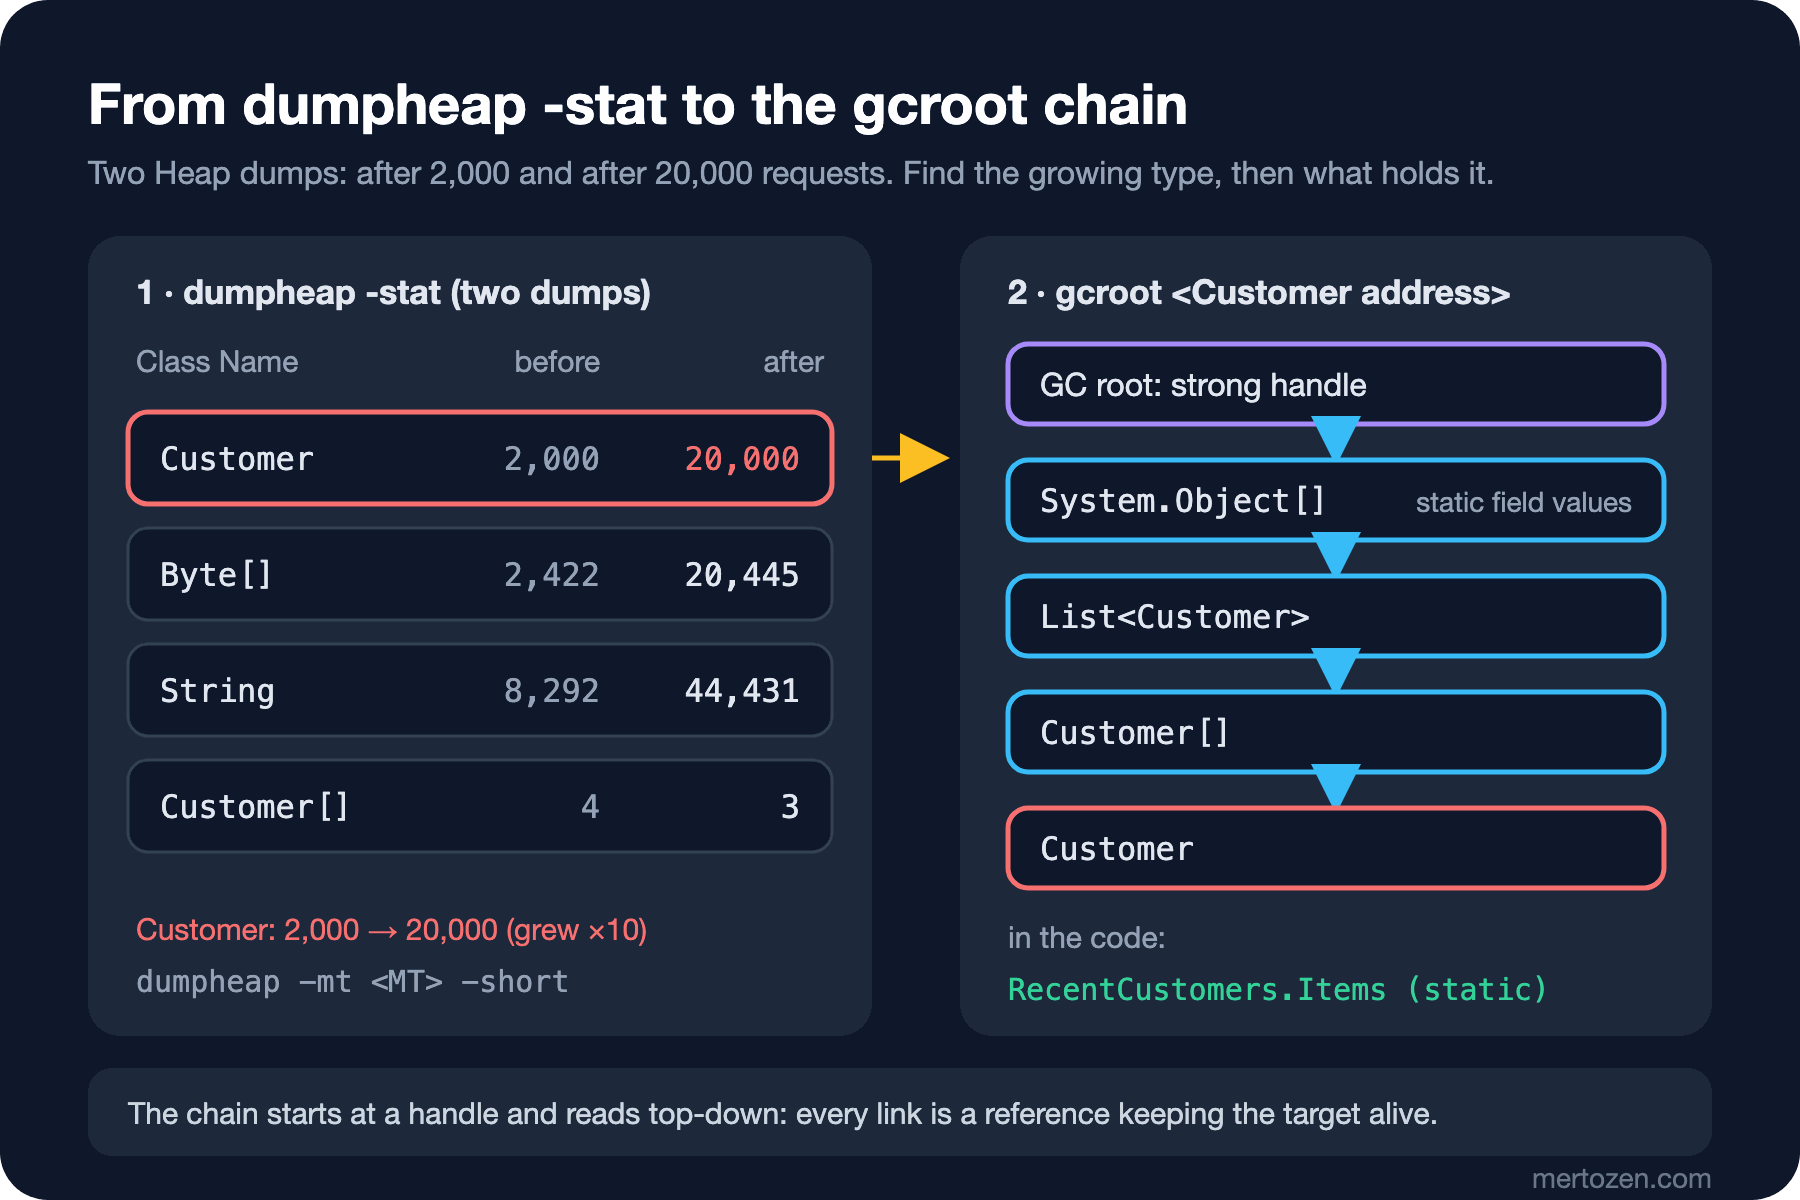
The chain reads top-down. The GC (garbage collector) root is a strong handle; the 2,040-element Object[] it holds is where the runtime keeps static field values (it also holds other statics such as HTTP (Hypertext Transfer Protocol) header names). gcroot doesn't print the field name, but the type chain is enough: there is exactly one List<Customer> in the process, and exactly one static List<Customer> in the code. The fix is either to cap the list (last 100 customers) or, if it's really needed, to use a cache with an expiry and a size limit. Anything added to a static collection "for now" lives as long as the process does.
Deadlocks: syncblk and clrstack
The third case: "the stock transfer endpoint returns 202 but the transfer never finishes". In StockLedger, two methods take two locks in opposite order; the theory is in the C# Async series post "C# Deadlocks, SynchronizationContext and ConfigureAwait", and post 06 covers the debugger side. This is how it looks in a Heap dump I took during the deadlock:
> syncblk
Index         SyncBlock MonitorHeld Recursion Owning Thread Info          SyncBlock Owner
    6 0000AAAAE9B9BA50            3         1 0000AAAAE9A51D70 5d  15   0000fffeeb3a1338 System.Object
    7 0000AAAAE9B9BAA8            3         1 0000FFFEC41AB1A0 5e  16   0000fffeeb3a1350 System.Object
MonitorHeld is 3: the owner counts 1 and every waiting thread adds 2, so each lock has one owner and one waiter. The owners are threads 15 and 16. Their stacks (I cut the runtime frames at the bottom):
> setthread 15
> clrstack
OS Thread Id: 0x5d (15)
0000FFFEC2B6E3A0 0000FFFF73EE9A58 System.Threading.Monitor.Enter_Slowpath(System.Object)
0000FFFEC2B6E470 0000FFFF78A06D1C System.Threading.Monitor.Enter(System.Object, Boolean ByRef)
0000FFFEC2B6E490 0000FFFF78CCE470 Bookstore.Api.Inventory.StockLedger.MoveFromWarehouseToStore(Int32) [/src/Inventory/StockLedger.cs @ 15]
0000FFFEC2B6E4D0 0000FFFF78CCE3C0 Program+<>c__DisplayClass0_0.<<Main>$>b__4() [/src/Program.cs @ 21]
> setthread 16
> clrstack
OS Thread Id: 0x5e (16)
0000FFFEC235E3A0 0000FFFF73EE9A58 System.Threading.Monitor.Enter_Slowpath(System.Object)
0000FFFEC235E470 0000FFFF78A06D1C System.Threading.Monitor.Enter(System.Object, Boolean ByRef)
0000FFFEC235E490 0000FFFF78CCE628 Bookstore.Api.Inventory.StockLedger.MoveFromStoreToWarehouse(Int32)
Each thread holds one lock and waits for the other in Monitor.Enter: the classic lock-ordering deadlock. In a process with many threads, the quick way to see this is parallelstacks, the text version of Visual Studio's Parallel Stacks window. The end of its output:
      ~~~~ 5d
         1 System.Threading.Monitor.Enter_Slowpath(Object)
         1 System.Threading.Monitor.Enter(Object, Boolean ByRef)
         1 Bookstore.Api.Inventory.StockLedger.MoveFromWarehouseToStore(Int32)
         1 Program+<>c__DisplayClass0_0.<<Main>$>b__4()
      ~~~~ 5e
         1 System.Threading.Monitor.Enter_Slowpath(Object)
         1 System.Threading.Monitor.Enter(Object, Boolean ByRef)
         1 Bookstore.Api.Inventory.StockLedger.MoveFromStoreToWarehouse(Int32)
         1 Program+<>c__DisplayClass0_0.<<Main>$>b__5()
    2 System.Threading.Thread+StartHelper.Callback(Object)
    2 System.Threading.ExecutionContext.RunInternal(ExecutionContext, ContextCallback, Object)
==> 11 threads with 3 roots
In the same dump, dumpasync showed the async flows waiting on a five-minute shipping-status call as chains; since they aren't tied to a thread, clrstack can't see them (I cut the Kestrel end of the chain):
STACK 2
0000fffeeb3a9658 0000ffff77c24f60 ( ) System.Threading.Tasks.Task+DelayPromiseWithCancellation
  0000fffeeb3a97d8 0000ffff78d228a8 (0) Bookstore.Api.Shipping.ShippingClient+<GetStatusAsync>d__0
    0000fffeeb3a9840 0000ffff78d23550 (0) Program+<>c+<<<Main>$>b__0_3>d
      0000fffeeb3a98a8 0000ffff78d24518 (0) Microsoft.AspNetCore.Http.RequestDelegateFactory+<ExecuteTaskResult>d__144<Microsoft.AspNetCore.Http.IResult>
threadpool reports the state of the pool: in this dump "Workers Total: 2, Workers Running: 0", so the deadlock is not in the thread pool but on two hand-made threads. Thread pool exhaustion is a different story; we look at it in post 10.
Opening the Dump in Visual Studio 2026
There is no Windows on this machine, so I did not run this part; it comes from the "Use dump files in the debugger" page on Microsoft Learn. In Visual Studio, File > Open > File on the .dmp file brings up the Minidump File Summary window. From there, Debug with Managed Only lets you walk the dump as if stopped at a breakpoint: Call Stack, Locals, Parallel Stacks; you can't step forward. Run Diagnostic Analysis runs the built-in analyzers over the dump. The docs state plainly that Visual Studio can debug managed dumps from Linux; symbols and binaries must match the build in the dump exactly. In practice I narrow the hypothesis with dotnet-dump first and switch to the IDE (Integrated Development Environment) when I need to browse alongside the source.
Production Notes
Dumps carry secrets. I opened a random Customer in the leak dump:
> dumpobj 0000fffeea0d8bd8
String:      customer14842@example.com
A Heap dump contains everything in memory: customer emails, connection strings, tokens, request bodies. You are sharing a file that carries PII (Personally Identifiable Information). My rules:
- Pick the Triage type when you can: the docs describe it as "same as Mini, but removes personal user information, such as paths and passwords". The price: no heap, so no leak analysis.
- Keep Heap or Full dumps only in an access-restricted place, record who downloads them, delete them when done; never attach them to a ticket.
- If the crash-dump volume fills up, the next crash's evidence can't be written; set a retention period and a quota.
The memory limit is a separate risk. The docs warn explicitly: collecting a Full or Heap dump can make the operating system page in a large share of the process's virtual memory, and in a container with a memory limit this can get the container killed with OOM (Out of Memory). Taking a dump from a pod running at 90 percent of its limit can itself cause the outage. Measure it, and raise the limit beforehand or drain traffic from that pod.
Then the type: the default for the crash environment variables is Heap (2), but for dotnet-dump collect it's Full. Run the command from memory without --type and you get a bigger file and a longer freeze than you expected.
Common Pitfalls
Trying to open a dump on the wrong operating system. A Linux dump is analyzed on Linux; the macOS tool refuses explicitly. Analyzing in a container derived from the application's image is the least surprising route.
Taking "0 roots" from gcroot to mean the object is garbage. In my first attempt, running with Server GC (eeversion: "Server mode with 1 gc heaps", DATAS (Dynamic Adaptation To Application Sizes) on), gcroot returned "Found 0 unique roots" for a Customer that was clearly sitting in the list. When I ran the same app with Workstation GC (the runtime picked it itself under --cpus 1), the chain came out as above. I saw this with dotnet-dump 10.0.750501 and runtime 10.0.14 on arm64; it may not reproduce elsewhere. The lesson: if the tool says "no root" but the numbers grow one-for-one with requests, trust the numbers, not the tool, and confirm another way (a repro under Workstation GC, or walking the chain by hand with dumpobj).
Assuming every command works on a Heap dump. Per the docs, the Heap type contains all memory except mapped images. In my runs, dumpobj crashed before printing the field list (exit code 139) on the Heap dump and worked fine on a Full dump taken in the same state. dumpheap, gcroot, syncblk and clrstack were fine on the Heap dump.
Diagnosing a leak from a single dump. Seeing 20,000 Customers in one dump could just be a cache doing its job. What proves growth is the difference between two dumps, with load and time in between.
Expecting %e to separate file names, and not knowing the PID 1 issue. We saw both above: the dump is named "dotnet", and without --init the container of a crashed process can stay up.
A Small Experiment
★☆☆ Repeat the same crash with DOTNET_DbgMiniDumpType=1 (Mini). Compare the file size with the Heap dump, check whether pe -lines still works, and see what dumpheap -stat says.
★★☆ Fix RecentCustomers to keep only the last 100 entries. Take two dumps after 2,000 and 20,000 requests and show in the dumpheap -stat -type Bookstore.Api output that the Customer count stays flat.
★★★ Start the leaking app with --memory 128m, push memory close to the limit and run dotnet-dump collect --type Full. Was the container OOM-killed (OOMKilled in docker inspect)? Repeat with --type Heap and note the difference.
A dump was a snapshot of one moment. But with "the app isn't responding", one snapshot is sometimes not enough; you need to see quickly where every thread is waiting and record a few seconds of activity. In the next post we move on to diagnosing hangs and slowness with dotnet-stack and dotnet-trace, and especially thread pool starvation.