

Unsupervised Learning: Customer Segmentation with K-Means and Sales Anomaly Detection
Without labels a model finds structure, not the right answer; the value of k-means and anomaly detection is measured by whether their results mean something to the business. We segment Bookstore's customers with k-means on RFM features and show with real output the effect of scaling, choosing k and stability across seeds, and how ML.NET's three anomaly detectors separate campaigns, an outage and a pricing error in the daily order series.
Version note: The code in this post was built and run with .NET 10, ML.NET 6.0 with the Microsoft.ML 6.0.0 package and Microsoft.ML.TimeSeries 6.0.0. The data is synthetic Bookstore data produced by the series' seeded generator; the segments and numbers here are not the results of a real business.
Guess First
Every model so far had a label: delivery time, cancellation, the topic of a review. This post has none. For Bookstore, the online bookstore used as the shared example across this site's series, we ask two questions: into which groups do customers fall by their shopping behaviour, and which days in two years of daily orders are unusual?
Here is what I want you to guess: if you give k-means columns such as total spend, number of orders and days since the last order as they are, which column decides the result when you split customers into four groups? Second question: in a series with four campaign weeks over two years, how many of the alerts from an anomaly detector running with no tuning at all point to a real problem?
Unsupervised Learning: What Do We Learn Without Labels?
Unsupervised learning looks for structure in data that has no right answer. Clustering groups similar rows, anomaly detection flags rows that do not fit the general behaviour. Both share the same problem, evaluation: there is no label in a test set to compare against, so the answer to "is it right?" comes from the business, not from the model. The files in this post have no column that tells a customer's segment either; the generator creates customers with certain behaviours but does not write them as a column. That is what real life looks like too.
RFM Features
The most common starting point for customer segmentation is RFM: recency, the time since the last purchase, frequency and monetary value. To these three we add columns specific to Bookstore: the share of orders that fell into a campaign week, the average number of books per order and, for interpreting the segments, the cancellation and Express rates. We build one row per customer from the delivered orders:
public static List<CustomerRfm> LoadRfm()
{
    List<OrderRow> orders = [.. OrderRow.Load("data/orders_clean.csv")];
    return [.. orders
        .GroupBy(o => o.CustomerId)
        .Where(g => g.Any(o => !o.IsCancelled))
        .Select(g =>
        {
            List<OrderRow> kept = [.. g.Where(o => !o.IsCancelled)];
            return new CustomerRfm
            {
                CustomerId = g.Key,
                RecencyDays = (float)(DataEnd - kept.Max(o => o.OrderedAtUtc)).TotalDays,
                Frequency = kept.Count,
                Monetary = (float)kept.Sum(o => o.OrderTotal),
                CampaignShare = kept.Count(o => o.IsCampaign) / (float)kept.Count,
                AvgItems = (float)kept.Average(o => o.ItemCount),
                CancelRate = g.Count(o => o.IsCancelled) / (float)g.Count(),
                ExpressShare = kept.Count(o => o.ShippingMethod == "Express") / (float)kept.Count,
            };
        })
        .OrderBy(c => c.CustomerId)];
}
K-Means and Feature Scaling
The idea of k-means is simple: pick k centres, assign each customer to the nearest centre, move each centre to the mean of its customers and repeat until the assignments stop changing. "Nearest" is measured with Euclidean distance, so the differences of all columns are squared and added up. To try the first opening question we pass the columns without any transformation:
// 1) Without scaling: Monetary (thousands of TL) drowns out everything else
MLContext ml = new(seed: 1);
IDataView data = ml.Data.LoadFromEnumerable(customers);
ITransformer raw = ml.Transforms.Concatenate("Features", "RecencyDays", "Frequency", "Monetary", "CampaignShare", "AvgItems")
    .Append(KMeans(ml, 4)).Fit(data);
Profile("k = 4, raw columns", customers, ml, raw);
dotnet run --project src/Bookstore.ML.Lab -- segmentscustomers with at least one delivered order: 3,479
k = 4, raw columns
cluster customers recency d orders spend TL campaign items cancel express
1 3,431 120 6.7 3,489 12 % 2.2 4.0 % 17 %
2 15 124 7.6 125,224 7 % 69.7 4.9 % 0 %
3 2 26 13.5 219,828 3 % 72.6 0.0 % 0 %
4 31 117 4.5 68,885 7 % 71.2 5.0 % 0 %The answer: spend. 3,431 of 3,479 customers are in one group, and the remaining 48 customers are split into three groups by spend. These 48 customers order 70 books per order on average; they are the schools and libraries that buy through the Institutional Orders module. Spend is measured in thousands or even hundreds of thousands of TL, while the campaign share is between 0 and 1. In the distance calculation a 1,000 TL difference in spend wipes out every difference in campaign share. The resulting groups are not wrong, but you did not need k-means to answer "who spends a lot?"; an OrderBy would have done.
In the fifth post we saw why normalization matters for linear models. For k-means it is mandatory, because distance is the algorithm's only measure. We apply two steps. Number of orders, spend and basket size are right-skewed: most customers order a little, a few order a lot. We take the log of these columns so that the difference between 2 and 4 orders counts for more than the difference between 50 and 52. Then we scale every column to mean 0 and variance 1:
public static IEstimator<ITransformer> Scaled(MLContext ml) =>
    ml.Transforms.CustomMapping<CustomerRfm, LogRfm>((input, output) =>
        {
            output.LogFrequency = MathF.Log(1 + input.Frequency);
            output.LogMonetary = MathF.Log(1 + input.Monetary);
            output.LogAvgItems = MathF.Log(1 + input.AvgItems);
        }, contractName: null)
        .Append(ml.Transforms.Concatenate("Features", "RecencyDays", "LogFrequency", "LogMonetary", "CampaignShare", "LogAvgItems"))
        .Append(ml.Transforms.NormalizeMeanVariance("Features"));
public sealed class LogRfm
{
    public float LogFrequency { get; set; }
    public float LogMonetary { get; set; }
    public float LogAvgItems { get; set; }
}
private static IEstimator<ITransformer> KMeans(MLContext ml, int k) =>
    ml.Clustering.Trainers.KMeans(new KMeansTrainer.Options
    {
        FeatureColumnName = "Features", NumberOfClusters = k, NumberOfThreads = 1,
    });
NumberOfThreads = 1 matters here too. ML.NET's XML documentation says plainly that with the default parallel run the result is not deterministic; it is the same situation we saw with SDCA in the fourth post.
How Many Clusters?
You give k-means the number of groups. To choose it we look at three measures. ML.NET's ClusteringMetrics class provides two: AverageDistance, the average distance of customers to their own centre, and the Davies-Bouldin index, which compares how spread out each group is with its distance to the nearest group, lower being better. The third is the silhouette: for each customer it compares the average distance to its own group (a) with the average distance to the nearest other group (b) and computes (b − a) / max(a, b). A value near 1 means the customer is in the right group, 0 that it sits on the border between two groups, a negative value that it is in the wrong group. ML.NET does not compute the silhouette, so we write it ourselves in a few lines:
/// <summary>Mean silhouette: (b - a) / max(a, b), a = mean distance to own cluster, b = to the nearest other cluster.</summary>
private static double Silhouette(List<ClusterOutput> rows)
{
    int n = rows.Count;
    double total = 0;
    for (int i = 0; i < n; i++)
    {
        Dictionary<uint, (double Sum, int Count)> byCluster = [];
        for (int j = 0; j < n; j++)
        {
            if (i == j) continue;
            double d = 0;
            for (int f = 0; f < rows[i].Features.Length; f++)
            {
                double diff = rows[i].Features[f] - rows[j].Features[f];
                d += diff * diff;
            }
            (double sum, int count) = byCluster.GetValueOrDefault(rows[j].PredictedLabel);
            byCluster[rows[j].PredictedLabel] = (sum + Math.Sqrt(d), count + 1);
        }
        uint own = rows[i].PredictedLabel;
        if (!byCluster.TryGetValue(own, out (double Sum, int Count) mine)) continue;
        double a = mine.Sum / mine.Count;
        double b = byCluster.Where(c => c.Key != own).Min(c => c.Value.Sum / c.Value.Count);
        total += (b - a) / Math.Max(a, b);
    }
    return total / n;
}
// 2) Choosing k on the scaled features: average distance (elbow), Davies-Bouldin and silhouette
Console.WriteLine();
Console.WriteLine($"{"k",3}{"avg distance",14}{"Davies-Bouldin",16}{"silhouette",12}");
List<string> csv = ["k,avg_distance,davies_bouldin,silhouette"];
for (int k = 2; k <= 8; k++)
{
ml = new MLContext(seed: 1);
ITransformer model = Scaled(ml).Append(KMeans(ml, k)).Fit(data);
IDataView scored = model.Transform(data);
ClusteringMetrics m = ml.Clustering.Evaluate(scored, scoreColumnName: "Score", featureColumnName: "Features");
double s = Silhouette([.. ml.Data.CreateEnumerable<ClusterOutput>(scored, reuseRowObject: false)]);
Console.WriteLine($"{k,3}{m.AverageDistance,14:F3}{m.DaviesBouldinIndex,16:F3}{s,12:F3}");
csv.Add(string.Create(CultureInfo.InvariantCulture, $"{k},{m.AverageDistance:F4},{m.DaviesBouldinIndex:F4},{s:F4}"));
} k avg distance Davies-Bouldin silhouette
2 1.109 1.036 0.405
3 0.742 0.874 0.417
4 0.621 1.053 0.325
5 0.509 0.964 0.344
6 0.450 0.958 0.343
7 0.330 0.813 0.368
8 0.304 0.889 0.341The three measures say three different things. The average distance always falls as k grows; the ML.NET documentation also points out that this metric only decreases as the number of clusters increases. The "elbow" method looks for the point where the fall slows down on this curve; here the biggest drop is from 2 to 3 and it is gentler after that. The silhouette peaks at k = 3 (0.417), Davies-Bouldin is lowest at k = 7 (0.813). The table does not make a decision, it only narrows the range. We decide by looking at whether the segments mean something to the business and whether they are repeatable.
Giving Segments a Business Meaning
For 3, 4 and 5 groups we print the average values of each group. Then we run the same k again with a different seed and check whether customers land in the same groups:
// 3) Candidate k values, described in business terms
foreach (int k in new[] { 3, 4, 5 })
{
    ml = new MLContext(seed: 1);
    uint[] labels = Profile($"k = {k}, log + NormalizeMeanVariance", customers, ml, Scaled(ml).Append(KMeans(ml, k)).Fit(data));
    Console.WriteLine($"  customers with 20+ items per order: " + string.Join(", ", customers.Zip(labels)
        .Where(x => x.First.AvgItems >= 20).GroupBy(x => x.Second).OrderBy(g => g.Key).Select(g => $"{g.Count()} in cluster {g.Key}")));
}
// 4) Same k, different seed: are the segments stable?
Console.WriteLine();
foreach (int k in new[] { 3, 4, 5 })
{
    int[] a = Assign(customers, k, seed: 1), b = Assign(customers, k, seed: 2);
    int same = 0, pairs = 0;
    Random rnd = new(5);
    for (int i = 0; i < 200_000; i++)
    {
        int x = rnd.Next(a.Length), y = rnd.Next(a.Length);
        if (x == y) continue;
        pairs++;
        if ((a[x] == a[y]) == (b[x] == b[y])) same++;
    }
    Console.WriteLine($"k = {k}, seed 1 vs seed 2: {100.0 * same / pairs:F1}% of customer pairs agree on 'same segment or not'");
}
k = 3, log + NormalizeMeanVariance
cluster customers recency d orders spend TL campaign items cancel express
1 560 83 5.8 2,820 48 % 2.2 5.3 % 9 %
2 641 347 2.8 2,183 3 % 2.9 3.9 % 22 %
3 2,278 65 7.9 5,903 5 % 3.4 3.7 % 17 %
customers with 20+ items per order: 3 in cluster 1, 10 in cluster 2, 53 in cluster 3
k = 4, log + NormalizeMeanVariance
cluster customers recency d orders spend TL campaign items cancel express
1 479 90 5.0 2,484 52 % 2.3 5.1 % 9 %
2 1,213 87 3.2 3,810 0 % 4.1 3.6 % 20 %
3 1,217 51 12.5 7,666 12 % 2.6 3.9 % 14 %
4 570 364 2.8 2,255 3 % 2.9 4.0 % 23 %
customers with 20+ items per order: 3 in cluster 1, 41 in cluster 2, 13 in cluster 3, 9 in cluster 4
k = 5, log + NormalizeMeanVariance
cluster customers recency d orders spend TL campaign items cancel express
1 671 71 6.8 3,187 35 % 2.0 5.1 % 9 %
2 1,074 91 2.7 1,576 0 % 2.4 3.7 % 20 %
3 1,076 51 12.8 10,368 7 % 4.7 3.5 % 16 %
4 562 367 2.8 2,403 3 % 3.2 4.1 % 23 %
5 96 115 2.3 918 89 % 1.8 3.7 % 12 %
customers with 20+ items per order: 2 in cluster 1, 9 in cluster 2, 44 in cluster 3, 11 in cluster 4
k = 3, seed 1 vs seed 2: 100.0% of customer pairs agree on 'same segment or not'
k = 4, seed 1 vs seed 2: 100.0% of customer pairs agree on 'same segment or not'
k = 5, seed 1 vs seed 2: 85.9% of customer pairs agree on 'same segment or not'At k = 4 the four groups tell a readable story. More than half of group 1's orders are in campaign weeks: customers who wait for campaigns (479). Group 3 placed 12.5 orders on average and its last order was 51 days ago on average: loyal customers (1,217). Group 4's last order was 364 days ago on average: lost or dormant customers (570). Group 2 orders little, never comes for campaigns and picks Express more often (1,213). These names are not the model's output but our interpretation; a marketing team looking at the same table might name them differently.
The other options are weaker. At k = 3 the loyal customers and the light buyers merge into one group; the solution the silhouette prefers means putting two different audiences into one campaign from a marketing point of view. At k = 5 a group of only 96 customers appears with 89% of its orders in campaigns, but when the seed changes only 85.9% of customer pairs keep the same relationship. At k = 3 and k = 4 this rate is 100%. A segment definition that depends on the seed moves customers between groups at random every time the model is retrained monthly. That is why we choose k = 4.
There is also a result nobody asked for: the 66 institutional customers who buy more than 20 books per order do not form their own group at any k; they are spread over four groups. These customers are few, and k-means prefers to split large groups. We already know institutional customers from their account type; separating them with a rule before clustering also makes the model's job easier. It is also useful to know that the cancellation rate stays between 3.6% and 5.1% across segments: these segments separate behaviour, but they do not solve the cancellation problem of the seventh post on their own.
The Daily Order Series and Anomaly Detection
The second problem is a time series. We count orders per day in Turkey's time zone: 730 days, between 1 and 104 orders a day, 42 campaign days. The Microsoft.ML.TimeSeries package offers several detectors for this kind of series. We try three on the same series:
DetectIidSpike: a spike detector that assumes the days are independent and identically distributed, IID for short. It knows nothing about the weekly pattern or the growth trend.DetectSpikeBySsa: uses singular spectrum analysis, a method that splits a series into trend, seasonality and noise, to predict the expected value of the series and flags large deviations from the prediction.DetectEntireAnomalyBySrCnn: processes the whole series at once with SR-CNN, Microsoft's spectral residual and convolutional neural network method that finds sudden changes with frequency analysis.
public sealed class DailyOrders
{
    public DateTime Day { get; set; }
    public float Orders { get; set; }
    /// <summary>The same count as double: DetectSeasonality and SR-CNN read double, the spike detectors read float.</summary>
    public double OrdersAsDouble { get; set; }
    public bool IsCampaign { get; set; }
}
// 1) IidSpike assumes independent days: no weekly pattern, no trend
double[][] iid = Run<SpikeOutput>(ml, series, ml.Transforms.DetectIidSpike(
"Prediction", "Orders", confidence: 99.0, pvalueHistoryLength: 28)).Select(p => p.Prediction).ToArray();
// 2) SpikeBySsa learns trend and weekly seasonality from the first 120 days
double[][] ssa = Run<SpikeOutput>(ml, series, ml.Transforms.DetectSpikeBySsa(
"Prediction", "Orders", confidence: 99.0, pvalueHistoryLength: 28, trainingWindowSize: 120,
seasonalityWindowSize: 7)).Select(p => p.Prediction).ToArray();
// 3) SR-CNN over the whole series at once, with the period it should expect
IDataView sr = ml.AnomalyDetection.DetectEntireAnomalyBySrCnn(series, "Prediction", "OrdersAsDouble",
new SrCnnEntireAnomalyDetectorOptions
{
Threshold = 0.35, Sensitivity = 90, DetectMode = SrCnnDetectMode.AnomalyAndMargin, Period = 7,
});
double[][] srcnn = [.. ml.Data.CreateEnumerable<SrCnnOutput>(sr, reuseRowObject: false).Select(p => p.Prediction)];dotnet run --project src/Bookstore.ML.Lab -- anomalies730 days, 1-104 orders per day, 42 campaign days
DetectSeasonality: period = -1, with randomnessThreshold 0.5: -1
detector alerts in campaign in December other days
IidSpike 7 3 0 4
2025-06-14 Sat 1 orders
2025-08-23 Sat 10 orders
2026-02-03 Tue 104 orders
2026-07-27 Mon 53 orders
SpikeBySsa 12 3 1 8
2025-03-04 Tue 13 orders
2025-06-14 Sat 1 orders
2025-06-16 Mon 47 orders
2025-08-21 Thu 16 orders
2025-08-24 Sun 37 orders
2026-02-03 Tue 104 orders
2026-02-04 Wed 33 orders
2026-09-15 Tue 44 orders
SrCnn 3 2 0 1
2026-02-03 Tue 104 ordersThe two types in the code failed on the first attempt. The spike detectors read a float column; DetectSeasonality and SR-CNN read double. Give them a column of the wrong type and ML.NET's getter, not the class itself, throws an InvalidOperationException, so we keep the count in two columns. The second problem is about the platform: Microsoft.ML.TimeSeries depends on Intel's MKL, Intel's optimized math library, and that library's NuGet package only contains files built for x64 and x86 processors. According to the "Install extra ML.NET dependencies" page on Microsoft Learn, Windows needs no extra installation; on Linux the OpenMP library that MKL uses (libiomp5.so) has to be installed separately. As in the sixth post, I produced the output in this section in a Linux x64 container, where I linked LLVM's OpenMP library as libiomp5.so. I did not run it on Windows. The k-means section does not need this dependency and gave exactly the same result in the container.
Judging the Alerts
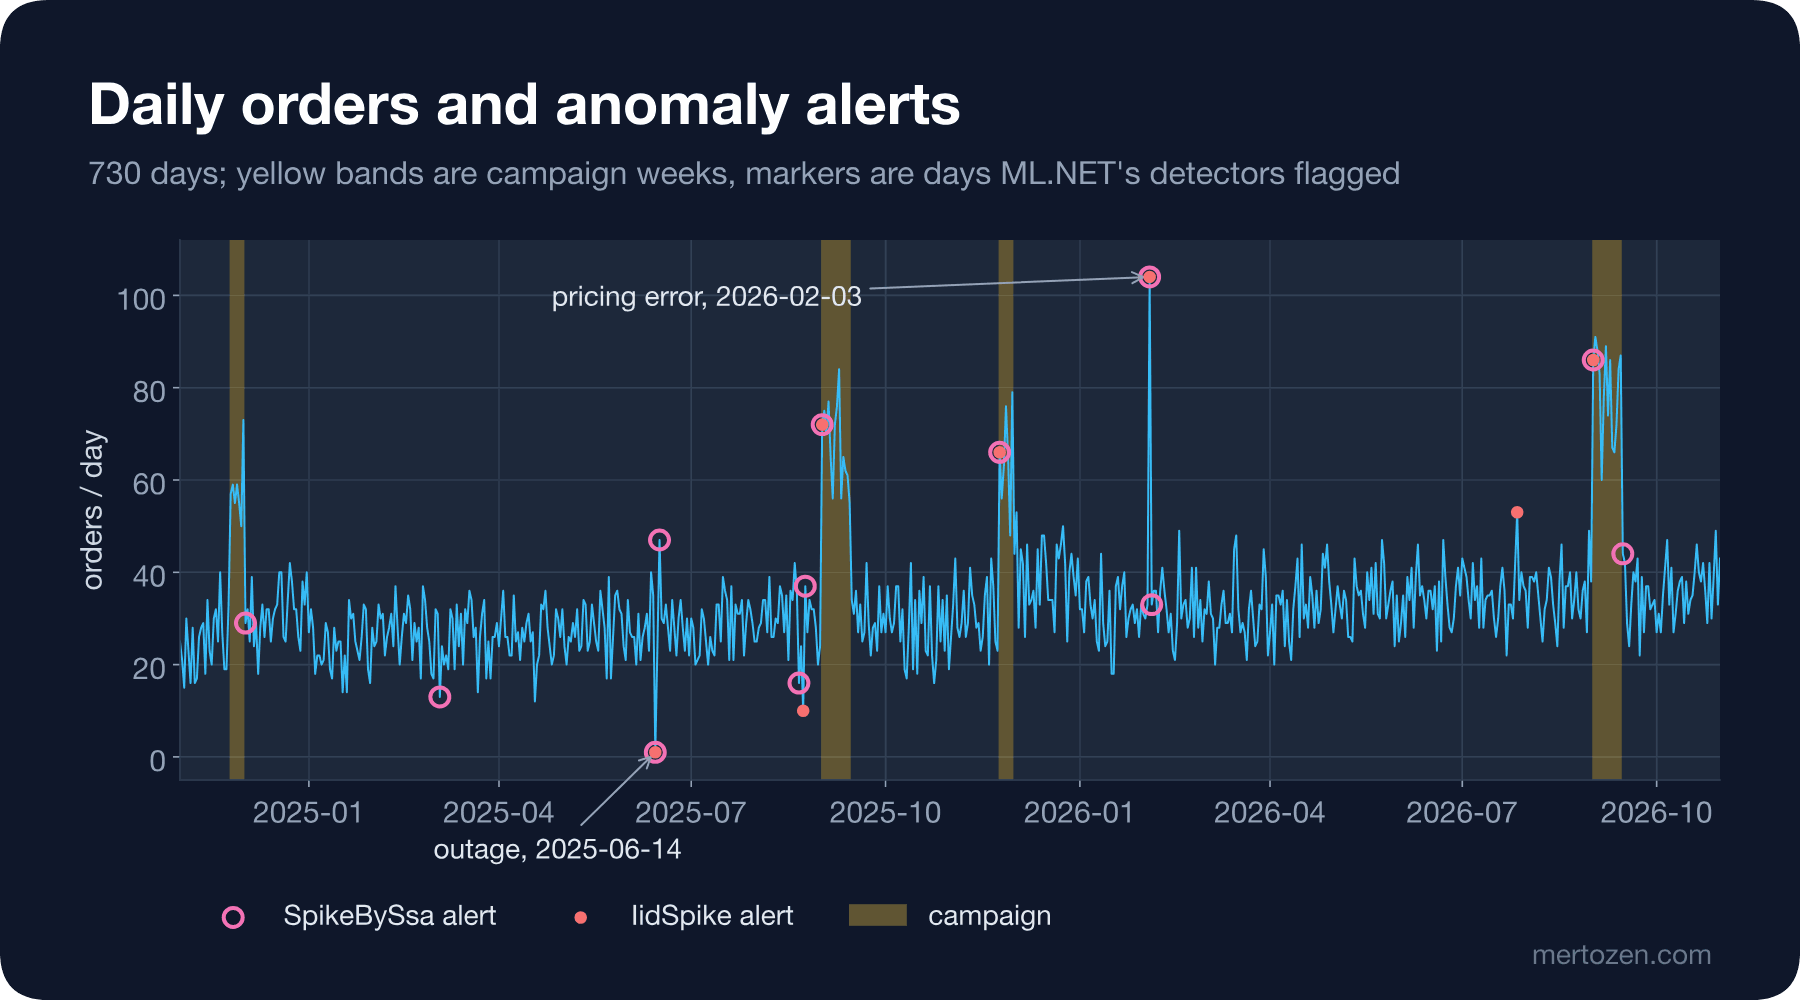
Since there is no label, we compare the alerts with known events. In this synthetic data two days are broken on purpose: on 14 June 2025 only 1 order came in because of a site outage, and on 3 February 2026 a mistyped price brought 104 orders. In real life this information comes from incident records or the operations team. The campaign weeks are known too: the IsCampaign column is in the data.
The answer to the second opening question is in the table. DetectIidSpike raises 7 alerts. 3 of them are the first days of campaign weeks: the number of orders doubles overnight and the detector finds that unusual, but it is a known, planned event. Of the remaining 4 alerts, 2 are the real events and 2 (10 orders on 23 August 2025, 53 orders on 27 July 2026) are extreme values of the noise. So 2 of 7 alerts are useful. DetectSpikeBySsa raises 12 alerts and catches both events, but it has a side effect: it also flags the day after a large deviation (16 June 2025, 4 February 2026), because it uses the previous day's extreme value when it computes the expected value of the series. SR-CNN is the quietest: 3 alerts, it finds only the pricing error and misses the outage. A lower Threshold might catch the outage but would also raise the number of alerts; the precision and recall trade-off from the seventh post applies here as well.
One more note: DetectSeasonality found no weekly period and returned -1. There is a weekly difference, but it is small compared with the daily noise: at around 33 orders a day on average, the random swing between days is larger than the difference between weekdays. Whether "there is seasonality in the data" depends on the measure you use and its threshold.
Watch Out in Production
Do not compute segments once and use them forever. Customer behaviour changes, new customers arrive, and k-means may hand out different group numbers on every retraining. Store the business meaning of the centres (high campaign share, old last order) instead of the group number, and match the new model's groups to the old ones by their centres.
Do not send anomaly alerts straight to a person. First add a filter that separates known events (the campaign calendar, public holidays, planned maintenance), then only log the remaining alerts for a week and count how many of them match a real event. A detector that raises needless alerts leads the team to ignore all alerts.
These detectors process the series in order. In production a new point arrives every day; detectors such as DetectSpikeBySsa have state, and ML.NET offers TimeSeriesPredictionEngine with its CheckPoint method for this. Here we processed the historical series in one batch; for daily use you need to store the model's state.
Check the platform dependency before you deploy. Packages that depend on MKL do not run on an ARM64 server or on a Linux image without OpenMP, and the error only shows up on the first call.
Common Pitfalls
The first pitfall is taking the clustering result for "the right groups". K-means always produces k groups, even if the data does not really have four. The value of segments is measured by whether they lead to a different action on the business side: a campaign announcement for the customer who waits for campaigns, a win-back offer for the dormant one.
The second is running k-means without scaling. With raw columns 3,431 of 3,479 customers fell into one group and the result reflected nothing but spend.
The third is choosing k with a single metric. The silhouette said 3, Davies-Bouldin said 7, the elbow was unclear. Stability across seeds and business meaning matter at least as much as these numbers.
The fourth is counting seasonality and planned events as anomalies. Campaign starts and the December rush are statistically unusual but expected from a business point of view. Use the detector together with a filter that knows these days.
The fifth is expecting k-means to find small but important groups. The 66 institutional customers did not form their own group. Apply a split you already know as a rule, and use k-means to look for structure you do not know.
A Small Experiment
★☆☆ Remove the log transform from the Scaled pipeline so that only NormalizeMeanVariance remains. How do the k = 4 segments change? Do the institutional customers form a separate group this time?
★★☆ Separate the customers who buy more than 20 books per order before clustering and compute the silhouette table again with the remaining customers. Does the best k change?
★★★ Set confidence to 95 and 99.5 in the DetectSpikeBySsa call. For each value count the alerts outside campaigns and write down how many of the two known events it catches. Express your result in terms of precision and recall.
In the next post we automate model selection: we try the difference between hyperparameters and parameters, grid and random search, ML.NET's AutoML API and the mlnet CLI on the cancellation problem, look at which features the model relies on with Permutation Feature Importance and talk about the fairness problems that sensitive features create.