

What Is Machine Learning and When Do You Need It? Choosing Between Rules, ML and LLMs
Machine learning is a function learned from past data instead of rules you write by hand; it pays off when you have labeled data and a measurable goal. We measure a hand-written delivery-time rule for Bookstore on seeded synthetic data, map the problem types (regression, classification, clustering, anomaly detection) to Bookstore examples and discuss when to pick classical ML, deep learning or an LLM.
Version note: The code in this post was built and run with .NET 10. The dataset used in this series is synthetic data produced by the series' seeded generator; it is not a real company's data or business results.
Guess First
You are asked to show an "estimated delivery time" on the order page of Bookstore, the online bookstore used as the shared example across this site's series. You have two years of order history, but the deadline is close, so you write a rule that looks reasonable: 1 day if the customer is less than 100 km from the warehouse, 2 days up to 500 km, 3 days up to 1000 km and 4 days beyond that; Express shipping saves a day, and a book that is out of stock adds five days.
How many days is this rule off on average across 23,202 delivered orders? For what share of orders does the estimate land within one day of the actual time? Pick a number, then keep reading. We will see the answer from a real run a few sections from now.
Writing Rules or Learning from Data?
In classic software you write the rule. Input comes in, your if/else and switch statements process it, and output comes out. The delivery-time rule above works the same way:
public static double EstimateDays(OrderRow o)
{
    double days = o.DistanceKm switch
    {
        < 100 => 1,
        < 500 => 2,
        < 1000 => 3,
        _ => 4,
    };
    if (o.ShippingMethod == "Express") days -= 1;
    if (o.HasBackorderItem) days += 5;
    return Math.Max(1, days);
}
Machine learning turns this around. Instead of writing the rule, you give the system the inputs and what actually happened for those inputs, the correct answers from the past, and the algorithm finds the function that connects them. That function is called a model. The model then predicts the answer for an order it has never seen. You do not choose numbers like 100, 500, 1000 and 5 inside the rule; they are learned from the data.
This definition has a consequence: an ML model can never be better than its data. If you do not have past orders, their attributes and the delivery times that actually happened, there is nothing to learn. ML is not a magic shortcut that replaces writing rules; it is a way to extract rules that are hard to write from data.
This series explains ML from the point of view of a .NET developer. There are no proofs; there is asking the right question, preparing the data properly and measuring the model correctly. The code uses ML.NET, and at the end of the series we will solve the same problem with Python's scikit-learn and bring it to .NET through ONNX.
The Series Data: Synthetic Bookstore Orders
Most ML tutorials use a ready-made dataset downloaded from the internet: Titanic passengers, house prices, iris flowers. In this series every example runs on Bookstore's orders instead. Publishing a real bookstore's order data is not possible, so we generate the data ourselves, and I want to say this clearly from the start: every number in these posts comes from this synthetic data. A sentence like "the carrier got slower" is not about a real company; it is about rules we put into the generator.
The generator is the tools/Bookstore.DataGen project in the repository. For the two years between 2024-11-01 and 2026-10-31 it generates 4,000 customers, their orders, order lines and customer reviews. Each order's delivery time, whether it was cancelled and whether it was returned are decided by rules that are written in the code but never shown to the models in these posts: distance to the warehouse, the carrier, weekends, campaign weeks, out-of-stock books and random noise. The models' job is to rediscover these rules from the data. I suggest you do not read Generator.cs until the end of the series; if you do, you will know in advance what the model should find and the measurements will not surprise you.
After you clone the repository, one command generates the data:
dotnet run --project tools/Bookstore.DataGenseed 2026: 4000 customers, 24290 order rows, 5070 reviews
customers.csv 861f69f58de84d0a
orders.csv c402ea25e0019381
order_items.csv 7ae098da3de8756c
reviews.csv 7383faaa046d6089The last four lines of the output are the first 16 characters of the SHA256 digest of each generated file. With the same seed (2026) these four values should be identical on your machine. That is why the generator does not use System.Random: the .NET documentation explicitly notes that a seeded Random can produce a different sequence on a different version of .NET. Instead I wrote SplitMix64, a small and fully specified pseudo-random generator:
public ulong NextUInt64()
{
    _state += 0x9E3779B97F4A7C15UL;
    ulong z = _state;
    z = (z ^ (z >> 30)) * 0xBF58476D1CE4E5B9UL;
    z = (z ^ (z >> 27)) * 0x94D049BB133111EBUL;
    return z ^ (z >> 31);
}
/// <summary>Uniform double in [0, 1).</summary>
public double NextDouble() => (NextUInt64() >> 11) * (1.0 / (1UL << 53));
Numbers are produced with addition, multiplication and division only; functions such as Math.Log or Math.Sin, whose last digit can depend on the processor, are not used. Files are written with \n line endings and the invariant culture on every platform. I also ran the generator in a Linux x64 container, and the four hashes were identical.
The first lines of data/orders.csv look like this:
OrderId,CustomerId,OrderedAtUtc,City,District,Warehouse,DistanceKm,Carrier,ShippingMethod,ItemCount,TotalWeightKg,OrderTotal,DiscountRate,IsCampaign,PaymentMethod,HasBackorderItem,CustomerNote,IsCancelled,DeliveryDays,TrackingEventCount,IsReturned,ReturnRequestedUtc
O000001,C03947,2024-11-01T05:16:00Z,Izmir,IZM-20,IST-1,480,CarrierA,Standard,1,0.38,209.80,0.00,false,CreditCard,false,,false,2.82,5,false,
O000002,C01509,2024-11-01T05:21:30Z,Istanbul,IST-16,IST-1,25,CarrierA,Standard,1,0.55,269.80,0.00,false,CreditCard,false,,false,1.11,4,false,
Each line is an order: its date, city, the warehouse it shipped from, the distance to that warehouse, the carrier, the number of books, the total, the payment method, the customer's delivery note and, at the end, what actually happened to the order: DeliveryDays, IsCancelled, IsReturned. The file also contains data quality problems that were left in on purpose; we will find them one by one in the next post.
The Rule's Report Card on Real Data
Now let's measure the rule from the opening on this data. Bookstore.ML.Lab is a console application that hosts all experiments of the series; every post adds a command to it:
dotnet run --project src/Bookstore.ML.Lab -- rulesDelivered orders : 23,202
Mean absolute error : 1.05 days
Within +/- 1 day : 63.1 %
Off by 3+ days : 2.9 %
Where the rule is wrong the most (mean error by group):
CarrierC ordered Fri/Sat=True bias -1.86 days (1,163 orders)
CarrierA ordered Fri/Sat=True bias -1.63 days (2,637 orders)
CarrierB ordered Fri/Sat=True bias -1.62 days (2,037 orders)
CarrierC ordered Fri/Sat=False bias -0.70 days (3,530 orders)
CarrierA ordered Fri/Sat=False bias -0.43 days (7,739 orders)
CarrierB ordered Fri/Sat=False bias -0.41 days (6,096 orders)The rule is off by 1.05 days on average and lands within one day of the actual time for 63.1 percent of orders. Was your guess better or worse? Either way, the important part is that saying "the rule is not bad" was impossible without measuring this number. In this series we will compare every model with a simple reference like this, a baseline. This rule is our first baseline.
The second part of the output is more interesting. For orders placed on a Friday or Saturday, the rule underestimates by about 1.6 to 1.9 days for every carrier. A negative bias means the estimate is shorter than reality. Whoever wrote the rule forgot that the warehouse does not work at weekends. You can fix that with another if. But then you also need to add that orders placed after a certain hour wait until the next day, that warehouses slow down in campaign weeks and that one carrier became slower after a certain date. Every new rule interacts with the previous ones, and you find the right numbers by looking at the data anyway. At this point learning the rules from data starts to make more sense than writing them by hand.
Supervised, Unsupervised and Reinforcement Learning
ML problems fall into three big groups depending on whether your data contains the correct answer.
In supervised learning the correct answer is known for every example. That answer is called the label. For delivery time the label is DeliveryDays; the model learns how to get from the attributes of past orders to that number. If the predicted value is a number, the problem is called regression; if it is a category, it is classification. "Will this order be cancelled?" is a binary classification problem, while "is this review about shipping, price or content?" is a multiclass classification problem.
In unsupervised learning there is no label. When you want to group customers by their spending and ordering habits, nobody hands you a list saying "this customer belongs to that group". The algorithm puts similar examples together; this is called clustering. Catching an unusual day on the daily sales chart, anomaly detection, is also usually done without labels.
In reinforcement learning an agent takes actions in an environment and changes its behavior according to the reward it receives. Programs that play games and robotics are the classic examples. This series does not cover reinforcement learning; almost all of Bookstore's everyday problems belong to the first two groups.
Bookstore's Problem Catalog
The table below lists the problems we will solve in this series and the type of each. Filling in this table for your own problem before starting an ML project helps a lot: it makes clear what you predict, where the label comes from and which post covers what.
| Question | Problem type | Label | Post |
|---|---|---|---|
| How many days until this order is delivered? | regression | DeliveryDays | 03–06 |
| Will this order be cancelled? | binary classification | IsCancelled | 07 |
| What is this review about? | multiclass classification | Topic | 07 |
| Which groups do customers fall into? | clustering | none | 08 |
| Is today's number of orders unusual? | anomaly detection | none | 08 |
One problem is missing from the list: "which book should we recommend to this customer?" Recommendation is a separate field that learns from interactions between users and items and has its own algorithms and evaluation methods. For example, a recommender is judged by the order of the list it returns, not by the accuracy of a single prediction. This series does not cover recommendation.
Classical ML, Deep Learning and LLMs
When people say "AI" today, most of them think of LLMs first. Roughly, the map looks like this. Classical ML consists of algorithms such as linear models, decision trees, boosting methods built on ensembles of trees and k-means, and it is used mostly on tabular data, data made of rows and columns. Deep learning trains multi-layer neural networks; it is strong on data with complex structure such as images, audio and large text collections, and it usually needs a GPU. LLMs are a branch of deep learning trained on text at a very large scale. We explained how an LLM works in the first post of the LLM Fundamentals series; in this series we mention deep learning and LLMs only for their place on this map.
The places where classical ML is a better fit than an LLM are clear. The first is tabular data: algorithms designed to predict a number from columns such as an order's distance, carrier and order time are both more accurate and much cheaper at this job than a language model. The second is cost and latency: the models we train in this series will be files between a few kilobytes and a few hundred kilobytes, and prediction will run on an ordinary CPU inside the application's own process, with no network call and no token cost. The third is determinism: the same model gives the same answer to the same input every time. The fourth is explainability: you can measure how much each feature affects a prediction. We will do that in the ninth post.
There are also places where an LLM is the better fit: summarizing text when there is no labeled data, extracting information from free text, talking to the user in natural language. The two are not rivals. Using them together is common too, for example feeding the embeddings produced by an LLM to a classical model as features; I will touch on that idea briefly in the fifth post.
When Not to Use ML
Talking about when ML is unnecessary is as important as talking about when it is needed. In these cases, consider another solution first:
- The rule is clear and stable: if shipping costs a fixed amount for orders under 500 TRY, a model does not learn that, code calculates it.
- There is little or no data: in a new line of business such as institutional orders you cannot train a reliable model with a few hundred records; start with a rule and collect data.
- You cannot measure success: "better predictions" is not enough, you have to define which metric you use and which baseline you compare against.
- You must explain the reason for each individual decision and mistakes are expensive: for decisions such as restricting a customer's payment options, a model can at most be a tool that makes a suggestion to a person.
The ML Workflow
An ML project is more than training a model. The figure below shows the path this series follows and which post covers each step:
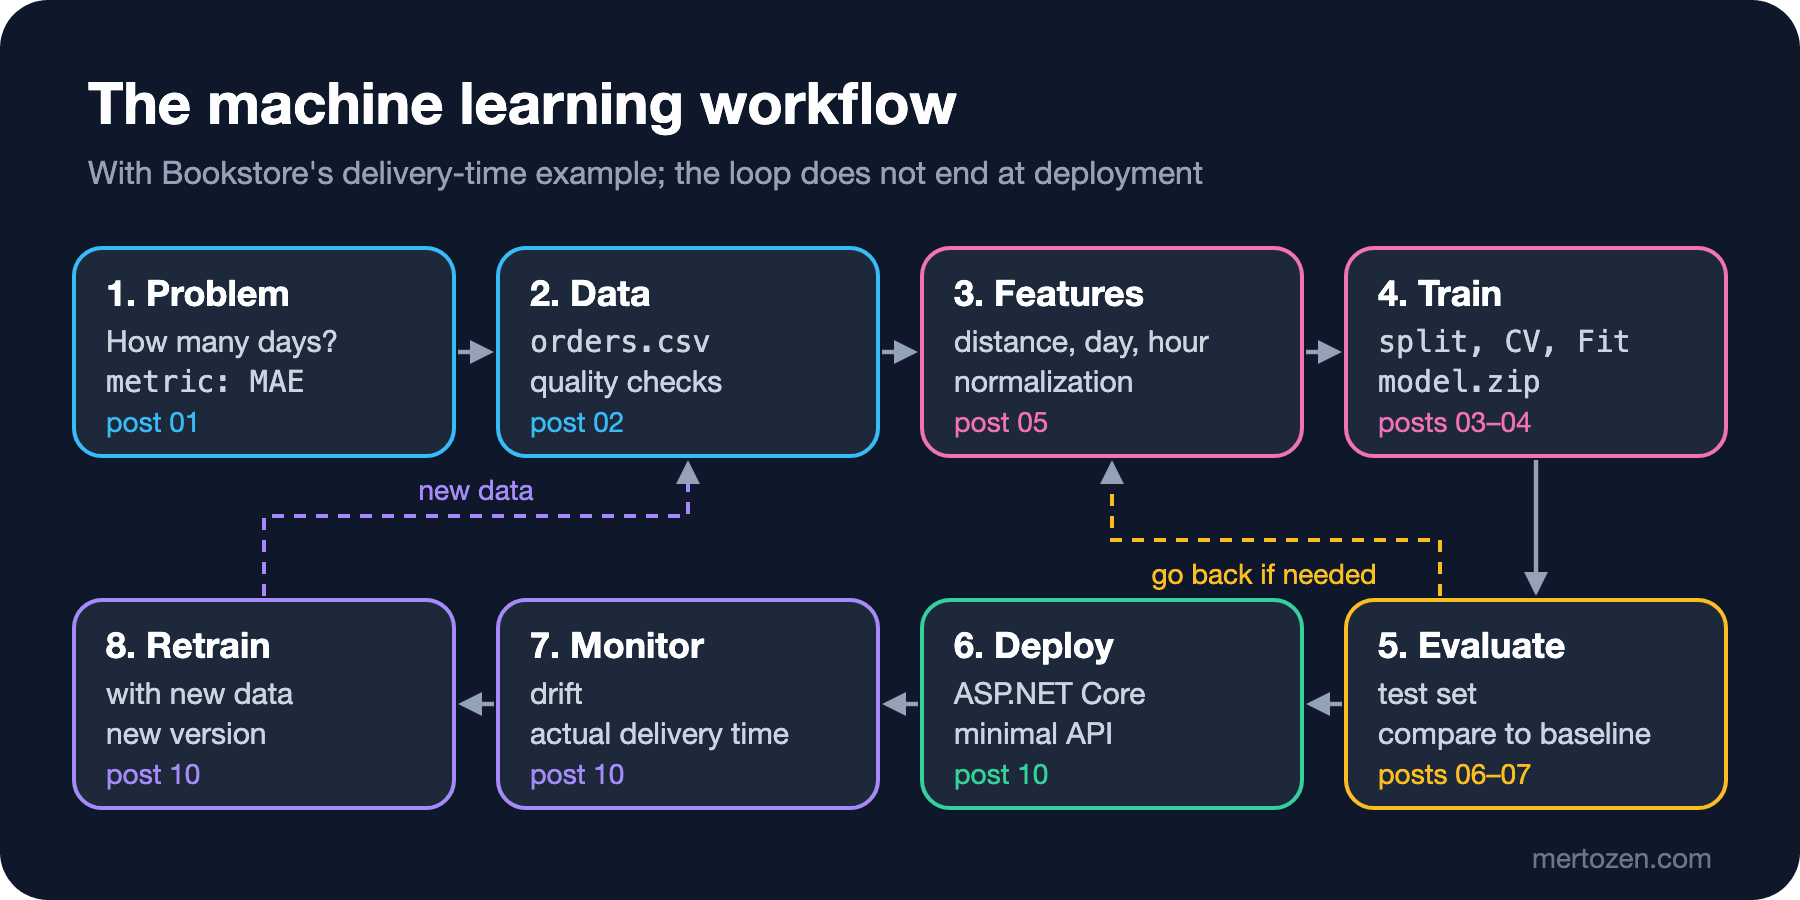
The workflow starts with the problem: we first write down what we predict and which metric we use to measure success. For delivery time that metric will be MAE, the mean absolute error, which tells how many days the prediction is off on average. Then we get to know and clean the data, prepare features, train the model and measure it on data it has not seen. If the result is not good enough, we go back to the features. If it is, the model goes behind an API. But the job does not end there: as actual delivery times arrive we watch how the model behaves, and when the world changes we retrain it with new data. In the third post we will see how a carrier that became slower after a certain date confuses an older model.
Common Pitfalls
The first pitfall is aiming for a model when there is no data. The decision "let's put ML into this project" is often made without checking whether the data exists. Ask first: where is the label stored? For delivery time it is the time between the order date and the delivery date; if those two dates are not reliably recorded in the system, the first job is fixing that record, not building a model.
The second is starting to solve the problem before defining the metric. "A good prediction" can mean different things to the business. Arriving one day later than promised to the customer can be much worse than arriving one day early. If that asymmetry is not discussed up front, you end up with a model whose average error is low but which keeps customers waiting.
The third is building a model without a baseline. The rule above is off by 1.05 days. When a model is off by 0.9 days, is that improvement worth the cost of maintaining the model? You cannot ask this question without a baseline.
The fourth is generalizing results from synthetic data to the real world. The numbers in this series exist to show the methods. If you take the same steps on your own data you will find different numbers; what you should learn is how those numbers are reached.
A Small Experiment
★☆☆ Add a weekend correction to the RuleBaseline.EstimateDays method: add one day to orders placed on a Friday or Saturday. Run the rules command again and see how the mean error, the within-one-day share and the per-group bias change.
★★☆ Run the generator with a different seed: dotnet run --project tools/Bookstore.DataGen -- data-seed7 7. See that all hashes change, then temporarily change the file path in RuleBaseline to measure the rule on this dataset. How much do the numbers move?
★★★ Add two rows to the problem catalog for Bookstore's institutional order module: for example how many hours a purchase approval will take and whether an institution will place an order next month. For each one, write the problem type, which table the label comes from and which metric measures success.
In the next post we look at the data without touching a model: we cover rows, features and labels, the types of features, and we use Microsoft.Data.Analysis and LINQ to find and clean the quality problems in orders.csv.