

Classification and Its Metrics: Confusion Matrix, Precision, Recall, F1 and ROC-AUC

On imbalanced data accuracy misleads; a classification model has to be measured with precision, recall, PR-AUC and a threshold chosen from business costs. We predict Bookstore's order cancellation risk with logistic regression and FastTree and show with real output how 95.8% accuracy catches no cancellation at all, how to pick the threshold by cost on a validation set, how to check calibration, and a multiclass model that predicts the topic of a review.
Version note: The code in this post was built and run with .NET 10, ML.NET 6.0 with the Microsoft.ML 6.0.0 package and Microsoft.ML.FastTree 6.0.0. The data is synthetic Bookstore data produced by the series' seeded generator; the numbers here are not the results of a real business.
Guess First
For Bookstore, the online bookstore used as the shared example across this site's series, we predict a class this time instead of a number: will the order be cancelled? About 4.5% of the orders in the data are cancelled. Imagine a model that scores 95.8% accuracy on the test set. How many of the 198 cancelled orders might it catch?
Second question: if you take 100 orders whose cancellation risk is predicted as 20%, how many of them are actually cancelled? The answer depends on the model, and one of the two models gets this badly wrong.
Binary Classification and Logistic Regression
Classification picks one of a set of predefined classes for each row. With two classes (cancelled or not) it is called binary classification, with more it is multiclass classification. Knowing the cancellation risk when the order is placed is useful: for a risky order you can ask the customer for confirmation by text message, hold back the supplier order for an out-of-stock book until the confirmation arrives, or delay packing.
The model must see only what is known when the order is placed. Remember the data leakage lesson from the third post: the delivery time and the tracking event count are already empty for a cancelled order, and if you make them features the model learns by looking at the answer. We also compute the customer's history strictly backwards. We sort the orders by time and count each customer's orders up to that moment:
public static List<CancelInput> LoadOrders()
{
    Dictionary<string, int> seen = [];
    List<CancelInput> rows = [];
    foreach (OrderRow o in OrderRow.Load("data/orders_clean.csv").OrderBy(o => o.OrderedAtUtc))
    {
        int previous = seen.GetValueOrDefault(o.CustomerId);
        seen[o.CustomerId] = previous + 1;
        rows.Add(new CancelInput
        {
            OrderId = o.OrderId, CustomerId = o.CustomerId, OrderedAtUtc = o.OrderedAtUtc,
            PaymentMethod = o.PaymentMethod, ShippingMethod = o.ShippingMethod, Warehouse = o.Warehouse,
            ItemCount = o.ItemCount, OrderTotal = (float)o.OrderTotal, DiscountRate = (float)o.DiscountRate,
            IsCampaign = o.IsCampaign, HasBackorderItem = o.HasBackorderItem,
            PreviousOrders = previous, IsFirstOrder = previous == 0, IsCancelled = o.IsCancelled,
        });
    }
    return rows;
}
The feature pipeline is similar to the earlier posts: one-hot encoding for the categorical columns, 0/1 for the booleans, then normalization. The trainer is logistic regression:
public static readonly string[] OrderFeatures =
    ["Payment", "Method", "WarehouseKey", "Campaign", "Backorder", "FirstOrder", "ItemCount", "OrderTotal",
     "DiscountRate", "PreviousOrders"];
/// <summary>One-hot categories, booleans as 0/1, then mean/variance normalization for the linear model.</summary>
public static IEstimator<ITransformer> Features(MLContext ml, string[]? extra = null) =>
    ml.Transforms.Categorical.OneHotEncoding(
            [new("Payment", "PaymentMethod"), new("Method", "ShippingMethod"), new("WarehouseKey", "Warehouse")])
        .Append(ml.Transforms.Conversion.ConvertType(
            [new("Campaign", "IsCampaign"), new("Backorder", "HasBackorderItem"), new("FirstOrder", "IsFirstOrder")],
            DataKind.Single))
        .Append(ml.Transforms.Concatenate("Features", [.. OrderFeatures, .. extra ?? []]))
        .Append(ml.Transforms.NormalizeMeanVariance("Features"));
public static IEstimator<ITransformer> Logistic(MLContext ml) =>
    ml.BinaryClassification.Trainers.LbfgsLogisticRegression(new LbfgsLogisticRegressionBinaryTrainer.Options
    {
        LabelColumnName = "IsCancelled", FeatureColumnName = "Features", NumberOfThreads = 1,
    });
Logistic regression does the same thing as the linear model in the regression post: it computes a weighted sum of the features. ML.NET calls this number the score. The difference is that the score goes through the sigmoid function. Sigmoid squeezes a number that can run from minus infinity to plus infinity into the range between 0 and 1: a large positive score goes towards 1, a large negative score towards 0, and zero to exactly 0.5. The result is written to the Probability column. The class decision is made with a threshold: the default threshold is 0.5, and when the probability is 0.5 or higher PredictedLabel becomes true. L-BFGS, an optimization algorithm that approximates curvature from the gradient differences of the last few steps, finds the weights that minimize the loss. In classification the loss is log-loss: a model that gives a low probability to an order that really was cancelled is punished heavily.
Train, Validation and Test
In this post we split the data three ways. Since we are going to choose a threshold, we need a separate validation set; the test set will be used only once, at the very end. We group the split by CustomerId so that a customer's orders stay on the same side:
// 60/20/20 grouped by customer: train, validation (for the threshold), test (reported once)
var first = ml.Data.TrainTestSplit(all, testFraction: 0.2, samplingKeyColumnName: "CustomerId", seed: 7);
// A different seed: with seed 7 again, validation got only 1,169 orders
var second = ml.Data.TrainTestSplit(first.TrainSet, testFraction: 0.25, samplingKeyColumnName: "CustomerId", seed: 11);
IDataView train = ml.Data.Cache(second.TrainSet), validation = second.TestSet, test = first.TestSet;
foreach ((string name, IDataView set) in new[] { ("train", train), ("validation", validation), ("test", test) })
{
    bool[] labels = [.. set.GetColumn<bool>("IsCancelled")];
    Console.WriteLine($"{name,-11}{labels.Length,7:N0} orders, {labels.Count(l => l),4} cancelled ({100.0 * labels.Count(l => l) / labels.Length:F1}%)");
}
// Two models: a linear one and gradient-boosted trees, both on the same features
ITransformer logistic = Features(ml).Append(Logistic(ml)).Fit(train);
ITransformer trees = Features(ml).Append(ml.BinaryClassification.Trainers.FastTree(
    labelColumnName: "IsCancelled", featureColumnName: "Features")).Fit(train);
dotnet run --project src/Bookstore.ML.Lab -- canceltrain 14,397 orders, 673 cancelled (4.7%)
validation 5,096 orders, 204 cancelled (4.0%)
test 4,687 orders, 198 cancelled (4.2%)
test set, threshold 0.5 Accuracy AUC PR-AUC Precision Recall F1
LogisticRegression 0.958 0.724 0.110 0.000 0.000 0.000
FastTree 0.957 0.643 0.091 0.273 0.015 0.029
TEST POSITIVE RATIO: 0.0422 (198.0/(198.0+4489.0))
Confusion table
||======================
PREDICTED || positive | negative | Recall
TRUTH ||======================
positive || 0 | 198 | 0.0000
negative || 0 | 4,489 | 1.0000
||======================
Precision || 0.0000 | 0.9578 |The comment in the code comes from a real mistake. In my first attempt I gave the second split seed: 7 as well, and the validation set ended up with only 1,169 orders. In ML.NET's source code a grouped split hashes the key column with the seed, places it in the range 0–1 and gives the test set the testFraction slice at the start of that range. The first split had put the 0–0.20 slice into the test set. With the same seed the second split produced the same hash values and again asked for the 0–0.25 slice; most of that slice was already in the test set, so only 0.20–0.25 was left. 1,169 orders is about 5% of all the data. With a different seed the sets are 14,397 train, 5,096 validation and 4,687 test orders. If you nest splits, always print the set sizes.
Why Accuracy Misleads
The answer to the first opening question is in the table. Logistic regression scores 0.958 accuracy on the test set and catches none of the 198 cancelled orders. ML.NET's confusion matrix table shows it plainly: the model says "not cancelled" to every order. No order's probability reaches 0.5, so this threshold produces no positive prediction at all.
A confusion matrix splits the predictions into four groups. TP, true positive: cancelled and the model said cancelled. FP, false positive: not cancelled but the model said cancelled, in other words a false alarm. FN, false negative: cancelled but the model missed it. TN, true negative: not cancelled and the model did not say cancelled. Accuracy is the share of correct predictions: (TP + TN) / total. If the positive class is 4.2%, a model that says "nobody cancels" scores 0.958 without learning anything. With imbalanced classes, accuracy almost always measures this majority-class baseline.
Precision, Recall, F1, ROC-AUC and PR-AUC
On imbalanced data the metrics to look at are the ones that focus on the positive class:
- Precision = TP / (TP + FP): of the orders we called "cancelled", how many really were? It measures the cost of false alarms.
- Recall = TP / (TP + FN): how many of the cancelled orders did we catch? It measures the cost of missed cancellations.
- F1 is the harmonic mean of precision and recall: if either is low, F1 stays low. It is what you use when you want a single number.
- ROC-AUC is the area under the receiver operating characteristic curve, which equals the chance that a randomly chosen cancellation gets a higher probability than a randomly chosen normal order. It does not depend on the threshold and measures how well the model ranks. Random guessing scores 0.5.
- PR-AUC is the area under the precision-recall curve: also independent of the threshold, but focused on the positive class. A random model's PR-AUC equals the share of the positive class, about 0.042 here.
With this in mind, look at the table again. Logistic regression has a ROC-AUC of 0.724 and a PR-AUC of 0.110. So the model does move orders that will be cancelled up the ranking and scores about 2.6 times the PR-AUC of a random model, but it gives no order a high probability. FastTree's ROC-AUC is 0.643. On this data the tree model is weaker than the linear one: the cancellation risk behaves like a sum of a few independent factors, and the trees also learn chance interactions in 14 thousand training rows. At the 0.5 threshold FastTree's precision looks like 0.273, but that means 3 of 11 positive predictions were right. Do not draw conclusions from numbers this small.
Let's also build a baseline that uses no model. First we look at the cancellation rate by two columns in the training set, then we measure a two-condition rule written from that information on the test set. It matters not to build the rule by looking at the test set; otherwise the rule is tuned to the test set too:
// Cancellation rate per payment method and stock state, from the training set only
List<CancelInput> trainRows = [.. ml.Data.CreateEnumerable<CancelInput>(train, reuseRowObject: false)];
Console.WriteLine();
foreach (IGrouping<string, CancelInput> g in trainRows
             .GroupBy(r => r.PaymentMethod)
             .Concat(trainRows.GroupBy(r => r.HasBackorderItem ? "back-ordered" : "in stock")))
{
    Console.WriteLine($"{g.Key,-16}{g.Count(),7:N0} orders, cancelled {g.Average(r => r.IsCancelled ? 1.0 : 0.0),6:P1}");
}
// Baselines: "nobody cancels" and a hand-written rule
List<CancelInput> testRows = [.. ml.Data.CreateEnumerable<CancelInput>(test, reuseRowObject: false)];
Print("rule: COD or back-order", Counts(testRows.Select(r => (r.IsCancelled,
    r.PaymentMethod == "CashOnDelivery" || r.HasBackorderItem))));
CashOnDelivery 2,816 orders, cancelled 9.1 %
CreditCard 10,586 orders, cancelled 3.6 %
BankTransfer 995 orders, cancelled 3.0 %
in stock 13,975 orders, cancelled 4.4 %
back-ordered 422 orders, cancelled 12.6 %
rule: COD or back-order: TP 112, FP 922, FN 86, TN 3,567 | accuracy 0.785, precision 0.108, recall 0.566, cost 6,206 TLCash-on-delivery (CashOnDelivery) orders are cancelled at 9.1%, orders with an out-of-stock book at 12.6%; the average is 4.7%. The rule that flags orders with either condition catches more than half of the cancellations on the test set (0.566 recall), but only about one in nine of the orders it flags is actually cancelled (0.108 precision). We will soon see whether the model beats this rule.
Choosing the Threshold from Business Costs
The 0.5 threshold has no special meaning; it is just a default. The right threshold depends on what the two kinds of error cost the business. For Bookstore, let's assume this: a false alarm means a confirmation message to the customer and a little annoyance, costing 3 TL. A missed cancellation means books picked, packed and perhaps ordered from the supplier for nothing, costing 40 TL. These two numbers are assumptions made up for this post; in a real project they are set together with the finance and operations teams.
/// <summary>Assumed costs (TL): an SMS confirmation for a false alarm, wasted picking and supplier order for a miss.</summary>
private const double FalseAlarmCost = 3, MissedCancelCost = 40;
private static double Cost(int falsePositives, int falseNegatives) =>
    falsePositives * FalseAlarmCost + falseNegatives * MissedCancelCost;
We sweep the threshold on the validation set only. For each threshold we compute the confusion matrix and write the total cost:
// Threshold sweep on the validation set only
List<CancelScore> val = Scores(ml, logistic, validation);
List<string> csv = ["threshold,precision,recall,flagged"];
Console.WriteLine();
Console.WriteLine($"{"validation",-11}{"flagged",8}{"TP",5}{"FP",6}{"FN",5}{"Precision",11}{"Recall",8}{"F1",7}{"cost TL",9}");
(double Threshold, double Cost) best = (0, double.MaxValue);
for (double t = 0.02; t <= 0.301; t += 0.01)
{
    (int tp, int fp, int fn, int tn) = Counts(val.Select(s => (s.IsCancelled, s.Probability >= t)));
    double precision = tp + fp == 0 ? 0 : (double)tp / (tp + fp), recall = (double)tp / (tp + fn);
    double cost = Cost(fp, fn);
    csv.Add(string.Create(CultureInfo.InvariantCulture, $"{t:F2},{precision:F4},{recall:F4},{tp + fp}"));
    if (cost < best.Cost) best = (t, cost);
    if (Math.Round(t * 100) % 2 == 0)
    {
        Console.WriteLine($"t = {t,-7:F2}{tp + fp,8}{tp,5}{fp,6}{fn,5}{precision,11:F3}{recall,8:F3}" +
                          $"{F1(precision, recall),7:F3}{cost,9:N0}");
    }
}
Console.WriteLine($"lowest validation cost at t = {best.Threshold:F2}; " +
                  $"cost ratio {FalseAlarmCost} / ({FalseAlarmCost} + {MissedCancelCost}) = {FalseAlarmCost / (FalseAlarmCost + MissedCancelCost):F3}");
validation flagged TP FP FN Precision Recall F1 cost TL
t = 0.02 5065 204 4861 0 0.040 1.000 0.077 14,583
t = 0.04 1948 141 1807 63 0.072 0.691 0.131 7,941
t = 0.06 1188 100 1088 104 0.084 0.490 0.144 7,424
t = 0.08 473 40 433 164 0.085 0.196 0.118 7,859
t = 0.10 332 27 305 177 0.081 0.132 0.101 7,995
t = 0.12 152 13 139 191 0.086 0.064 0.073 8,057
t = 0.14 73 9 64 195 0.123 0.044 0.065 7,992
t = 0.16 58 7 51 197 0.121 0.034 0.053 8,033
t = 0.18 40 3 37 201 0.075 0.015 0.025 8,151
t = 0.20 27 3 24 201 0.111 0.015 0.026 8,112
t = 0.22 10 2 8 202 0.200 0.010 0.019 8,104
t = 0.24 7 1 6 203 0.143 0.005 0.009 8,138
t = 0.26 7 1 6 203 0.143 0.005 0.009 8,138
t = 0.28 7 1 6 203 0.143 0.005 0.009 8,138
t = 0.30 5 0 5 204 0.000 0.000 0.000 8,175
lowest validation cost at t = 0.06; cost ratio 3 / (3 + 40) = 0.070
test, LogisticRegression t = 0.06: TP 118, FP 976, FN 80, TN 3,513 | accuracy 0.775, precision 0.108, recall 0.596, cost 6,128 TL
test, flag nobody (t = 1): TP 0, FP 0, FN 198, TN 4,489 | accuracy 0.958, precision 0.000, recall 0.000, cost 7,920 TL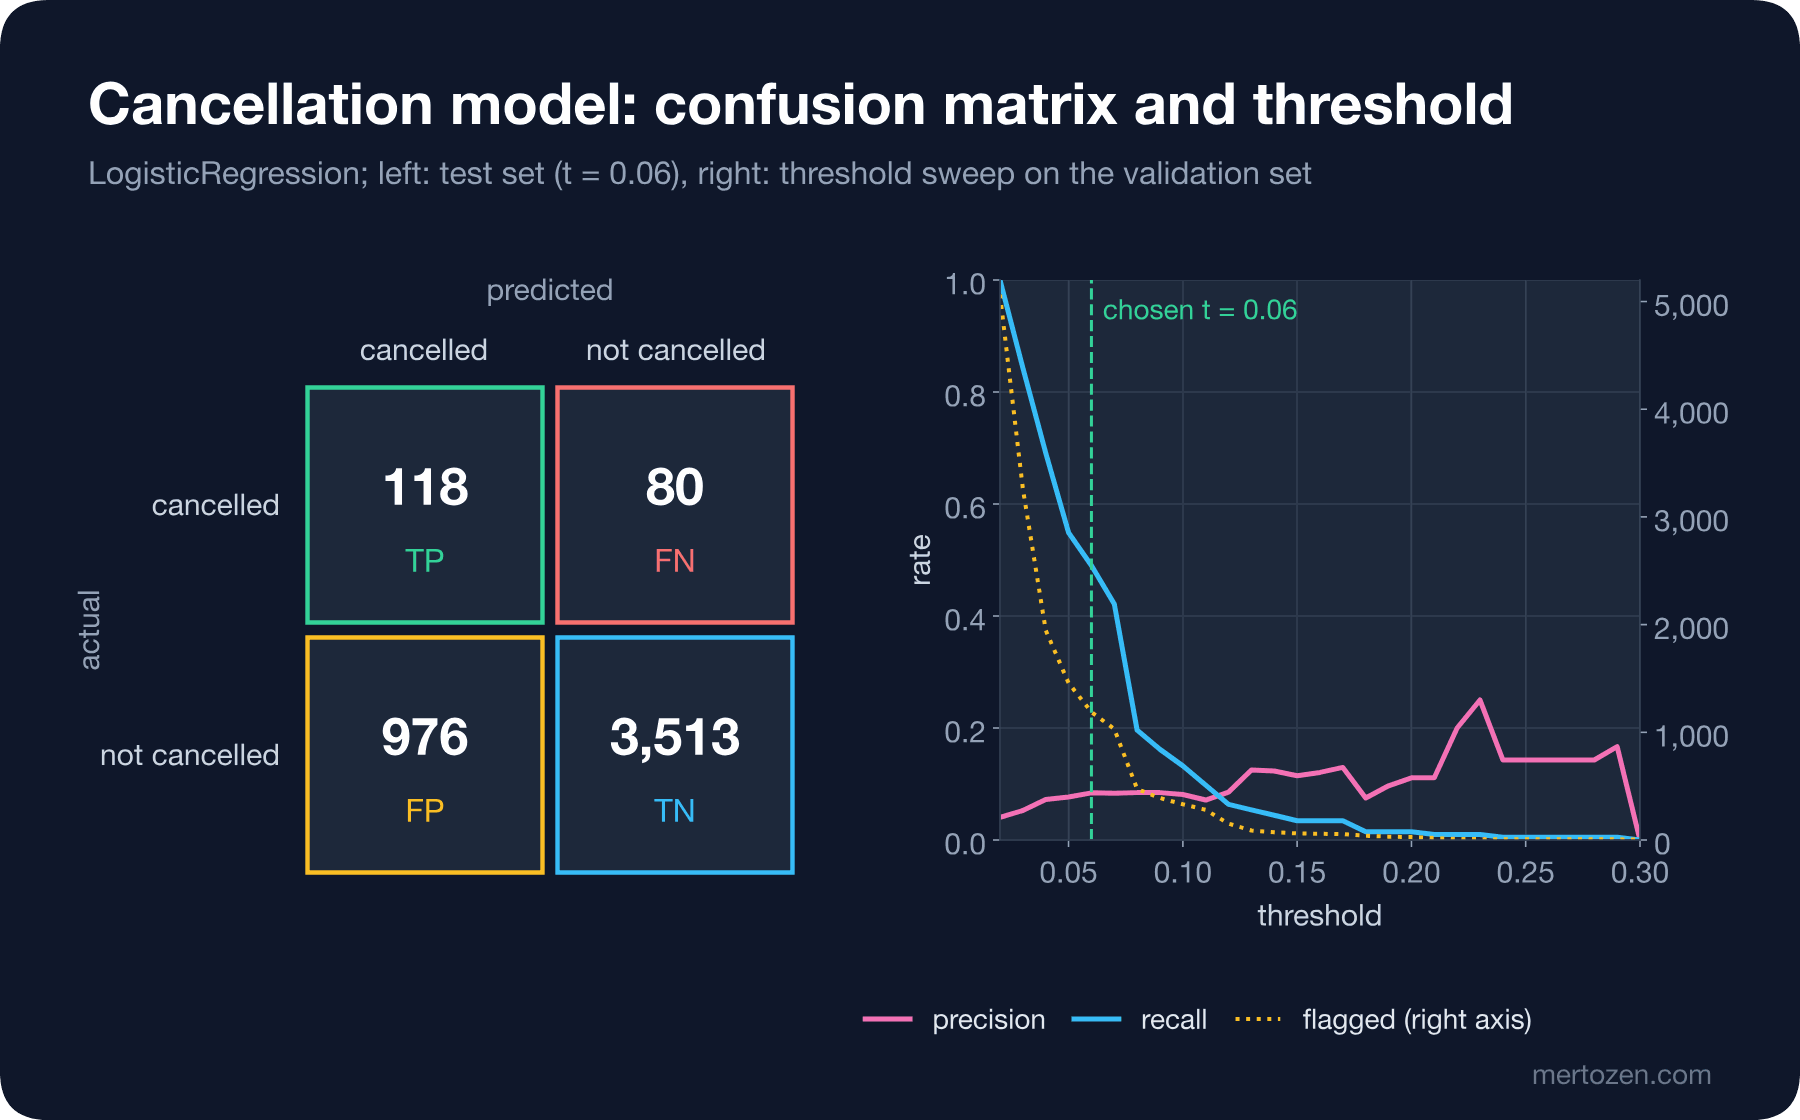
As the threshold drops, recall rises but the number of flagged orders grows fast: at 0.02 every order is flagged and the cost is 14,583 TL. As the threshold rises, false alarms fall but missed cancellations rise. The lowest validation cost is at 0.06. The ratio on the last line of the output is worth a look too: if the probabilities are well calibrated, flagging an order only pays off when its cancellation probability is above 3 / (3 + 40) = 0.070. The sweep stops very close to this theoretical value.
We apply the chosen 0.06 to the test set once: 1,094 orders are flagged and 118 of the 198 cancelled orders are caught. Precision 0.108, recall 0.596, cost 6,128 TL. Flagging no order costs 7,920 TL. The hand-written rule stayed at 6,206 TL. The model beats the rule by only 78 TL; that is the honest result. On this data most of the cancellation signal comes from two columns and a two-line rule already captures it. The model's real contribution is that it gives a probability you can rank instead of a single flag: when costs change, moving the threshold is easier than changing code, and you can pick different operating points, such as calling only the riskiest 1% of orders.
Calibration: Does 0.20 Really Mean 20%?
Deriving the threshold from costs depends on the probability really behaving like a probability. The way to check this is to split the test predictions into probability bands and compare the mean predicted probability with the actual cancellation rate in each band:
probability band   LR orders predicted  actual  FT orders predicted  actual
0.00 - 0.03            1,658     2.8 %   1.6 %      2,804     2.0 %   2.7 %
0.03 - 0.06            1,935     3.8 %   2.7 %        959     4.2 %   5.0 %
0.06 - 0.10              765     7.5 %   9.8 %        513     7.8 %   6.2 %
0.10 - 0.15              280    11.7 %  11.4 %        229    12.1 %   7.0 %
0.15 - 1.00               49    20.7 %  22.4 %        182    26.7 %  13.7 %
Here is the answer to the second opening question. Above 0.15, logistic regression says 20.7% on average and the actual rate is 22.4%. In the other bands the gap stays within a few points too. FastTree says 26.7% in the same band, but the actual rate is 13.7%: it is twice as optimistic about the orders it is most sure of. In ML.NET, FastTree's binary trainer produces Probability by passing the raw score through a Platt calibrator, a small model that turns the score into a probability with a sigmoid. Because the calibrator learns on the training data, the high scores of a tree model that fits the training data too closely turn into exaggerated probabilities on the test set. If you are going to feed the probability into a decision rule or a cost calculation, always check calibration with a table like this.
Multiclass: Predicting the Topic of a Review
The second problem is sorting customer reviews by topic: Shipping, Price, Content (what the book is about) and PrintQuality. The right topic sends the review to the right team. FeaturizeText from the fifth post turns the text into n-gram features. The SDCA-based maximum entropy trainer is the multiclass counterpart of logistic regression; SDCA, stochastic dual coordinate ascent, is an optimization algorithm that moves forward one example at a time. The label is a string, so we first convert it to a key type with MapValueToKey and convert the prediction back with MapKeyToValue:
MLContext ml = new(seed: 1);
IDataView data = ml.Data.LoadFromTextFile<ReviewInput>("data/reviews.csv",
    new TextLoader.Options { HasHeader = true, Separators = [','], AllowQuoting = true });
var split = ml.Data.TrainTestSplit(data, testFraction: 0.2, seed: 7);
var pipeline = ml.Transforms.Conversion.MapValueToKey("Label", "Topic")
    .Append(ml.Transforms.Text.FeaturizeText("Features", "Text"))
    .Append(ml.MulticlassClassification.Trainers.SdcaMaximumEntropy(new SdcaMaximumEntropyMulticlassTrainer.Options
    {
        LabelColumnName = "Label", FeatureColumnName = "Features", NumberOfThreads = 1,
    }))
    .Append(ml.Transforms.Conversion.MapKeyToValue("PredictedTopic", "PredictedLabel"));
ITransformer model = pipeline.Fit(split.TrainSet);
IDataView scored = model.Transform(split.TestSet);
MulticlassClassificationMetrics m = ml.MulticlassClassification.Evaluate(scored);
dotnet run --project src/Bookstore.ML.Lab -- topicstest reviews 997; always 'Content': accuracy 0.348
MicroAccuracy 0.947 MacroAccuracy 0.935 LogLoss 0.233 LogLossReduction 0.827
Confusion table
||================================
PREDICTED || 0 | 1 | 2 | 3 | Recall
TRUTH ||================================
0. Content || 339 | 1 | 1 | 6 | 0.9769
1. Price || 4 | 197 | 3 | 8 | 0.9292
2. PrintQuality || 11 | 2 | 134 | 7 | 0.8701
3. Shipping || 6 | 1 | 3 | 274 | 0.9648
||================================
Precision ||0.9417 |0.9801 |0.9504 |0.9288 |
wrong predictions (first five):
label PrintQuality predicted Content max score 0.99 "I read Anna Karenina in two days."
label Price predicted Content max score 0.77 "Not worth the money at this price. Life of Pi is a masterpiece and I could not put it down."
label Price predicted Shipping max score 0.97 "Arrived the next day and well packed. Read it for my book club."
label Price predicted Shipping max score 0.55 "Not worth the money at this price. Arrived the next day and well packed. Ordered it for my son."
label Shipping predicted Content max score 0.56 "Shipping was really slow this time. The story was slow and boring. Recommended."A baseline that always says the most frequent topic (Content) scores 0.348 accuracy; the model scores 0.947. Multiclass has two accuracies. MicroAccuracy is the share of all test rows predicted correctly: 944 of 997 reviews. MacroAccuracy computes the recall of each class separately and averages them, so every class counts equally. Here it is 0.935, because the recall of the smallest class, PrintQuality, is 0.870. If the classes are imbalanced and the small class matters, look at the macro value; the micro value shows how well the large classes do.
In the confusion table the rows are the actual and the columns the predicted classes. The most frequent error is 11 reviews labelled PrintQuality predicted as Content. The first five wrong predictions show two different causes. The first is label errors: "I read Anna Karenina in two days." is clearly about the content, but its label is PrintQuality. The model is right here and the label is wrong. The second is reviews with more than one topic: a review that complains about the price and praises the book has no single correct label. We found mislabelled reviews in the quality report of the second post, and reviews with mixed topics are common in the data too. That is why the measured 0.947 sits below a ceiling, and you should not expect it to reach 100%.
Watch Out in Production
The threshold is part of the business decision, not of the model. Version it together with the model, keep its value in configuration and document it together with the cost assumptions. When the costs change, choose the threshold again on validation data.
The share of the positive class changes over time. If the cancellation rate rises during campaign periods, the same threshold flags more orders. In production, track the share of flagged orders and the actual cancellation rate; we come back to this under drift in the tenth post.
Metrics are noisy on small test sets. In a recall computed from 198 positive examples, a difference of a few orders moves the percentage noticeably. Compare models with cross-validation and use the test set only for the final report.
Inspect the errors of a multiclass model with the confusion table, not with a few random examples. A systematic confusion, such as print-quality reviews mistaken for content, often shows that the label definitions in the training data are vague; the fix is the labelling guide, not the model.
Common Pitfalls
The first pitfall is ignoring class imbalance and reporting accuracy. 95.8% accuracy means "the model that does nothing" on this data. When the positive class is small, talk in precision, recall and PR-AUC, and always write the majority-class baseline next to them.
The second is tuning the threshold on the test set. If you pick the best threshold on the test set and report the metric on the same set, you make the same mistake as in model selection. The threshold is a hyperparameter too: choose it on the validation set and measure it once on the test set.
The third is mistaking a probability for certainty. For the orders FastTree called 26.7%, the actual rate was 13.7%. If you are going to show the model's probability to a customer or feed it into a cost calculation, look at the calibration table first.
The fourth is using the same seed in nested splits. In a grouped split this can quietly shrink the validation set. Print the set sizes and positive rates after every split.
The fifth is mistaking a label error for a model error. Some of the wrong predictions are actually wrong labels. Do not start changing the model before reading the errors.
A Small Experiment
★☆☆ Change the costs from 3 TL and 40 TL to 10 TL and 40 TL. The theoretical threshold becomes 10 / 50 = 0.20. Where does the validation sweep land? Can the model still beat the "flag nothing" strategy at these costs?
★★☆ Add the customer's number of earlier cancellations to the Features method. Is this known when the order is placed? Compute it the same way as PreviousOrders, with a counter that only looks at the past, and watch how ROC-AUC changes.
★★★ Add the Rating column as a feature in the Topics experiment. Which class's recall changes? Then read the wrong predictions one by one and estimate how many of them are label errors.
In the next post we move to data without labels: we segment customers with k-means using RFM features, that is recency, frequency and monetary value, run anomaly detection on the daily sales series and discuss how to judge a result when there is no right answer.