

Data and Features: Datasets, Labels, Feature Types and Data Quality
Everything a model can learn lives in rows, features and the label, so the first job is to look at the data, not the model. In Bookstore's synthetic order export we use Microsoft.Data.Analysis and LINQ to find 104 duplicate orders, 62 spellings of 16 cities, totals stored in kuruş, negative labels and mislabeled reviews, then discuss cleaning decisions and keeping personal data out of training.
Version note: The code in this post was built and run with .NET 10 and Microsoft.Data.Analysis 0.24.0. The data is synthetic Bookstore data produced by the series' seeded generator.
Guess First
You have a 24,290-line order export from Bookstore, the online bookstore used as the shared example across this site's series. If you feed this file straight into a model, will the model notice and fix the duplicate lines, four different spellings of the same city, a few totals stored in kuruş and negative delivery times? If it does not notice them, what will they do to the model?
The short answer: the model notices none of them. It accepts every row you give it as true and learns from the broken rows too. In this post we look at the data without touching a model and find these problems one by one.
Rows, Features and the Label
In supervised learning the data is a table. Each row, also called an example or an instance in the literature, is a single observation: for us, a single order. Some of the columns are features, the information the model uses to make a prediction: distance to the warehouse, the carrier, the number of books, the time of the order. One column is the label, the value the model learns to predict. In the delivery-time problem the label is DeliveryDays.
A single question decides whether a column can be a feature: will I have this information at prediction time? We want to show the estimated delivery time at the moment the order is placed. At that moment the distance, the carrier and the order time are known. But TrackingEventCount, the number of events recorded in the carrier's tracking system, IsReturned and ReturnRequestedUtc only exist after delivery. Being in the file does not put these columns on the feature list. In the next post we will measure how feeding them to the model produces fake success.
Feature Types
ML algorithms work only with numbers in the end. In raw data, however, features come in different types and each type enters the model in a different way:
- Numeric:
DistanceKm,ItemCount,TotalWeightKg,OrderTotal. Used directly as numbers, but their scales are very different (1 to 120 books, 0.25 to 122 kilograms); some algorithms need normalization. - Categorical:
City,Warehouse,Carrier,ShippingMethod,PaymentMethod. There is no order between the values; "CarrierB is twice CarrierA" means nothing. They usually enter the model through one-hot encoding.Districtis a high-cardinality categorical feature with hundreds of distinct values. - Boolean:
IsCampaign,HasBackorderItem. Converted to 0 and 1. - Text:
CustomerNote, the customer's delivery note. Turned into counts of words and word groups. - Date:
OrderedAtUtc. A raw date is of little use on its own; it becomes meaningful when split into parts such as day of week, hour and campaign period.
We will do all these transformations with ML.NET in the fifth post under the heading of feature engineering. In this post we only look at the state of the data.
Where Does the Data Come From?
In a real Bookstore this table does not exist ready-made. Orders are spread across the order, order line, shipment and customer tables in the BookstoreDb database on SQL Server. The training data is extracted with a query that joins these tables, exported as CSV and read as an IDataView on the ML.NET side. In this series we leave the query part to the generator, but that query has a trap you should know about.
An export query usually reads the current state of the tables: the customer's current address, current segment, the product's current price. The model, however, will predict with the information available at order time. If a customer moved last month, an order from two years ago enters training with the new city, and the model learns from a delivery that never happened. When you extract training data, ask for every column: what was this value at order time? If necessary, copy the value into the order table at that moment; that is why Bookstore's order row stores the city and the distance.
A First Look with DataFrame
One way to take a quick look at tabular data in .NET is the DataFrame in the Microsoft.Data.Analysis package. The package comes from the same repository as ML.NET and is still published with a 0.x version number; the version that ships with ML.NET 6.0 is 0.24.0:
dotnet add src/Bookstore.ML.Lab package Microsoft.Data.Analysis --version 0.24.0public static void Run()
{
DataFrame df = DataFrame.LoadCsv("data/orders.csv");
Console.WriteLine($"{df.Rows.Count:N0} rows, {df.Columns.Count} columns");
DataFrame some = new(
df.Columns["OrderedAtUtc"], df.Columns["City"], df.Columns["DistanceKm"], df.Columns["TotalWeightKg"],
df.Columns["CustomerNote"], df.Columns["DeliveryDays"], df.Columns["ReturnRequestedUtc"]);
Console.WriteLine(some.Info());
DataFrame numeric = new(
df.Columns["DistanceKm"], df.Columns["ItemCount"], df.Columns["TotalWeightKg"],
df.Columns["OrderTotal"], df.Columns["DeliveryDays"]);
Console.WriteLine(numeric.Description());
// Description() divides by all rows, nulls included; compare with a LINQ average over non-null values
PrimitiveDataFrameColumn<float> label = (PrimitiveDataFrameColumn<float>)df.Columns["DeliveryDays"];
Console.WriteLine($"DeliveryDays mean over non-null values: {label.Where(v => v.HasValue).Average(v => v!.Value):F4}");
}dotnet run --project src/Bookstore.ML.Lab -- explore24,290 rows, 22 columns
Info OrderedAtUtc City DistanceKm TotalWeightKg CustomerNote DeliveryDays ReturnRequestedUtc
DataType System.DateTime System.String System.Single System.Single System.String System.Single System.String
Length (excluding null values)24290 24290 24290 23529 24290 23208 24290
Description DistanceKm ItemCount TotalWeightKg OrderTotal DeliveryDays
Length (excluding null values)24290 24290 23529 24290 23208
Max 1600 120 122.1 46980 38.17
Min 20 1 0.25 147.83 -4.35
Mean 284.98105 2.7785509 1.5052913 718.8988 2.4667072
DeliveryDays mean over non-null values: 2.5817LoadCsv inferred the column types on its own: the date as DateTime, numbers as Single, the rest as String. The "Length (excluding null values)" row shows missing values: the weight is empty in 761 of the 24,290 rows (23,529) and the delivery time in 1,082 (23,208). But note that CustomerNote and ReturnRequestedUtc show 24,290. In these columns empty values were read as empty strings, not nulls; you cannot see missing data in string columns from this number.
Two things stand out in the Description table right away. The maximum of OrderTotal is 46,980 TRY, suspicious for a bookstore order. The minimum of DeliveryDays is -4.35 days; a delivery cannot take negative time. The third one is sneakier. Description gives the mean of DeliveryDays as 2.4667, while the mean of the non-null values computed with LINQ is 2.5817. 2.4667 equals 2.5817 multiplied by 23,208/24,290. In other words, in this version Description() counts the null values in the denominator when it calculates the mean. Never put a statistic from a tool into a report without verifying it another way at least once.
A Quality Report with LINQ
DataFrame gives the big picture; asking the real questions is easier with LINQ. We read the file into the OrderRow record from the first post and run five groups of checks:
string[] lines = File.ReadAllLines("data/orders.csv")[1..];
List<OrderRow> rows = [.. lines.Select(l => OrderRow.Parse(Csv.Split(l)))];
// 1) Duplicates: the same OrderId twice, and whether the whole line is identical
var duplicateIds = rows.GroupBy(r => r.OrderId).Where(g => g.Count() > 1).ToList();
int identical = lines.GroupBy(l => l).Sum(g => g.Count() - 1);
Console.WriteLine($"Duplicate OrderIds   : {duplicateIds.Count} (identical lines: {identical})");
// 2) Missing values
Console.WriteLine($"Missing weight       : {rows.Count(r => r.TotalWeightKg is null)}");
Console.WriteLine($"Missing label        : {rows.Count(r => r.DeliveryDays is null)} " +
                  $"(cancelled: {rows.Count(r => r.IsCancelled)})");
// 3) Inconsistent categories
var cities = rows.GroupBy(r => r.City).Select(g => (Name: g.Key, Count: g.Count())).ToList();
var odd = cities.Where(c => c.Name != c.Name.Trim() || c.Name == c.Name.ToUpperInvariant()
                            || c.Name == c.Name.ToLowerInvariant());
Console.WriteLine($"Distinct City values : {cities.Count}; odd spellings: " +
                  string.Join(", ", odd.OrderByDescending(c => c.Count).Take(6).Select(c => $"'{c.Name}' x{c.Count}")));
// 4) Impossible or extreme values
List<double> days = [.. rows.Where(r => r.DeliveryDays is not null).Select(r => r.DeliveryDays!.Value).Order()];
double q1 = Quantile(days, 0.25), q3 = Quantile(days, 0.75), iqr = q3 - q1;
Console.WriteLine($"DeliveryDays <= 0    : {days.Count(d => d <= 0)}");
Console.WriteLine($"DeliveryDays p50/p90/p99/max : {Quantile(days, 0.5):F2} / {Quantile(days, 0.9):F2} / " +
                  $"{Quantile(days, 0.99):F2} / {days[^1]:F2}");
Console.WriteLine($"IQR outliers (> {q3 + 1.5 * iqr:F2}) : {days.Count(d => d > q3 + 1.5 * iqr)}; " +
                  $"> 15 days: {days.Count(d => d > 15)}");
dotnet run --project src/Bookstore.ML.Lab -- qualityDuplicate OrderIds : 104 (identical lines: 104)
Missing weight : 761
Missing label : 1082 (cancelled: 1082)
Distinct City values : 62; odd spellings: 'Istanbul ' x30, 'istanbul' x29, 'ISTANBUL' x20, 'Izmir ' x16, 'ankara' x15, 'Ankara ' x15
DeliveryDays <= 0 : 6
DeliveryDays p50/p90/p99/max : 2.20 / 4.11 / 8.69 / 38.17
IQR outliers (> 5.71) : 710; > 15 days: 93
OrderTotal > 10x items subtotal : 4 (e.g. O003526: 19,980.00 vs 149.90)
IsCancelled = true : 4.5 %
IsReturned = true : 3.5 % of delivered
Review topics : Content 1796, Shipping 1395, Price 1060, PrintQuality 819
R00254 [PrintQuality] Delivered on time even during the campaign.
R01837 [PrintQuality] Shipping was really slow this time. Second copy I bought.
R03828 [PrintQuality] Shipping was really slow this time.Let's read the results one by one. 104 orders were written twice, and all of them are identical lines: the typical result of an export that was retried. Duplicate rows tell the model that those orders are twice as important. Worse, when we split the data into train and test in the next post, one copy of an order can land in train and the other in test, and the model answers the exam from memory.
The weight is empty in 761 rows. All 1,082 rows with an empty label are cancelled orders; this gap is not an error, a cancelled order is never delivered. The delivery-time model will not use these rows, but a cancellation model needs exactly these rows. Which row counts as "missing" depends on the problem itself.
There are 16 cities, but the City column shows 62 distinct values: "Istanbul " with a trailing space, "istanbul" in lower case, "ISTANBUL" in upper case. To the model these are four different cities. One-hot encoding opens a separate column for each, and the 20 orders from "ISTANBUL" are learned separately from the rest of Istanbul.
The totals of four orders are more than ten times the sum of the book prices on their order lines. In the example, O003526, the books cost 149.90 TRY but the order total is 19,980 TRY; the total was clearly written in kuruş. We found this by comparing two tables, not by looking at one column. The most valuable data quality checks are usually comparisons like this, based on business rules.
Finally the class distribution: 4.5 percent of orders were cancelled and 3.5 percent of delivered orders were returned. On imbalanced data like this, a model that says "no order is ever cancelled" gets 95.5 percent accuracy and is completely useless. We will open this trap with classification metrics in the seventh post.
When the Label Itself Is Wrong
Six orders have a negative delivery time. That is not an outlier, it is an impossible value. Label errors usually come from the system: a time zone mix-up, a sign error, a date read from the wrong column. If we cannot fix these rows, removing them is the right call.
A label error is not always this visible. In the reviews file each review has a topic (Topic); imagine that someone in customer service picked it by hand. The last part of the quality report looks for reviews whose text is clearly about shipping but which were labeled as "print quality":
// 6) Labels can be wrong too: reviews about delivery that were tagged as something else
List<string[]> reviews = [.. Csv.Read("data/reviews.csv")];
Console.WriteLine("Review topics        : " + string.Join(", ", reviews.GroupBy(r => r[5])
    .OrderByDescending(g => g.Count()).Select(g => $"{g.Key} {g.Count()}")));
string[] shippingWords = ["The package", "The courier", "Shipping was", "Fast delivery", "Delivered on time"];
foreach (string[] r in reviews.Where(r => r[5] == "PrintQuality" && shippingWords.Any(r[4].StartsWith)).DistinctBy(r => r[4]).Take(3))
{
    Console.WriteLine($"  {r[0]} [{r[5]}] {r[4]}");
}
The last three lines of the output are the result of this search. "Shipping was really slow this time." is not a print quality complaint. In the seventh post we will train a model that predicts the topic from these reviews, and it will learn from these wrong labels too. Bringing label noise down to zero is often impossible; but knowing how much there is means accepting that the success the model can reach has a ceiling.
Distribution and Outliers
The percentiles in the quality report are easier to see in a histogram. The chart below is drawn from the half-day bins written by the report:
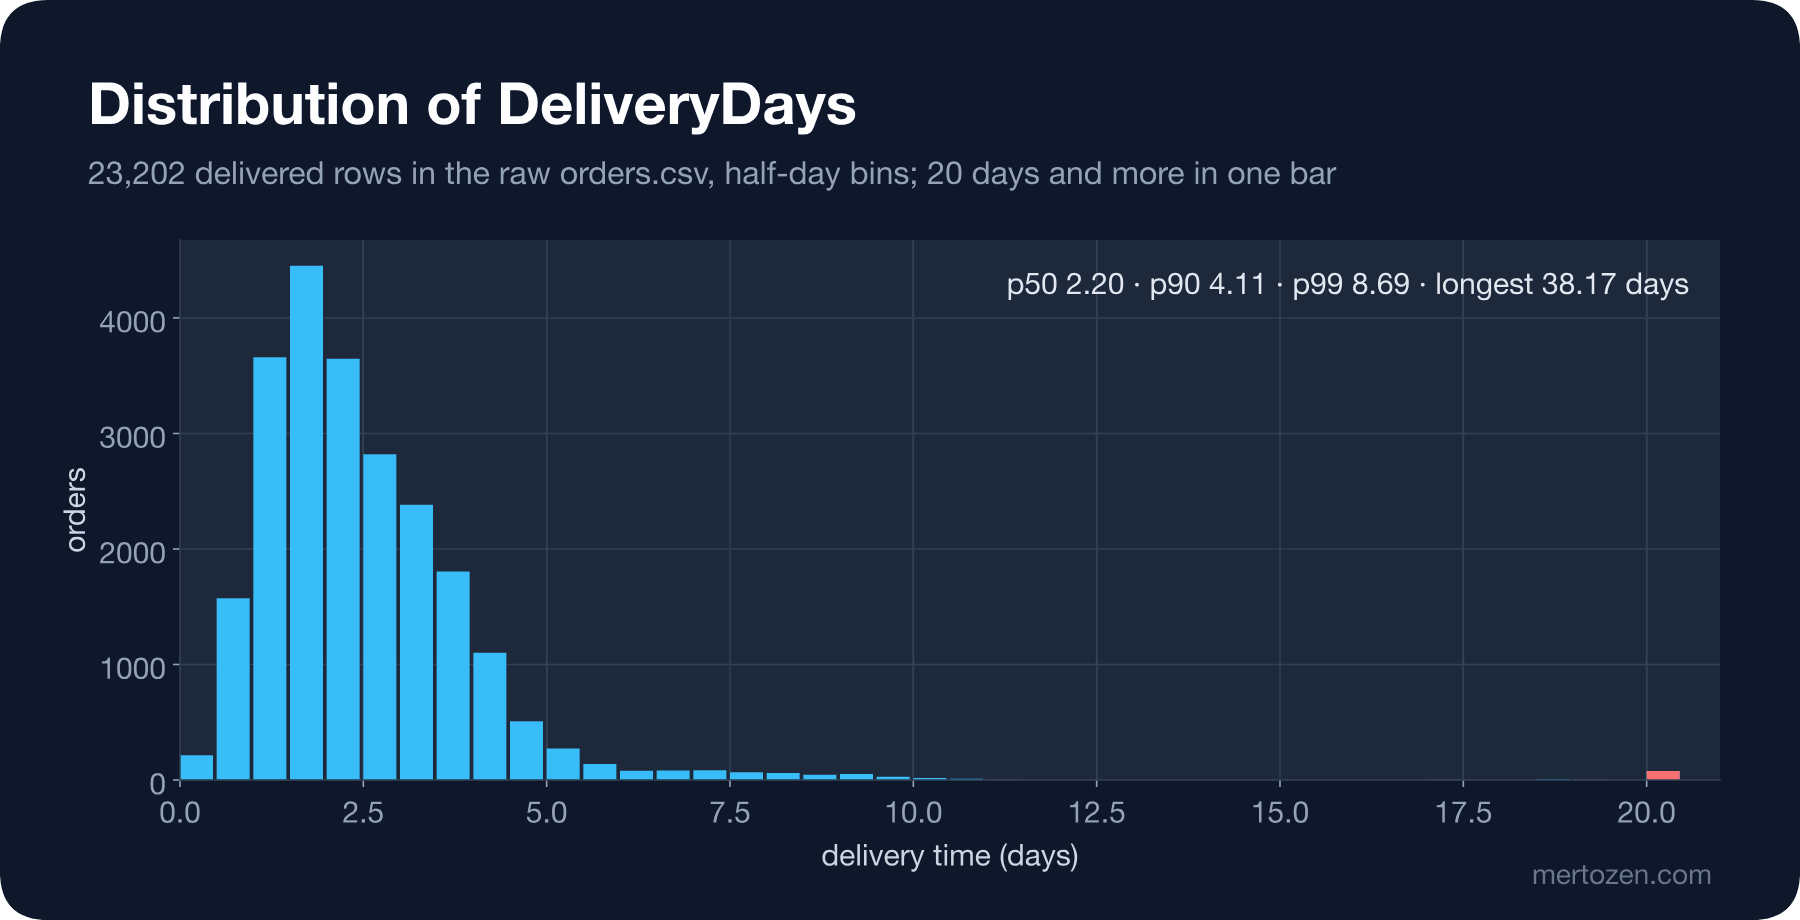
Half of the orders were delivered in less than 2.2 days and 90 percent in less than 4.1 days. There is a long tail to the right, and dozens of orders pile up in the bar for 20 days and more. The longest delivery took 38 days.
The textbook IQR rule marks 710 deliveries longer than 5.71 days as outliers. Deleting them automatically would be a big mistake. Most deliveries between 5 and 10 days are real orders that waited for an out-of-stock book to arrive from the supplier. The model should learn this case, because that is exactly the estimate the customer needs to hear. The 93 deliveries longer than 15 days are a different story: most likely parcels that got lost and were found weeks later. They are real too, but no feature announces them in advance. We leave them in the data for now; in the sixth post we will measure how these rows affect each metric. Before deleting an outlier, ask: is this value wrong, or just rare?
Cleaning
The clean command fixes what we found and writes a new file, data/orders_clean.csv, without touching the raw file:
// 1) The export wrote some orders twice: keep one line per OrderId
rows = [.. rows.DistinctBy(r => r.OrderId)];
int afterDedup = rows.Count;
// 2) One spelling per city: the most common form of the trimmed, case-insensitive name
Dictionary<string, string> canonical = rows
    .GroupBy(r => r.City.Trim().ToUpperInvariant())
    .ToDictionary(g => g.Key, g => g.GroupBy(r => r.City).OrderByDescending(x => x.Count()).First().Key);
int cityFixes = rows.Count(r => r.City != canonical[r.City.Trim().ToUpperInvariant()]);
rows = [.. rows.Select(r => r with { City = canonical[r.City.Trim().ToUpperInvariant()] })];
// 3) Totals stored in kuruş: compare with the order lines and divide by 100
Dictionary<string, decimal> itemTotals = Csv.Read("data/order_items.csv")
    .GroupBy(f => f[0])
    .ToDictionary(g => g.Key, g => g.Sum(f => int.Parse(f[2], CultureInfo.InvariantCulture)
                                              * decimal.Parse(f[3], CultureInfo.InvariantCulture)));
int totalFixes = rows.Count(r => r.OrderTotal > 10 * itemTotals[r.OrderId]);
rows = [.. rows.Select(r => r.OrderTotal > 10 * itemTotals[r.OrderId] ? r with { OrderTotal = r.OrderTotal / 100 } : r)];
// 4) A delivery cannot take negative time: the label is wrong, drop the row
int badLabels = rows.Count(r => r.DeliveryDays <= 0);
rows = [.. rows.Where(r => r.DeliveryDays is null || r.DeliveryDays > 0)];
dotnet run --project src/Bookstore.ML.Lab -- cleanrows 24,290 -> 24,186 after de-duplication -> 24,180 written
city spellings fixed: 290, distinct cities: 16
totals divided by 100: 4, rows dropped for a negative label: 6
missing weight kept as empty: 756Each of these steps is a decision. We removed the duplicates because the lines were identical; if the same OrderId appeared twice with different content, we would have to ask which one is right. We moved city spellings to their most common form; 290 rows were fixed and 16 cities remain. We fixed the kuruş error based on the order lines. We removed the six rows with a negative label because we cannot know the correct value. Missing weights, on the other hand, stay empty. Making up a number, for example filling in the mean, is the model's job; we need to do it inside the pipeline, with a value learned from the training data only. We will see why in the third and fifth posts.
Note that we never changed the raw file. Cleaning is code: it can be run again, it can be reviewed, and when a new export arrives tomorrow the same decisions are applied the same way. A fix made by hand in Excel offers none of this.
Personal Data and the Law
customers.csv contains the customer's name, email address (all on the made-up example.com domain), year of birth and address. We need none of them to predict delivery time: the order row knows the customer only by CustomerId, and the city and district are already on the order row. So we do not carry a single column from the customer file into the training data.
From the point of view of KVKK, Turkey's personal data protection law, and GDPR, the rule is simple: personal data that the purpose does not require does not go into the training set. A name and an email teach a model nothing, but they travel to every place the training data goes: the developer's laptop, the CI machine, a shared folder. Columns such as year of birth raise a harder question: they have nothing to do with delivery time, but in a problem such as cancellation prediction the model may start to discriminate by age. We will discuss sensitive features and the features that stand in for them indirectly in the ninth post. The legal and technical details are in the Data Privacy and KVKK series.
Common Pitfalls
The first pitfall is forgetting "garbage in, garbage out": a model trained on bad data learns the errors and repeats them with high confidence. Even if the model's metrics look good, that picture is misleading when the test data carries the same errors.
The second is deleting outliers by rule. The IQR rule flagged 710 rows; most of them are real delays the model has to learn. Understand the cause of each outlier group before deleting anything.
The third is accepting the label as true. Negative delivery times and mislabeled reviews were left in this data on purpose, but they appear just as often in real systems. Do not trust a model before you learn how the label is produced: by hand or by a system, and in which time zone.
The fourth is reporting a tool's statistic without verifying it. DataFrame's mean gave a wrong number in this post; two tools that interpret nulls differently can produce different results on the same data.
The fifth is cleaning by hand. You will not remember the same steps at the next export. Cleaning should be code and should not change the raw data.
A Small Experiment
★☆☆ Add a check for the District column to the quality report: how many distinct districts are there, and how many orders do the ten smallest districts have? The number will help you choose between one-hot encoding and hashing in the fifth post.
★★☆ Make the duplicate check stricter: write a query that finds rows with the same OrderId but different content. In this data the result should be zero; if it were not zero in a real export, how would you decide which one to keep?
★★★ Compare orders with an empty weight to orders with a weight: is their distribution by carrier, warehouse and month different? If the missing values are not random (for example, if they always come from the same warehouse), filling them with the mean can teach the model something wrong.
In the next post we split the data into train and test and use real measurements to see why a model can look great in testing and disappoint in production: baselines, overfitting, data leakage, time-based splits and cross-validation.