

Resource Requests and Limits: QoS, OOMKilled, CPU Throttling and the .NET GC in Containers
A request tells the scheduler how much room to reserve and a limit tells the kernel a ceiling that can't be crossed; exceeding memory means OOMKilled, hitting the CPU limit means throttling. With real output we see a 500m limit drop .NET's ProcessorCount to 1 and turn Server GC off, the heap limit at 75 percent of the limit, managed OutOfMemoryException versus native OOMKilled, the GCHeapHardLimitPercent hex trap, throttling and quotas.
Version note: The examples in this post were run with kind 0.33 on Kubernetes 1.37 (cgroup v2), kubectl 1.37 and .NET 10 (runtime 10.0.14).
Guess First
You give the Bookstore API (Application Programming Interface) pod limits.memory: 256Mi and limits.cpu: 500m. The pod runs on a 10-core node. What does Environment.ProcessorCount return, and does Server GC (Garbage Collector), ASP.NET Core's default, stay on? If the application keeps a list in managed memory that grows forever, what happens: does the pod die with OOMKilled, or something else? Last question: to set the GC heap limit to 50 percent you write DOTNET_GCHeapHardLimitPercent=50. What percentage do you actually get?
Requests and Limits: Two Different Contracts
      resources:
        requests:
          cpu: 250m
          memory: 128Mi
        limits:
          cpu: 500m
          memory: 256Mi
These four lines say two separate things. A request is a contract with the scheduler: "reserve at least this much room for this pod". The scheduler only places a pod on nodes where the sum of requests fits the node's allocatable capacity; it doesn't look at actual usage on the node. A limit is a contract with the kernel: it's written into the container's cgroup and can't be exceeded. 250m means a quarter core, Mi means mebibyte.
The two resources react to limits differently. CPU (Central Processing Unit) is compressible: a container hitting its limit isn't killed, it's slowed down (throttled). Memory isn't compressible: a process exceeding the limit is killed by the kernel's OOM (Out Of Memory) killer. We'll see this difference in two separate experiments in the middle of the post.
QoS Classes: Who Goes First?
Kubernetes looks at requests and limits and assigns every pod a QoS (Quality of Service) class. I created four pods: one with no resources at all, one with requests below limits, one with requests equal to limits, and a last one for the hex trap we'll get to shortly.
res-besteffort qos=BestEffort {"processorCount":10,"isServerGC":true,"totalAvailableMemoryMB":7836,"heapSizeMB":0,"gcHeapHardLimitMB":0,"workingSetMB":68}
res-burstable qos=Burstable {"processorCount":1,"isServerGC":false,"totalAvailableMemoryMB":192,"heapSizeMB":0,"gcHeapHardLimitMB":0,"workingSetMB":66}
res-guaranteed qos=Guaranteed {"processorCount":1,"isServerGC":false,"totalAvailableMemoryMB":192,"heapSizeMB":0,"gcHeapHardLimitMB":0,"workingSetMB":67}
res-hexpercent qos=Burstable {"processorCount":1,"isServerGC":false,"totalAvailableMemoryMB":204,"heapSizeMB":0,"gcHeapHardLimitMB":0,"workingSetMB":66}
Each line has the pod's QoS class and the response of the API's /api/diag/runtime endpoint. The rules are simple: if no container has requests or limits, BestEffort; if every container has requests equal to limits for both CPU and memory, Guaranteed; anything in between, Burstable. The class's practical meaning shows up when a node runs short of memory. During kubelet eviction and when the kernel OOM killer picks a victim, BestEffort pods go first, then Burstable pods using more memory than they requested; Guaranteed pods go last. I lived through this unintentionally in post 7: on the heavily loaded local cluster, API pods without requests restarted with OOMKilled even though they had no limits of their own.
How Does .NET See the Container?
The really interesting part of the output above is the .NET runtime's numbers. The pod without resources sees all 10 of the node's cores and 7836 MB of memory as its own and runs Server GC. With limits the picture changes completely:
processorCount is 1. .NET reads the CPU quota from the cgroup and sets Environment.ProcessorCount accordingly; 500m rounded up is 1 core. Thread pool size, the number of Server GC heaps and parallel work are shaped by this number. As a check, I started a pod with a 1500m limit: processorCount 2 and Server GC on. If needed, you can set this number by hand with the DOTNET_PROCESSOR_COUNT environment variable.
isServerGC is false. ASP.NET Core projects use Server GC by default, but in a single-processor environment the runtime falls back from Server GC to Workstation GC. An API pod with a 500m limit runs with a different GC even though you changed nothing in the Dockerfile or the csproj; run your benchmarks with real limits, not on your laptop.
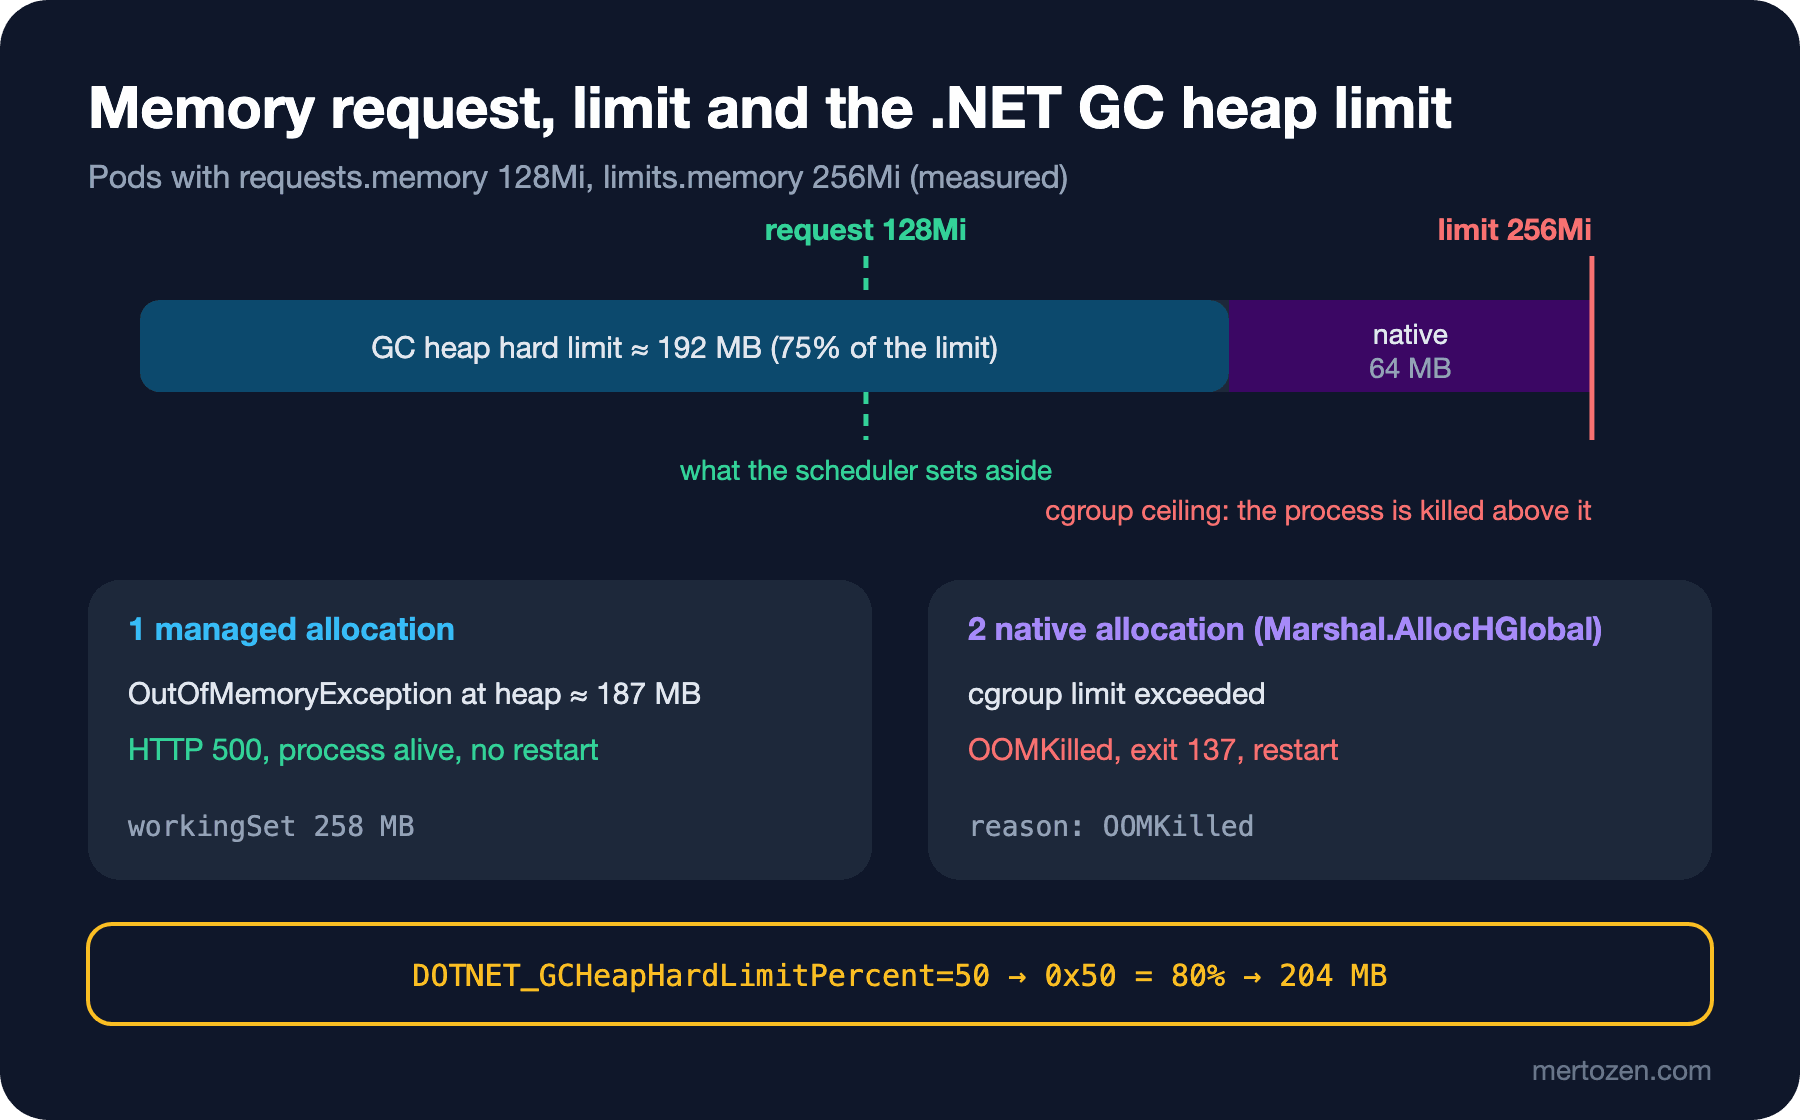
totalAvailableMemoryMB is 192. According to Microsoft's GC documentation, in an environment with a memory limit such as a container, that limit counts as "physical memory", and unless there's a separate heap hard limit setting, the default is the larger of 75 percent of the limit and 20 MB. 75 percent of 256Mi is 192 MB. The remaining 64 MB is for native memory, thread stacks, the JIT (Just-In-Time) compiler and the runtime itself. (gcHeapHardLimitMB is zero in the output because that value is only populated when the limit is set explicitly; GC.GetGCMemoryInfo().TotalAvailableMemoryBytes shows the effective limit.)
DATAS (Dynamic Adaptation To Application Sizes), enabled by default for Server GC since .NET 9, is also a container-friendly change: instead of creating heaps for every core up front, Server GC now starts with a single heap and scales with load, so the idle memory footprint of Server GC pods on the same node drops. To turn it off, DOTNET_GCDynamicAdaptationMode=0.
Two Ways to Hit the Limit: OutOfMemoryException and OOMKilled
The second question. In the res-burstable pod I called the endpoint that allocates and holds managed memory:
$ kubectl exec client -- wget -S -qO- --post-data= "http://$ip:8080/api/diag/alloc-managed?mb=100"
  HTTP/1.1 200 OK
{"heldMB":100}
$ kubectl exec client -- wget -S -qO- --post-data= "http://$ip:8080/api/diag/alloc-managed?mb=150"
  HTTP/1.1 500 Internal Server Error
$ kubectl logs res-burstable | grep -i outofmemory
04:48:55.429 fail: Microsoft.AspNetCore.Server.Kestrel[13] Connection id "0HNPTAE88S79C", Request id "0HNPTAE88S79C:00000001": An unhandled exception was thrown by the application. System.OutOfMemoryException: Exception of type 'System.OutOfMemoryException' was thrown.
$ kubectl exec client -- wget -qO- http://$ip:8080/api/diag/runtime
{"processorCount":1,"isServerGC":false,"totalAvailableMemoryMB":192,"heapSizeMB":187,"gcHeapHardLimitMB":0,"workingSetMB":258}
$ kubectl get pod res-burstable
NAME            READY   STATUS    RESTARTS
res-burstable   1/1     Running   0
The pod didn't die. When the GC heap reached 187 MB, up against the 192 MB hard limit, the GC threw OutOfMemoryException instead of asking for more memory; the request returned 500, the process stayed up, no restart. That's exactly what the heap hard limit is for: keeping .NET's own heap below the cgroup limit and handing the application a controlled error before the OOM killer catches it. But note: the working set is 258 MB, very close to the limit; the process can now be killed at any moment and the memory it holds will never be freed. Liveness doesn't see this, because /health/live still returns 200.
Next, in the res-guaranteed pod with the same limit, I allocated native memory the GC doesn't see (Marshal.AllocHGlobal, 300 MB):
$ kubectl exec client -- wget -T 10 -qO- --post-data= "http://$ip:8080/api/diag/alloc-native?mb=300"
wget: error getting response
$ kubectl get pod res-guaranteed
NAME             READY   STATUS    RESTARTS
res-guaranteed   1/1     Running   1 (5s ago)
$ kubectl describe pod res-guaranteed
    Last State:     Terminated
      Reason:       OOMKilled
      Exit Code:    137
This time the process exceeded the cgroup limit and the kernel killed it with SIGKILL (the kill signal): exit code 137 (128 + 9), reason OOMKilled. No .NET exception, no log line; the process vanished and the kubelet restarted it. In real life native memory grows through large buffers, unmanaged libraries (image processing, compression), threads and memory-mapped files. When you see OOMKilled, the first question is "heap or native?": a growing heap would have produced an OutOfMemoryException; a sudden death usually points to the native side, or to a limit too tight relative to the heap limit.
The Hex Trap in GCHeapHardLimitPercent
The only difference in the fourth pod was the DOTNET_GCHeapHardLimitPercent=50 environment variable, and totalAvailableMemoryMB came out as 204 instead of 192. 204 is 80 percent of 256. Why: the GC documentation says numeric GC settings are written in decimal in runtimeconfig.json but in hexadecimal in environment variables, with or without the 0x prefix. The 50 in the environment variable was read as 0x50, i.e. 80. The correct value for 50 percent is 0x32 (or 32). A more readable route is to set these values in decimal through RuntimeHostConfigurationOption in the csproj or in runtimeconfig.template.json instead of environment variables. The same trap applies to DOTNET_GCHeapHardLimit, DOTNET_GCHeapCount and other numeric GC settings; it makes no difference for 0/1 values like DOTNET_gcServer=1.
CPU Limits and Throttling
On the CPU side there's no killing, only slowing down. The API has an endpoint that burns CPU on a single thread for 5 seconds; I sent the same request to a pod without limits and to a pod with limits.cpu: 200m:
res-besteffort {"seconds":5,"elapsedMs":5000,"iterations":205092352}
res-cpu200 {"seconds":5,"elapsedMs":5000,"iterations":39369482}
$ kubectl debug res-cpu200 --image=busybox:1.37 --target=api --profile=general -q -- cat /proc/1/root/sys/fs/cgroup/cpu.stat /proc/1/root/sys/fs/cgroup/cpu.max
usage_usec 1192108
nr_periods 65
nr_throttled 34
throttled_usec 956734
20000 100000
Both requests took 5 seconds, but the limited pod did a fifth of the work in the same time (39 million iterations versus 205 million). The cpu.max line is the limit's kernel counterpart: at most 20,000 microseconds of CPU in every 100,000-microsecond (100 ms) period. When the quota runs out, the process is held until the end of the period; nr_throttled and throttled_usec are the count and total of those waits. For a web API this means: a request that exhausts the CPU waits out the remaining 80 ms. In a multi-threaded .NET application the quota runs out even faster, because 200m is a budget five threads can spend in 4 ms together. The result is a rising p99 (99th percentile) latency while average CPU usage stays low.
There are two schools of thought on CPU limits. The first is to set no CPU limit at all and only give requests: requests already split CPU proportionally under contention, and the pod is free to use idle CPU; the cost is that a pod's behaviour depends on its neighbours on the node, meaning less predictable performance. The second is keeping the limit a little above the request: predictable, but with throttling risk. For latency-sensitive services like the Bookstore API, the general trend is to set a memory limit and either no CPU limit or a generous one. Whichever you choose, watch nr_throttled.
LimitRange and ResourceQuota
Instead of trusting every team to write correct resources on every pod, you can set defaults and boundaries at the namespace level:
apiVersion: v1
kind: LimitRange
metadata:
  name: defaults
  namespace: bookstore-dev
spec:
  limits:
    - type: Container
      defaultRequest:
        cpu: 100m
        memory: 128Mi
      default:
        memory: 256Mi
---
apiVersion: v1
kind: ResourceQuota
metadata:
  name: team-quota
  namespace: bookstore-dev
spec:
  hard:
    requests.cpu: "1"
    requests.memory: 1Gi
    limits.memory: 2Gi
    pods: "10"
$ kubectl create deployment api --image=bookstore-api:1.0.0 --replicas=2 -n bookstore-dev
$ kubectl get pod -n bookstore-dev -o jsonpath='{.items[0].spec.containers[0].resources}'
{"limits":{"memory":"256Mi"},"requests":{"cpu":"100m","memory":"128Mi"}}
$ kubectl scale deploy/api -n bookstore-dev --replicas=12
$ kubectl get deploy api -n bookstore-dev
NAME READY UP-TO-DATE AVAILABLE AGE
api 8/12 8 8 11s
$ kubectl describe resourcequota team-quota -n bookstore-dev
Resource Used Hard
-------- ---- ----
limits.memory 2Gi 2Gi
pods 8 10
requests.cpu 800m 1
requests.memory 1Gi 1GiPods created without resources got the LimitRange defaults. Memory filled the quota first: 8 pods × 256Mi = 2Gi. The remaining four pods couldn't be created, and the ReplicaSet's events showed an exceeded quota: team-quota error. Note: a Deployment that hits a quota doesn't "fail", it just stays at 8/12; the way to notice is to look at events and the rollout status.
Production Notes
Set values by measurement, not guesswork. Run the application under realistic load and watch GC heap size, working set, GC pause times and the thread pool with dotnet-counters (details in the upcoming Profiling series); set the memory request at the typical working set and the limit comfortably above the peak. Remember the heap hard limit is 75 percent of the limit: if the heap needs 300 MB, the limit must be at least 400 MB.
Don't leave pods without requests. BestEffort pods are the first to go when a node runs short of memory, and the scheduler does no capacity accounting when placing them. The HPA (Horizontal Pod Autoscaler) we'll see in post 11 calculates percentages against requests, so it can't work with pods that have none.
Remember that .NET's behaviour changes when you set a CPU limit: ProcessorCount, GC flavour and the thread pool. Limits below one core turn Server GC off; that should be a conscious choice.
Common Pitfalls
Taking OOMKilled for a "memory leak". Sometimes it is; but often the limit is simply smaller than what the heap plus native usage really needs. Start by separating heap from native.
Writing hex values in decimal. DOTNET_GCHeapHardLimitPercent=50 means 80 percent; we measured it above.
Setting requests too close to or too far from limits. If requests are too low, the scheduler overpacks nodes and everyone gets squeezed at once when real usage approaches the limits; if they're too high, the cluster is full of idle capacity yet new pods don't fit.
Confusing millicores with cores. cpu: 1 is one core, cpu: 1m is a thousandth of a core. Likewise memory: 128M (megabytes) and 128Mi (mebibytes) are different numbers.
A Small Experiment
★☆☆ Start a pod with limits.memory: 512Mi and verify that totalAvailableMemoryMB in /api/diag/runtime is 384. Then try again with DOTNET_GCHeapHardLimitPercent=0x32.
★★☆ Give the same pod first limits.cpu: 900m, then 1100m; put the processorCount and isServerGC values in a table. What happens when you add DOTNET_PROCESSOR_COUNT=4?
★★★ Call /api/diag/burn?seconds=10 with 4 concurrent requests: first with limits.cpu: 1, then with no CPU limit but requests.cpu: 1. Compare nr_throttled in cpu.stat and the request durations in both cases, and write down your CPU limit decision for your own API with its reasoning.
Our pods now run at the right size and with the right signals. One last delicate moment remains: the pod's death. In the next post we measure what really happens when a pod is deleted, the race between removal from endpoints and SIGTERM (the termination signal), the preStop sleep action and .NET's HostOptions.ShutdownTimeout, under real load.