

Debugging in Kubernetes: CrashLoopBackOff, ImagePullBackOff, Pending and kubectl debug
Pod failures always follow the same order: read the symptom with get, the events with describe, the app's voice with logs --previous, and if needed bring an ephemeral container into a shell-less pod with kubectl debug. With real output we cover Pending, ImagePullBackOff, CrashLoopBackOff, OOMKilled and a port mismatch, a .NET process hanging as PID 1, and dotnet-dump killing a pod that runs near its limit.
Version note: The examples in this post were run with kind 0.33 and Kubernetes 1.37, kubectl 1.37, .NET 10 and dotnet-counters/dotnet-dump 10.0.750501.
Guess First
In production, one pod of the Bookstore API (Application Programming Interface) looks like it's leaking memory: working set 160 MB, memory limit 256Mi. To see what's taking up space, you add a debug container to the pod and take a full dump with dotnet-dump collect. What happens to the pod? Do you get the dump and finish the diagnosis, or do you kill the very pod you're trying to diagnose? We answer that with real output at the end of this post; until then we diagnose, one by one, pods that never start, pods that keep crashing, and pods that run but take no traffic.
The Triage Flow: get, describe, logs, debug
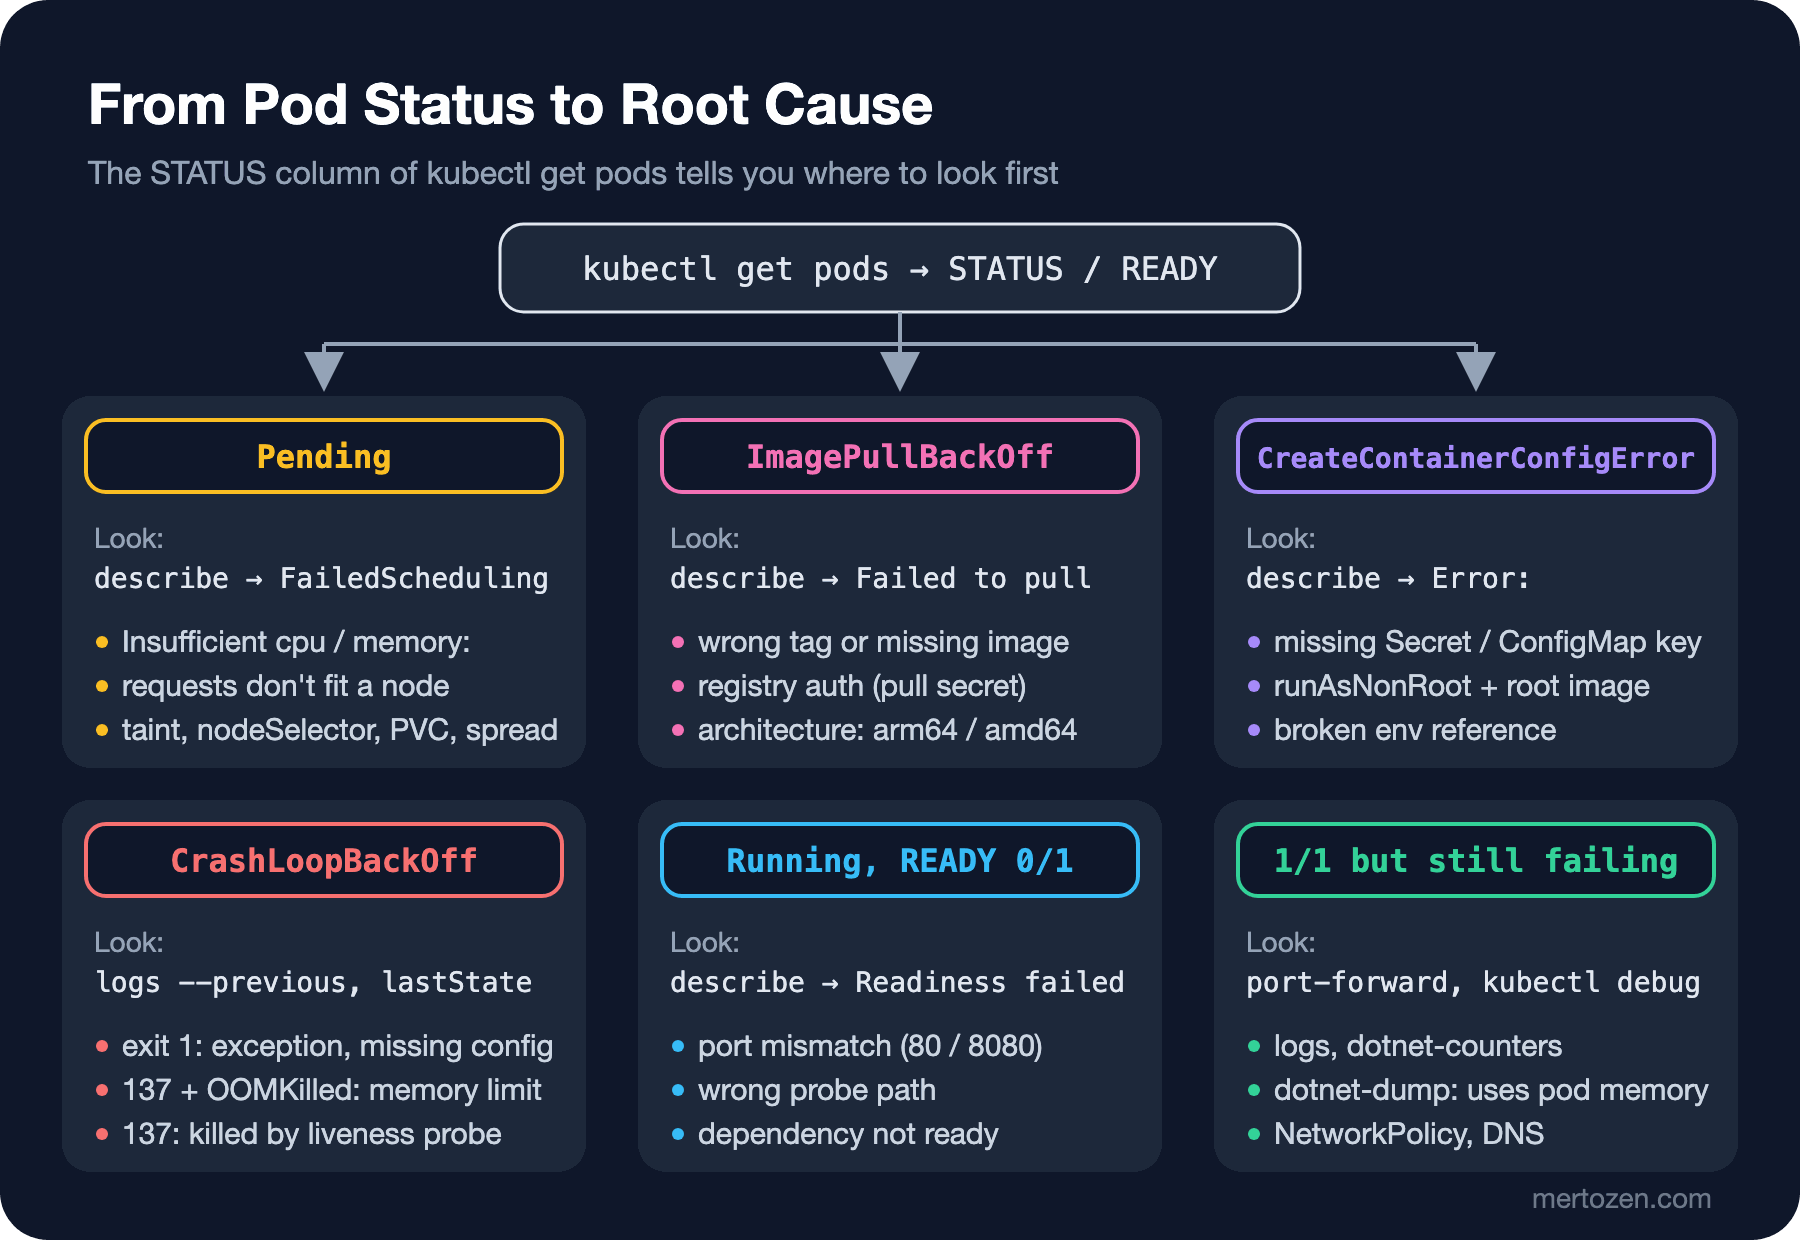
The order of debugging in Kubernetes barely changes. kubectl get pods gives the symptom: the STATUS and READY columns. kubectl describe pod, with its Events section at the bottom, shows what the scheduler, the kubelet and the probes said. kubectl logs (with --previous for a crashed container) is the app's own voice. If those aren't enough, you send requests straight to the pod with kubectl port-forward and bring a toolbox into the pod with kubectl debug. The STATUS column tells you which step to spend time on:
For this post we deliberately put five broken Deployments into a namespace. A minute later:
NAME                           READY   STATUS             RESTARTS      AGE
api-crash-7b5c79dd4b-8xb5v     0/1     CrashLoopBackOff   3 (18s ago)   60s
api-oom-5676979fb9-crg8v       1/1     Running            0             60s
api-pending-6b7fc577b8-zrkv8   0/1     Pending            0             60s
api-port-775dbc57cc-9ftrg      0/1     Running            3 (15s ago)   60s
api-typo-d6575f7d7-bcd2h       0/1     ImagePullBackOff   0             60s
Two of them are sneaky. api-oom looks healthy right now; its problem will show up under load. api-port is Running but 0/1, and its restart count is climbing: the STATUS column alone is misleading and must be read together with READY and RESTARTS.
When the Pod Never Starts: Pending and ImagePullBackOff
Pending means the pod couldn't be placed on a node yet. The reason is always written in the scheduler's event:
Warning FailedScheduling 68s default-scheduler 0/3 nodes are available: 1 node(s) had untolerated taint(s), 2 Insufficient cpu. preemption: 0/3 nodes are available: 3 Preemption is not helpful for scheduling.Read the message node by node: one of the three nodes is tainted (the control plane), two don't have enough CPU (Central Processing Unit). Our pod asked for 16 cores. What matters: the scheduler looks at requests, not usage. Even if the nodes are idle, a new pod won't fit if the sum of requests exceeds allocatable; that's why the ninth post of the series chose requests by measuring. Other typical Pending messages: a PVC (PersistentVolumeClaim) that can't be bound, a mismatching nodeSelector/affinity, and the topology spread constraint we saw in the eleventh post. With a cluster autoscaler, a Pending pod triggers a new node; in that case waiting a few minutes is normal.
ImagePullBackOff means the kubelet couldn't pull the image and is retrying at growing intervals:
Normal   Pulling    24s (x3 over 68s)  kubelet  spec.containers{api}: Pulling image "bookstore-api:1.2.1"
Warning  Failed     23s (x3 over 67s)  kubelet  spec.containers{api}: Failed to pull image "bookstore-api:1.2.1": failed to pull and unpack image "docker.io/library/bookstore-api:1.2.1": failed to resolve reference "docker.io/library/bookstore-api:1.2.1": pull access denied, repository does not exist or may require authorization: server message: insufficient_scope: authorization failed
Warning  Failed     23s (x3 over 67s)  kubelet  spec.containers{api}: Error: ErrImagePull
Warning  Failed     8s (x3 over 66s)   kubelet  spec.containers{api}: Error: ImagePullBackOff
There's a typo in the tag (1.2.1 instead of 1.2.0), but the message says "authorization failed": registries often brush off a repository that doesn't exist and one you're not allowed to see with the same answer. Also notice that an image without a registry name is looked up on Docker Hub with the docker.io/library/ prefix. The order of checks: does the image name and tag really exist, is the registry address right, are imagePullSecrets or the node's registry access in place, was the image built for the node's architecture (arm64/amd64). An architecture mismatch shows up either at pull time as no manifest matching the platform, or at container start as exec format error.
CrashLoopBackOff and OOMKilled: The Container Starts, Then Dies
CrashLoopBackOff isn't an error but the kubelet's waiting state: the container exited, and the kubelet restarts it at intervals that start at 10 seconds and double up to five minutes. The log of the crashed container isn't the log of the new one; --previous is a must:
$ kubectl -n bookstore-dbg logs deploy/api-crash --previous
04:35:40.712 info: Bookstore.Api[0] Bookstore.Api 1.2.0 starting on api-crash-7b5c79dd4b-8xb5v: cpus=10 serverGC=True gcHeapLimitMB=192
04:35:40.714 crit: Bookstore.Api[0] Startup:FailFast is true, exiting with code 1
If the log is empty or not enough, look at the container's last state; the exit code and reason are often enough of a clue:
{"terminated":{"containerID":"containerd://5603bb4c...","exitCode":1,"finishedAt":"2026-11-08T04:35:40Z","reason":"Error","startedAt":"2026-11-08T04:35:40Z"}}Reading the exit code correctly gets you halfway. 1 is the app exiting by its own decision: like our FailFast check, or Main returning 1. An unhandled exception, however, aborts the process in .NET. We tried it with a console app whose only line is throw new InvalidOperationException(...): with docker run --init, that is with the .NET process not being PID (Process ID) 1, we got exit code 134 (128 + SIGABRT (the abort signal)). Running the same image as a pod on kind painted a very different picture:
$ kubectl -n bookstore-dbg logs throwtest
Unhandled exception. System.InvalidOperationException: ConnectionStrings:Default is missing
$ kubectl -n bookstore-dbg get pod throwtest
NAME        READY   STATUS    RESTARTS   AGE
throwtest   1/1     Running   0          25s
$ kubectl -n bookstore-dbg top pod throwtest
NAME        CPU(cores)   MEMORY(bytes)
throwtest   1000m        23Mi
The process didn't exit; it hung, burning a full core, and the pod showed as Running. In a container the .NET process is PID 1, and the kernel doesn't deliver signals with default disposition to PID 1; the SIGABRT sent by abort had no effect. We saw this on arm64 nodes (kind on Apple Silicon); on x64 nodes abort's last resort is different, so the outcome may change; try it on your own architecture. The lesson is architecture-independent: a try/catch in Program.cs that logs startup failures and returns 1 gives a deterministic exit everywhere, and in a web app a liveness probe kills a hung process within a few periods at most. A missing connection string, an options class failing validation with ValidateOnStart, or an unreadable certificate fall into this group. Exit code 137 means the process was killed with SIGKILL (the Unix kill signal that can't be caught), and it has two different causes. We triggered the first on api-oom: we connected to the pod from our machine with kubectl port-forward deploy/api-oom 18890:8080 and called POST /api/diag/alloc-native?mb=300; the request got no answer (curl exit=52), and:
NAME                       READY   STATUS    RESTARTS     AGE
api-oom-5676979fb9-crg8v   1/1     Running   1 (6s ago)   87s
{"terminated":{"containerID":"containerd://80d8a8fd...","exitCode":137,"finishedAt":"2026-11-08T04:36:19Z","reason":"OOMKilled","startedAt":"2026-11-08T04:34:59Z"}}
reason: OOMKilled: the kernel killed the process that exceeded the cgroup memory limit. Since the pod came back up, only the RESTARTS column changed in get pods; you'll miss it if you're not paying attention. Native memory is outside the .NET GC (Garbage Collector) heap limit, so this isn't an OutOfMemoryException but outright death; that distinction was the topic of the ninth post. The second cause of 137 is the liveness probe killing the container; then reason is Error, and Events says failed liveness probe, will be restarted. There's also 139: a segmentation fault, rare in .NET, usually coming from a native library.
Running But Not Ready: A Port Mismatch
api-port has ASPNETCORE_HTTP_PORTS=80 set, while the Deployment's container port and probes are written for 8080. According to its log the app is happy:
04:35:44.024 info: Microsoft.Hosting.Lifetime[14] Now listening on: http://[::]:80
04:35:58.836 info: Bookstore.Api[0] ApplicationStopping: SIGTERM received, draining
Fifteen seconds later SIGTERM (the Unix termination signal) arrives. The reason is in Events:
Warning  Unhealthy  23s (x16 over 67s)  kubelet  spec.containers{api}: Readiness probe failed: Get "http://10.244.1.32:8080/health/live": dial tcp 10.244.1.32:8080: connect: connection refused
Warning  Unhealthy  23s (x9 over 63s)   kubelet  spec.containers{api}: Liveness probe failed: Get "http://10.244.1.32:8080/health/live": dial tcp 10.244.1.32:8080: connect: connection refused
Normal   Killing    8s (x4 over 53s)    kubelet  spec.containers{api}: Container api failed liveness probe, will be restarted
connection refused means nobody is listening on that port; a timeout means someone is listening but not answering, or a NetworkPolicy is blocking. That distinction is half of the diagnosis. Since .NET 8 the default port of container images is 8080 (ASPNETCORE_HTTP_PORTS); an ASPNETCORE_URLS=http://+:80 carried over from an old Dockerfile, or an env variable like the one above, is the most common source of this trap. It may also be surprising that an app running as non-root could bind to 80: as we see in the debug container below, the container runtime set net.ipv4.ip_unprivileged_port_start to 0 in the pod, so we got no bind error and the problem only showed up in the probes.
kubectl debug on a Shell-less Image
kubectl exec doesn't work on a chiseled image, because there's no shell to run:
$ kubectl -n bookstore-dbg exec api-port-775dbc57cc-9ftrg -- sh
error: Internal error occurred: ... exec: "sh": executable file not found in $PATH
That's a security feature, not a flaw. The answer is an ephemeral container: a temporary container with the tools you want is added to the running pod. --target attaches it to the target container's process namespace:
kubectl -n bookstore-dbg debug api-port-775dbc57cc-9ftrg --image=busybox:1.37 --target=api --profile=general \
  -- sh -c 'ps; echo; cat /proc/sys/net/ipv4/ip_unprivileged_port_start; ls /proc/1/root/app | head -5; netstat -tln'
PID USER TIME COMMAND
1 1654 0:00 dotnet Bookstore.Api.dll
42 root 0:00 sh -c ps; echo; cat /proc/sys/net/ipv4/ip_unprivileged_port_start; ...
52 root 0:00 ps
0
Bookstore.Api
Bookstore.Api.deps.json
Bookstore.Api.dll
Bookstore.Api.pdb
Bookstore.Api.runtimeconfig.json
Active Internet connections (only servers)
Proto Recv-Q Send-Q Local Address Foreign Address State
tcp 0 0 :::80 :::* LISTENBusybox's ps sees the .NET process as PID (Process ID) 1; we can look at the target container's file system through /proc/1/root, and netstat confirms it listens on 80. An ephemeral container is added to the pod spec and can't be removed; it stops when its work is done, but its record stays as long as the pod lives. If you don't want to touch the pod, you can also create a copy of it with kubectl debug --copy-to and work there.
Running dotnet-counters and dotnet-dump from an Ephemeral Container
The .NET diagnostic tools talk to the process over a Unix domain socket in /tmp. An ephemeral container sees the target's processes, but its file system is separate; when we tried directly with an image containing the tools (dotnet-counters, dotnet-dump and dotnet-trace installed from the SDK (Software Development Kit) with dotnet tool install --tool-path /tools and copied onto runtime:10.0):
No supported .NET processes were foundThe fix is to make the app's /tmp an emptyDir (we already did that for readOnlyRootFilesystem in the fifteenth post) and mount the same volume into the debug container, with the same user. kubectl debug --custom accepts a partial container spec:
{
  "volumeMounts": [
    { "name": "tmp", "mountPath": "/tmp" }
  ],
  "securityContext": {
    "runAsUser": 1654,
    "runAsGroup": 1654
  }
}
$ kubectl -n bookstore-dbg debug api-diag-858db68f59-tgwtn --image=bookstore-diag:1.0.0 --target=api \
--profile=general --custom=debug-profile.json -- dotnet-counters ps
1 dotnet /usr/share/dotnet/dotnet dotnet Bookstore.Api.dllFor a longer session we started the debug container with sleep 900 and went into it with kubectl exec -c, had the API make a 60 MB managed allocation, and collected counters:
$ kubectl -n bookstore-dbg exec api-diag-858db68f59-tgwtn -c diag -- dotnet-counters collect -p 1 \
    --counters System.Runtime --duration 00:00:06 --format csv -o /tmp/counters.csv
File saved to /tmp/counters.csv
...System.Runtime,dotnet.gc.last_collection.heap.size (By)[gc.heap.generation=loh],Metric,50334336
...System.Runtime,dotnet.gc.last_collection.heap.size (By)[gc.heap.generation=gen2],Metric,1314736
...System.Runtime,dotnet.process.memory.working_set (By),Metric,160186368
The 1 MB arrays exceeded the 85,000-byte threshold and went to the LOH (Large Object Heap); the working set is 160 MB. Now the moment from Guess First: a full dump from the same container.
$ kubectl -n bookstore-dbg exec api-diag-858db68f59-tgwtn -c diag -- dotnet-dump collect -p 1 -o /tmp/api.dmp
Writing full to /tmp/api.dmp
command terminated with exit code 137
api restarts=1 last={"terminated":{...,"exitCode":137,"finishedAt":"2026-11-08T04:38:04Z","reason":"OOMKilled",...}}
We killed the pod we were trying to diagnose. An ephemeral container has no resource limit of its own; it shares the pod's cgroup, and writing the dump plus the dump tool itself ate into the memory budget of a pod already running near its limit. The evidence of the leak went with the process. We raised the pod's memory limit to 1Gi without a restart, using the in-place resize we saw in earlier posts, and tried again:
$ kubectl -n bookstore-dbg patch pod api-diag-858db68f59-tgwtn --subresource resize \
    --patch '{"spec":{"containers":[{"name":"api","resources":{"limits":{"memory":"1Gi"}}}]}}'
Writing full to /tmp/api.dmp
Complete
$ kubectl -n bookstore-dbg exec api-diag-858db68f59-tgwtn -c diag2 -- dotnet-dump analyze /tmp/api.dmp -c "dumpheap -stat -min 100000" -c exit
Statistics:
          MT Count  TotalSize Class Name
aaaad46746b0     1    110,512 Free
ffff65caae10    60 62,916,000 System.Byte[]
Total 61 objects, 63,026,512 bytes
Sixty 1 MB byte[] arrays: exactly the allocation we triggered. The dump file was 403 MB, sitting in the emptyDir, that is on the node's disk. The analysis itself is a topic for the Profiling series; what matters here is taking the dump without killing the pod.
Production Notes
Diagnostic information must be captured before it disappears: kubectl logs --previous keeps only the previous container, and everything is gone when the pod is deleted; central log collection is the topic of the upcoming Observability series. Before taking a dump on a production pod, do three things: take the pod out of the Service (by changing its label, or by leaving traffic to other replicas), make memory headroom (in-place resize, or at least a sufficient limit), and make sure there's room on the disk the dump goes to. dotnet-dump collect --type Heap is smaller than a full dump but doesn't remove the memory pressure. A dump is sensitive data: connection strings, tokens and customer data sit inside in plain text; restrict access to wherever it's copied and delete it when you're done. Prepare the debug image in advance and put it in your registry; pulling the SDK image and installing tools in the middle of an incident is both slow and likely to hit production network policies. The right to use kubectl debug (patch on pods/ephemeralcontainers) is a separate permission in RBAC (Role-Based Access Control); know who can open that door.
Common Pitfalls
Looking only at the STATUS column and skipping RESTARTS and READY. Reading logs without --previous on a CrashLoopBackOff and staring at the new container's empty log. Seeing "authorization failed" and only hunting for the password; a typo in the tag gives the same message. Assuming exit code 137 always means OOM (Out Of Memory); check the reason field. Treating connection refused and timeout as the same error. Changing the image to add a shell to a chiseled image, when ephemeral containers exist. Running the dotnet tools without sharing /tmp and losing time to "no process found". And taking a dump on a pod near its limit, destroying the evidence with your own hands.
A Small Experiment
★☆☆ Change the image in the api-typo Deployment to bookstore-api:1.2.0 but add imagePullPolicy: Always. What happens with an image loaded locally into kind, and why?
★★☆ Instead of FailFast in api-crash, add a required options class validated with ValidateOnStart to the Bookstore API and deploy it without the config. What are the exception's name and message in the logs --previous output? Does the exit code change?
★★★ Take a trace from the debug container with dotnet-trace collect -p 1 --duration 00:00:10, copy it from the debug container to your machine with kubectl cp -c and open it with Visual Studio or PerfView. While the trace is being taken, watch the pod's memory and CPU usage with kubectl top pod --containers.
On a local cluster we can see everything and break everything. In the next post we bring all of this together, move the .NET + Angular app to managed Kubernetes, that is AKS (Azure Kubernetes Service), EKS (Amazon Elastic Kubernetes Service) and GKE (Google Kubernetes Engine), and draw up a production checklist.