

Diagnostics in Production: dotnet-monitor, Collection Rules, Kubernetes Sidecars and Continuous Profiling
dotnet-monitor collects traces, gcdumps and dumps through an HTTP API and collection rules, so nobody has to get into the container; rules need Listen mode, and security needs a localhost-bound API, an API key and restricted egress. We run Bookstore with a sidecar on kind, measure rules triggered by slow report requests and by our own meter, the throttling of Limits and the suspend/nosuspend difference, and look at the alpha status of OpenTelemetry Profiles.
Version note: The code in this post was built and run with .NET 10 (runtime 10.0.15 in the container), dotnet-monitor 10.0.5, Kubernetes 1.37 on kind 0.33, kubectl 1.37, Microsoft.Diagnostics.Tracing.TraceEvent 4.0.0 and k6 2.4.0 for load.
Guess First
Bookstore, the online bookstore used as the shared example across this site's series, runs on Kubernetes in production, and you have decided to add dotnet-monitor to its pod as a sidecar. You add a single environment variable to the app container: DOTNET_DiagnosticPorts=/diag/dotnet-monitor.sock. Two questions. If one day the monitor container fails to start, what does the app do: start normally, fail and exit, or something else? Second: you wrote a rule that takes a CPU trace automatically when the report endpoint gets slow, and the load stayed high for half an hour. How many trace files pile up? The answers are in the sidecar and collection rule sections.
dotnet-monitor: an HTTP API for Diagnostics
Every tool we have used so far needed someone to get into the container and run a command. dotnet-monitor is a long-running process that does the same jobs (trace, gcdump, dump, logs, metrics) through an HTTP API: GET /processes, /trace, /gcdump, /dump, /logs, /livemetrics, and /metrics in Prometheus format. Its real difference is collection rules: when a given condition occurs it starts collecting on its own, without waiting for a human, and writes the result to an egress target (file system, Azure Blob Storage, S3-compatible storage).
dotnet-monitor talks to processes over the diagnostic port described in 01, and there are two ways to do that. In Connect mode (the default) the monitor connects to the socket the app opens; according to the docs, trace, gcdump, dump and metrics work in this mode but collection rules and triggers do not. In Listen mode it is the other way round: the monitor opens a socket and waits, and the app's runtime connects to it at startup. If you want collection rules you need Listen mode; that is the setup in this post.
A Sidecar in Kubernetes
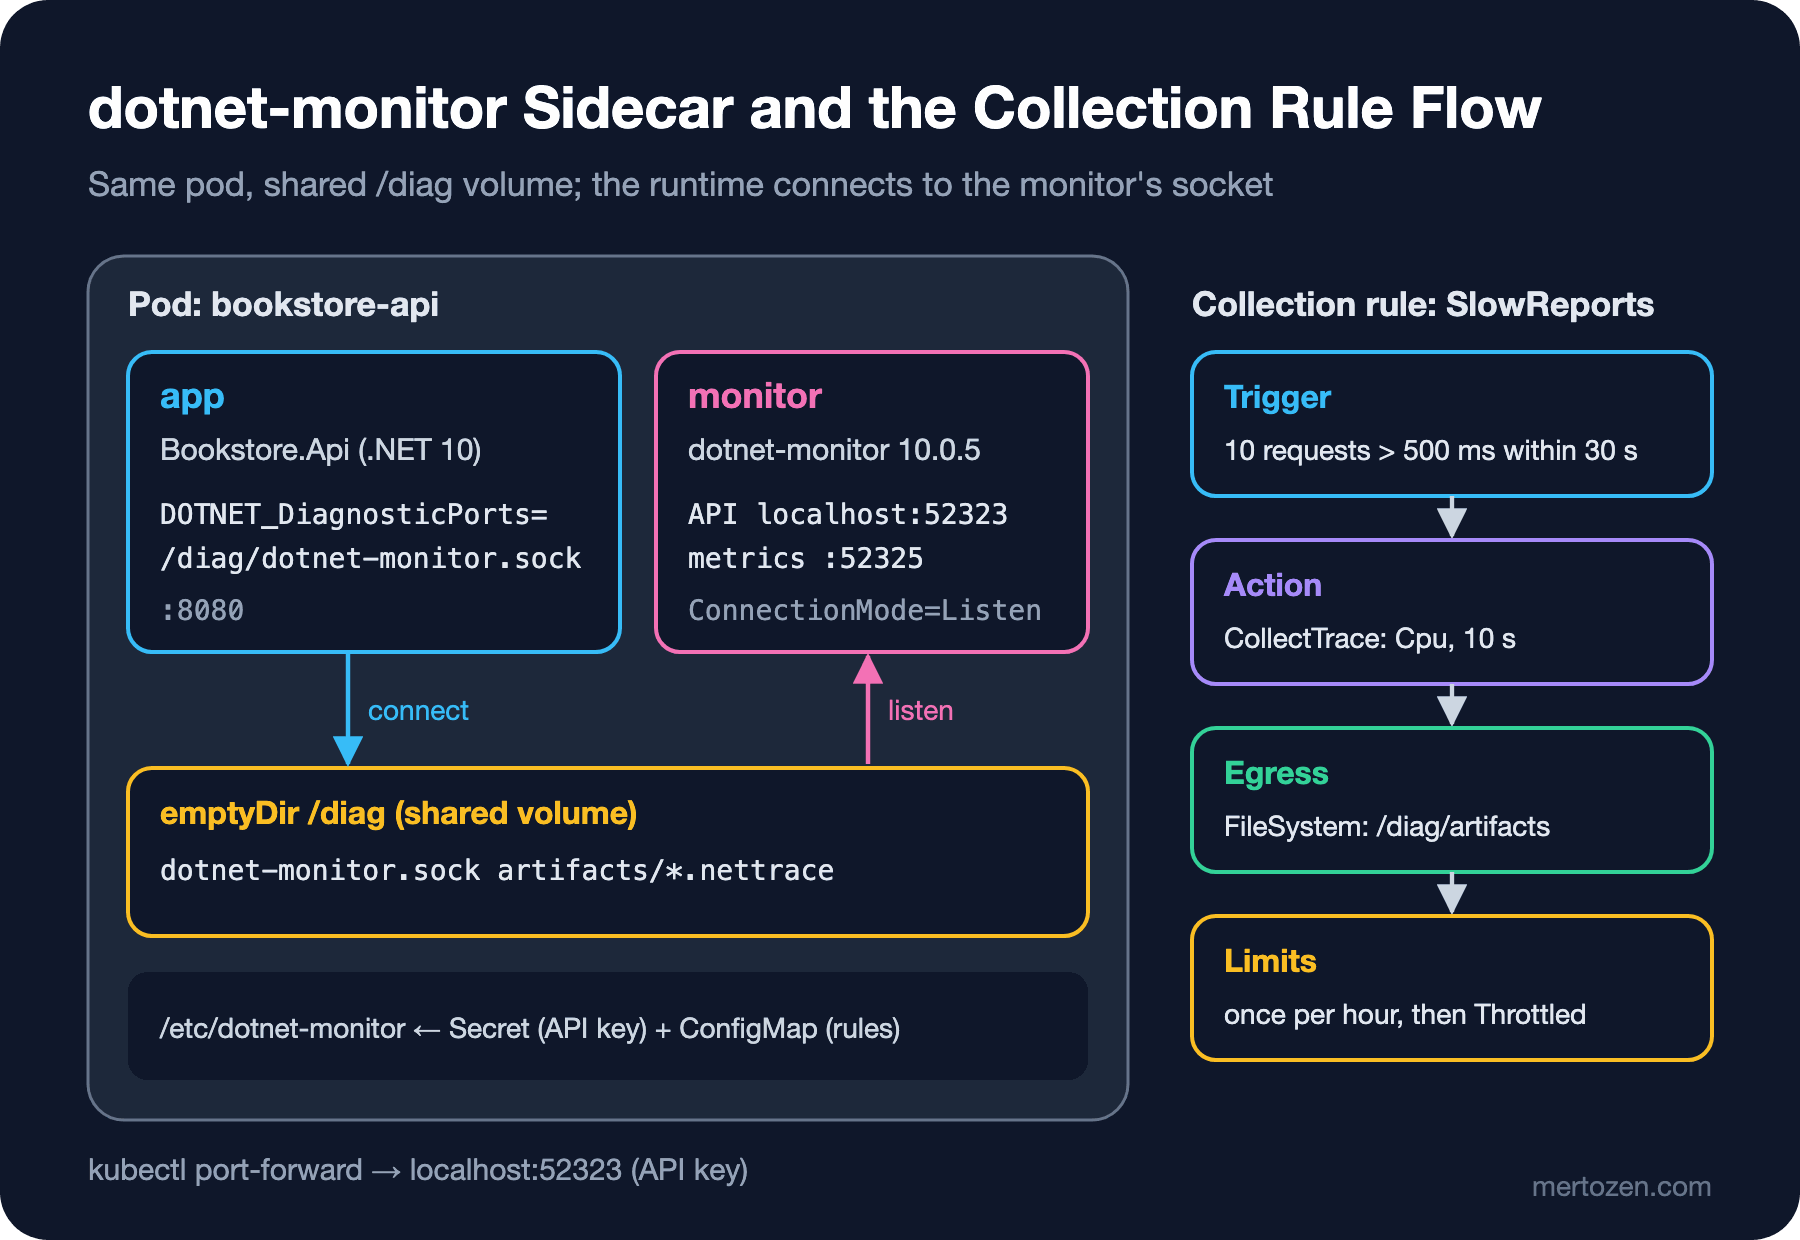
The skeleton of the sidecar comes from the Kubernetes sample in the dotnet-monitor repository: a shared emptyDir volume for the two containers, Listen mode and the shared path on the monitor side, and DOTNET_DiagnosticPorts pointing at the socket on the app side. In 01 we wired up by hand the two things a sidecar needs to see (the PID namespace and /tmp); in Listen mode there is no need to share the PID namespace, because the app makes the connection.
apiVersion: apps/v1
kind: Deployment
metadata:
  name: bookstore-api
spec:
  replicas: 1
  selector:
    matchLabels:
      app: bookstore-api
  template:
    metadata:
      labels:
        app: bookstore-api
    spec:
      containers:
        - name: app
          image: profseries-api:lab08
          imagePullPolicy: IfNotPresent
          env:
            # the runtime connects to dotnet-monitor's socket; suspend = wait for it at startup
            - name: DOTNET_DiagnosticPorts
              value: /diag/dotnet-monitor.sock
          ports:
            - containerPort: 8080
          volumeMounts:
            - name: diag
              mountPath: /diag
          resources:
            requests:
              cpu: "1"
              memory: 512Mi
            limits:
              cpu: "2"
              memory: 1Gi
        - name: monitor
          image: mcr.microsoft.com/dotnet/monitor:10.0.5
          args: [ "collect" ]
          env:
            - name: DOTNETMONITOR_DiagnosticPort__ConnectionMode
              value: Listen
            - name: DOTNETMONITOR_Storage__DefaultSharedPath
              value: /diag
            # API only inside the pod: reach it with kubectl port-forward, never with a Service
            - name: DOTNETMONITOR_Urls
              value: http://localhost:52323
            - name: DOTNETMONITOR_Metrics__Endpoints
              value: http://+:52325
          volumeMounts:
            - name: diag
              mountPath: /diag
            - name: monitor-config
              mountPath: /etc/dotnet-monitor
              readOnly: true
          resources:
            requests:
              cpu: 50m
              memory: 32Mi
            limits:
              cpu: 250m
              memory: 256Mi
      volumes:
        - name: diag
          emptyDir:
            sizeLimit: 2Gi
        - name: monitor-config
          projected:
            sources:
              - secret:
                  name: bookstore-monitor-auth
              - configMap:
                  name: bookstore-monitor-rules
The monitor's resource values are the recommended minimums and limits from the docs. With DefaultSharedPath set, the monitor opens its socket as /diag/dotnet-monitor.sock and has dumps produced in the same place. The rest of the settings come from /etc/dotnet-monitor: dotnet-monitor reads settings.json in that folder and files whose names are setting keys (key-per-file). With a projected volume I put a Secret (the API key) and a ConfigMap (the collection rules) in the same folder. I ran the lab on a local Kubernetes 1.37 cluster set up with kind:
kind load docker-image profseries-api:lab08 --name profseries
kubectl create configmap bookstore-monitor-rules --from-file=settings.json=monitor-settings.json
kubectl apply -f bookstore-api.yaml
kubectl get pods
NAME READY STATUS RESTARTS AGE
bookstore-api-558bd5cc7c-4644d 2/2 Running 0 2m38sThe answer to the first guess hides in the default of DOTNET_DiagnosticPorts: suspend. The runtime halts startup until it connects to the socket and gets a resume command from the monitor. I tried what happens without a monitor in a container; after 10 seconds /health still did not answer, and the app log said this:
The runtime has been configured to pause during startup and is awaiting a Diagnostics IPC ResumeStartup command from a Diagnostic Port.
DOTNET_DiagnosticPorts="/tmp/dotnet-monitor.sock"
DOTNET_DefaultDiagnosticPortSuspend=0
With the value set to /diag/dotnet-monitor.sock,nosuspend, the app started without waiting for the monitor and /health returned 200. The choice is a trade-off: with suspend you do not miss startup events (assembly loads, startup triggers), but the monitor's health becomes a condition for the app starting; with nosuspend the service comes up even if the monitor crashes, but the first moments of startup may not be recorded. In production I would pick nosuspend and do startup analysis in staging with suspend. The effect of the pod's CPU and memory limits on the .NET GC is covered in the Kubernetes series post "Resource Requests and Limits: QoS, OOMKilled, CPU Throttling and the .NET GC in Containers".
Authentication: API Key, HTTPS and Access
The dotnet-monitor API is a door that can hand out the entire memory of a process as a dump, so it requires authentication by default. The docs recommend Microsoft Entra ID (formerly Azure AD); the simplest way is an API key. The tool's own command generates a key pair: a Subject and PublicKey for configuration, and an Authorization: Bearer header for requests:
docker run --rm mcr.microsoft.com/dotnet/monitor:10.0.5 generatekey -o MachineJson
kubectl create secret generic bookstore-monitor-auth \
    --from-literal=Authentication__MonitorApiKey__Subject=<subject> \
    --from-literal=Authentication__MonitorApiKey__PublicKey=<public-key>
Following the key-per-file rule, the key names in the Secret become file names, and dotnet-monitor reads them as the Authentication:MonitorApiKey setting. Two lines in the monitor's startup log caught my eye:
Connection mode: Listen at '/diag/dotnet-monitor.sock'
WARNING: Authentication is enabled over insecure http transport. This can pose a security risk and is not intended for production environments.
The warning is fair: the API key travels in plain text over HTTP. In this lab I made the API listen only on localhost:52323; it cannot be reached from outside the pod or from another pod, the only way in is kubectl port-forward, and that requires permissions in the cluster. In production, add HTTPS on top. The metrics endpoint (52325), according to the docs, does no authentication at all; it holds only numbers, but still open it only to Prometheus with a network policy.
kubectl port-forward deploy/bookstore-api 5483:8080 52323:52323 52325:52325
curl -s -o /dev/null -w '%{http_code}\n' localhost:52323/processes
curl -s -H "Authorization: Bearer <token>" localhost:52323/processes
401
[{"pid":1,"uid":"4e04af7e-ab87-4aa8-af00-3a69b20fb22e","name":"dotnet","isDefault":true}]On-Demand Collection: Traces and gcdumps
The simplest use is asking the API for something during an incident. With only one .NET process in the pod it is the default process; passing pid is still a good habit. The profile names differ from dotnet-trace's: Cpu, Http, Logs, Metrics, GcCollect.
curl -s -H "Authorization: Bearer <token>" "localhost:52323/gcdump?pid=1" -o bookstore.gcdump
curl -s -H "Authorization: Bearer <token>" "localhost:52323/trace?pid=1&durationSeconds=5&profile=Cpu,Http" -o bookstore.nettrace
The gcdump came back as 6.6 MB in 2.1 seconds, the 5-second trace as 5.1 MB; the files stream directly in the HTTP response. If you add egressProvider=artifacts to the same request, the file goes to the configured egress target instead of your machine, and the API immediately returns 202 Accepted with a Location: /operations/{id} header; you ask that address for the job's status. That is the right way for large dumps, because moving hundreds of MB over port-forward is both slow and fragile.
By default the metrics endpoint serves the EventCounters of System.Runtime and ASP.NET Core Hosting in Prometheus format (such as systemruntime_cpu_usage_ratio and microsoftaspnetcorehosting_requests_per_second). To see the new System.Runtime Meter we used in 02, or Bookstore's own meter, you need to add the meter names under Metrics:Meters. Moving these metrics to Prometheus and a dashboard is the topic of the Observability series on the DevOps side.
Collection Rules: Trigger, Action, Egress, Limits
A collection rule has four parts: when (the trigger), what to do (the action list), where the result goes (egress) and how often (limits). The settings.json in the ConfigMap defines two rules:
{
  "Egress": {
    "FileSystem": {
      "artifacts": {
        "DirectoryPath": "/diag/artifacts"
      }
    }
  },
  "CollectionRules": {
    "SlowReports": {
      "Trigger": {
        "Type": "AspNetRequestDuration",
        "Settings": {
          "RequestCount": 10,
          "RequestDuration": "00:00:00.500",
          "SlidingWindowDuration": "00:00:30",
          "IncludePaths": [ "/api/reports/**" ]
        }
      },
      "Actions": [
        {
          "Name": "CpuTrace",
          "Type": "CollectTrace",
          "Settings": {
            "Profile": "Cpu",
            "Duration": "00:00:10",
            "Egress": "artifacts"
          }
        }
      ],
      "Limits": {
        "ActionCount": 1,
        "ActionCountSlidingWindowDuration": "01:00:00"
      }
    },
    "SlowPayments": {
      "Trigger": {
        "Type": "EventMeter",
        "Settings": {
          "MeterName": "Bookstore.Ordering",
          "InstrumentName": "bookstore.payment.duration",
          "HistogramPercentile": 95,
          "GreaterThan": 0.2,
          "SlidingWindowDuration": "00:00:15"
        }
      },
      "Actions": [
        {
          "Name": "HttpTrace",
          "Type": "CollectTrace",
          "Settings": {
            "Profile": "Http",
            "Duration": "00:00:10",
            "Egress": "artifacts"
          }
        }
      ],
      "Limits": {
        "ActionCount": 1,
        "ActionCountSlidingWindowDuration": "01:00:00"
      }
    }
  }
}
SlowReports takes a 10-second CPU trace if it sees 10 requests on the report paths that take longer than 500 ms within 30 seconds. SlowPayments takes an HTTP trace if the p95 of the payment duration histogram in the Bookstore.Ordering meter we wrote in 02 stays above 200 ms for 15 seconds; the EventMeter trigger has existed since dotnet-monitor 8 and is the way to trigger on your own metrics. You can ask the API for the state of the rules:
curl -s -H "Authorization: Bearer <token>" "localhost:52323/collectionrules?pid=1"{"SlowPayments":{"state":"Running","stateReason":"This collection rule is active and waiting for its triggering conditions to be satisfied."},"SlowReports":{"state":"Running","stateReason":"This collection rule is active and waiting for its triggering conditions to be satisfied."}}Through port-forward I put 25 seconds of load at 20 requests per second on the slow CSV export from 04. In the pod with a 2-CPU limit, requests took 2 seconds on average (p95 3.05 s). Filtering the time and message fields from the monitor's JSON log:
01:08:39.008 Information Collection rule 'SlowReports' trigger 'AspNetRequestDuration' completed.
01:08:39.114 Information Collection rule 'SlowReports' action 'CollectTrace' started.
01:08:49.315 Information Egressed artifact to /diag/artifacts/20261114_010839_125_1.nettrace
01:08:49.319 Information Collection rule 'SlowReports' action 'CollectTrace' completed.
01:08:49.320 Information Collection rule 'SlowReports' trigger 'AspNetRequestDuration' started.
01:08:50.939 Information Collection rule 'SlowReports' trigger 'AspNetRequestDuration' completed.
01:08:51.041 Warning Collection rule 'SlowReports' actions throttled due to action limits.
The answer to the second guess is here: one. The trigger fired again every two seconds because the load continued, but due to ActionCount: 1 it logged a "throttled" warning each time and collected nothing. Without limits, half an hour of load would have filled the volume with hundreds of 12 MB traces; once the 2 GiB sizeLimit I gave the emptyDir is exceeded, the kubelet evicts the pod. The rule's state says the same:
{"lifetimeOccurrences":1,"slidingWindowOccurrences":1,"actionCountLimit":1,"actionCountSlidingWindowDurationLimit":"01:00:00","slidingWindowDurationCountdown":"00:59:24","ruleFinishedCountdown":null,"state":"Throttled","stateReason":"This collection rule is temporarily throttled because the ActionCountLimit has been reached within the ActionCountSlidingWindowDuration."}I tested the payment rule with 20 virtual users paying by card; the p95 the client saw was 214 ms; the trigger fired while the load was running and wrote its 10-second HTTP trace to the same folder. I pulled the collected file from the app container and opened it with Bookstore.TraceStats from 06; since the monitor image has no tar and no shell (I tried), kubectl cp does not work in the monitor container, and thanks to the shared volume the file can be taken from the app container:
kubectl cp -c app bookstore-api-558bd5cc7c-4644d:/diag/artifacts/20261114_010839_125_1.nettrace ./slowreports.nettrace
dotnet run -c Release -- cpu slowreports.nettrace \
    --inc "module Microsoft.AspNetCore.Server.Kestrel.Core" --exc UNMANAGED_CODE_TIME \
    --foldpats CPU_TIME --group "{%}!->module $1"
Exc % Inc % Name (total 5,135 ms)
98.1 99.9 module System.Private.CoreLib
1.0 99.9 module Microsoft.AspNetCore.Server.Kestrel.Core
0.8 96.1 module Bookstore.Api96 percent of request time is under Bookstore code and almost all of it is in CoreLib: the same StringBuilder and LOH picture we found in 04, this time collected without anyone getting into the container.
Continuous Profiling
Collection rules follow a "record when something happens" model. Continuous profiling instead samples continuously at a low rate and stores the result like a time series; you can go back to the moment a problem started and look at that minute's flame graph. OpenTelemetry is developing a new signal called Profiles and an OTLP format to standardize this. According to the public alpha announced in 2026, the format converts to and from pprof without loss, profiles can be linked to traces, and the eBPF-based profiler on Linux supports .NET 9 and 10. The same announcement states plainly that the alpha is not recommended for critical production workloads and that production-ready backends do not exist yet. An open source option usable today is Grafana Pyroscope: according to its docs, its .NET profiler supports .NET 8, 9 and 10 on Linux on x64 and Arm64. On the cloud side, providers' own profilers such as the Azure Application Insights Profiler, and commercial APM products, do the same job as a managed service; when choosing, ask where the data goes, how long it is kept and what it costs. My advice: first capture the moment of the incident with collection rules, and add continuous profiling only for intermittent problems you cannot reproduce.
In Production
Dumps and traces carry secrets and personal data. A full dump holds connection strings, tokens and customer data exactly as they sit in memory; the database profile we saw in 07 carried the connection string with every command. Choose the egress target accordingly: a storage account or bucket with restricted access, automatic deletion with a lifecycle rule (for example 7 days), encryption, and a record of who downloaded what. If FileSystem egress writes to an emptyDir, the files are gone when the pod is deleted; if you need them for post-incident analysis, write to a durable target.
Never expose the dotnet-monitor API with a Service, Ingress or LoadBalancer. Make it listen on localhost as in this lab, grant pods/portforward through RBAC only to the on-call team, keep the API key in a Secret and rotate it regularly, and use HTTPS. The monitor container's resource limits are small; but because the event buffer grows in the app process during a trace, leave headroom in the app's memory limit. Treat limits as mandatory on every rule: a rule written without ActionCount can fill the disk and take the pod down at the worst moment of the problem.
Common Pitfalls
- Leaving the monitor in Connect mode and wondering why collection rules never run; triggers require Listen mode.
- Setting
DOTNET_DiagnosticPortswithoutnosuspendand not thinking about the day the monitor fails to start: the app waits at startup. - Trying things with
--no-authand carrying that setting into the production manifest; the warning in the sample deployment exists exactly for this. - Putting no limits on a rule and letting a constantly firing trigger fill the volume.
- Using an
emptyDirfor egress and realizing after the incident that the evidence is gone because the pod restarted. - Expecting the new
System.RuntimeMeter on the metrics endpoint; the old EventCounter names come by default, and meters must be added in configuration.
A Small Experiment
★☆☆ Set up the lab on kind and try DOTNET_DiagnosticPorts first with the default, then with nosuspend; break the monitor container's image name on purpose and check whether the app starts in each case.
★★☆ Write a rule for the leaking /ship endpoint from 05: run CollectGCDump when a memory metric in the System.Runtime Meter crosses a threshold. Set the limits so that two gcdumps are collected half an hour apart, and compare the two files with the diff script from 05.
★★★ Switch the FileSystem egress to S3-compatible storage (a MinIO container locally); verify that files are deleted after 1 day by a lifecycle rule and that a client without the API key cannot see the /operations results.
We now have everything: metrics, traces, gcdumps, IDE tools and automatic collection in production. In the next post we use them in order on a single case: with checkout's p99 burning through its SLO, we will start from dotnet-counters, find the root cause, and prove the fix with BenchmarkDotNet and k6.