

Hunting Memory Leaks: dotnet-gcdump, Heap Snapshot Diffing and Common Leak Patterns

A memory leak is found not with a single snapshot but with the difference between two gcdumps taken under the same load and the retention path that holds the growing object from a root. In Bookstore we catch, with dotnet-gcdump, a scoped handler that subscribes to a singleton event and never unsubscribes, taking the heap from 17.8 MB to 348.5 MB in 20,000 requests; we compare gcdump with full dumps, prove the fix with a third snapshot and list common leak patterns.
Version note: The code in this post was built and run with .NET 10 (runtime 10.0.15 in the container), dotnet-gcdump, dotnet-dump and dotnet-counters 10.0.750501, with k6 2.4.0 generating load and Python 3 for the diff script.
Guess First
In Bookstore, the endpoint that ships an order took the GC heap from 17.8 MB to 348.5 MB after 20,000 requests, and it keeps growing. To diagnose it you will take two snapshots of the heap. Two questions: how many MB is a snapshot of a 348 MB heap, and how long does taking it pause the process? How does it compare with a full dump? And once you find the growing objects, how do you find out who holds them? The answer to the first question is in the numbers in the table; the second is the real topic of this post.
gcdump or Full Dump?
dotnet-gcdump does not take a full copy of the process. Over EventPipe it triggers a gen2 GC and rebuilds the object graph from the events the GC publishes while walking the heap: how many objects of each type, their sizes, who references whom. The contents of objects (string values, the bytes of byte arrays) do not go into the file. I took three files from the same process at the same moment:
| gcdump | Heap dump | Full dump | |
|---|---|---|---|
| File (348 MB GC heap) | 1.9 MB | 607 MB | 738 MB |
| Contents | Types, sizes, reference graph | Process memory including the managed heap | All of the process's memory |
| Personal data, secrets | No values, only types and counts | Yes | Yes |
| Collection cost | A full gen2 GC (18.6 ms in this case) | The process freezes until the file is written | The process freezes until the file is written |
| What it sees | Only the managed heap | Managed heap, threads, stacks | Everything, native memory included |
In a leak hunt the question is "what accumulates and who holds it"; a gcdump is enough for that and far better suited to production. Where a dump is needed (crashes, deadlocks, seeing the contents of a string) and answering the same question with SOS's dumpheap/gcroot commands were covered in the "Analyzing Crash and Memory Dumps" post of the Debugging and Problem Solving series; we do not repeat that path here.
The Case: A Scoped Handler Subscribing to a Singleton
// singleton: lives as long as the process
public sealed class OrderEvents
{
    public event EventHandler<OrderShippedEventArgs>? OrderShipped;

    public void PublishShipped(int orderId) => OrderShipped?.Invoke(this, new OrderShippedEventArgs(orderId));
}

// scoped: one instance per request
public sealed class ShippingEmailHandler
{
    private readonly byte[] _renderBuffer = new byte[16 * 1024];
    private readonly ILogger<ShippingEmailHandler> _logger;

    public ShippingEmailHandler(OrderEvents events, ILogger<ShippingEmailHandler> logger)
    {
        _logger = logger;
        events.OrderShipped += OnOrderShipped;
    }

    public int SentCount { get; private set; }

    private void OnOrderShipped(object? sender, OrderShippedEventArgs e)
    {
        _renderBuffer[0] = (byte)(e.OrderId % 255);
        SentCount++;
        _logger.LogDebug("Shipping email rendered for order {OrderId}", e.OrderId);
    }
}

app.MapPost("/api/orders/{id:int}/ship", (int id, ShippingEmailHandler handler, OrderEvents events) =>
{
    events.PublishShipped(id);
    return Results.Accepted(value: new { id, handler.SentCount });
});
The code looks innocent and works correctly when you try a single request. The problem is the +=: subscribing to the event means adding a reference to the handler to the delegate held by the singleton OrderEvents. The request ends, the DI scope closes, but because the handler is reachable from the singleton, the GC cannot collect it. On top of that, every new publish also calls all the old handlers. I sent four batches of 5,000 requests with 10 virtual users; p95 was 2.8 and 2.4 ms in the first two batches and 6.0 ms in the last two, while p99 went from 3.4 ms to 33 ms. Here a memory leak is also a CPU leak.
Two Snapshots and a Diff
I took the first snapshot after 1,000 requests and the second after sending 20,000 more:
docker exec profseries-api dotnet-gcdump collect -p 1 -o /tmp/snap1.gcdump -v
docker exec profseries-api dotnet-gcdump collect -p 1 -o /tmp/snap2.gcdump -v
docker exec profseries-api dotnet-gcdump report /tmp/snap2.gcdump
Writing gcdump to '/tmp/snap2.gcdump'...
0.1s: Requesting a .NET Heap Dump
Warning: the target runtime does not support non-lossy (Block) buffering, which requires .NET 11+. Falling back to the default lossy buffering; the gcdump may be incomplete on large heaps.
Found a Gen2 Induced non-background GC Start at 0.305 msec GC Count 601
Found a GC Stop at 18.649 for GC 601, ignoring events from now on.
[ 0.4s: Done Dumping .NET heap success=True]
Finished writing 1924900 bytes.(I shortened the -v output.) Collection took 0.4 seconds, 18.6 ms of which was the induced gen2 during which the GC stopped all threads. Note the warning: on the .NET 10 runtime, events are collected with lossy buffering and on a very large heap the gcdump can be incomplete; the lossless mode needs the .NET 11 runtime (the last post of the series). The report output:
    348,529,611  GC Heap bytes
         81,838  GC Heap objects

   Object Bytes     Count  Type
        262,168         1  System.Object[] (Bytes > 100K)  [System.Private.CoreLib.dll]
         57,596         1  System.String (Bytes > 10K)  [System.Private.CoreLib.dll]
         49,200         1  System.Int32[] (Bytes > 10K)  [System.Private.CoreLib.dll]
         16,408    21,003  System.Byte[] (Bytes > 10K)  [System.Private.CoreLib.dll]
There is a trick to reading this table: in this version the first column is not the type's total size but the size of the individual objects on that row, and the sort follows it. The 21,003 byte arrays of 16 KB that hold 344 MB appear fourth in the list. To see the real totals and the difference between two snapshots, I wrote a small script that multiplies and subtracts the two reports:
import re
import sys

# "per-object bytes, count, type" lines of a dotnet-gcdump report
LINE = re.compile(r"^\s*([\d,]+)\s+([\d,]+)\s+(.+?)\s*$")


def load(path):
    totals = {}
    for line in open(path, encoding="utf-8"):
        m = LINE.match(line)
        if not m or "GC Heap" in line:
            continue
        size, count = int(m.group(1).replace(",", "")), int(m.group(2).replace(",", ""))
        name = re.sub(r"\s+\[[^\]]+\]$", "", m.group(3))
        b, c = totals.get(name, (0, 0))
        totals[name] = (b + size * count, c + count)
    return totals


before, after = load(sys.argv[1]), load(sys.argv[2])
rows = []
for name in before.keys() | after.keys():
    (b1, c1), (b2, c2) = before.get(name, (0, 0)), after.get(name, (0, 0))
    rows.append((b2 - b1, c1, c2, name))
print(f"{'Bytes +':>14} {'Count 1':>9} {'Count 2':>9}  Type")
for growth, c1, c2, name in sorted(rows, reverse=True)[:6]:
    print(f"{growth:>14,} {c1:>9,} {c2:>9,}  {name}")
python3 gcdiff.py snap1.txt snap2.txt Bytes + Count 1 Count 2 Type
328,160,000 1,003 21,003 System.Byte[] (Bytes > 10K)
1,280,000 1,003 21,003 System.EventHandler<Bookstore.Api.Shipping.OrderShippedEventArgs>
800,000 1,002 21,002 Bookstore.Api.Shipping.ShippingEmailHandler
262,168 0 1 System.Object[] (Bytes > 100K)
59,752 616 1,295 System.Reflection.RuntimeParameterInfo
25,480 1,014 1,259 System.Reflection.RuntimeMethodInfoThe strongest signal in the diff is the counts growing in lockstep: 20,000 requests, 20,000 new handlers, 20,000 new delegates, 20,000 new 16 KB buffers. The biggest row in bytes is byte[], but it does not own the problem; it is just a field of the handler. In a leak hunt, look not at the biggest type but at your own type whose count grows with the number of requests. A single 262 KB object[] also appeared on the LOH: the multicast delegate's invocation list. When the array fills up it is recreated with double the capacity; 21,002 subscribers fit into a 262 KB array with a capacity of 32,768, and an array of that size lives on the LOH.
Retention Path: Who Holds It?
We found what accumulates; now we need the reference chain keeping it alive. On Windows, Visual Studio opens a .gcdump: opening the file brings up the managed memory report, opening the second snapshot and selecting the first as the comparison (baseline) adds per-type difference columns, and selecting a type shows, in the "Paths to Root" tree below, the reference chains from the roots to that object. In PerfView the same work is done with the heap stack views and a diff (06). Since there is no Visual Studio on this machine, I describe these steps from Microsoft's documentation. On Linux there is no UI that opens a .gcdump; I extracted the chain with a small console app calling the graph classes dotnet-gcdump itself uses. The path for a handler I picked at random:
21002 objects match 'Bookstore.Api.Shipping.ShippingEmailHandler'
  [.NET Roots] (0 B)
  [local vars] (0 B)
  Microsoft.AspNetCore.Builder.WebApplication (48 B)
  Microsoft.Extensions.Hosting.Internal.Host (96 B)
  Microsoft.Extensions.DependencyInjection.ServiceProvider (72 B)
  System.Collections.Concurrent.ConcurrentDictionary<...ServiceIdentifier,...ServiceProvider+ServiceAccessor> (40 B)
  ServiceAccessor (32 B)
  Microsoft.Extensions.DependencyInjection.ServiceLookup.ConstructorCallSite (96 B)
  Bookstore.Api.Shipping.OrderEvents (24 B)
  System.EventHandler<Bookstore.Api.Shipping.OrderShippedEventArgs> (64 B)
  System.Object[] (Bytes > 100K) (262168 B)
  System.EventHandler<Bookstore.Api.Shipping.OrderShippedEventArgs> (64 B)
  Bookstore.Api.Shipping.ShippingEmailHandler (40 B)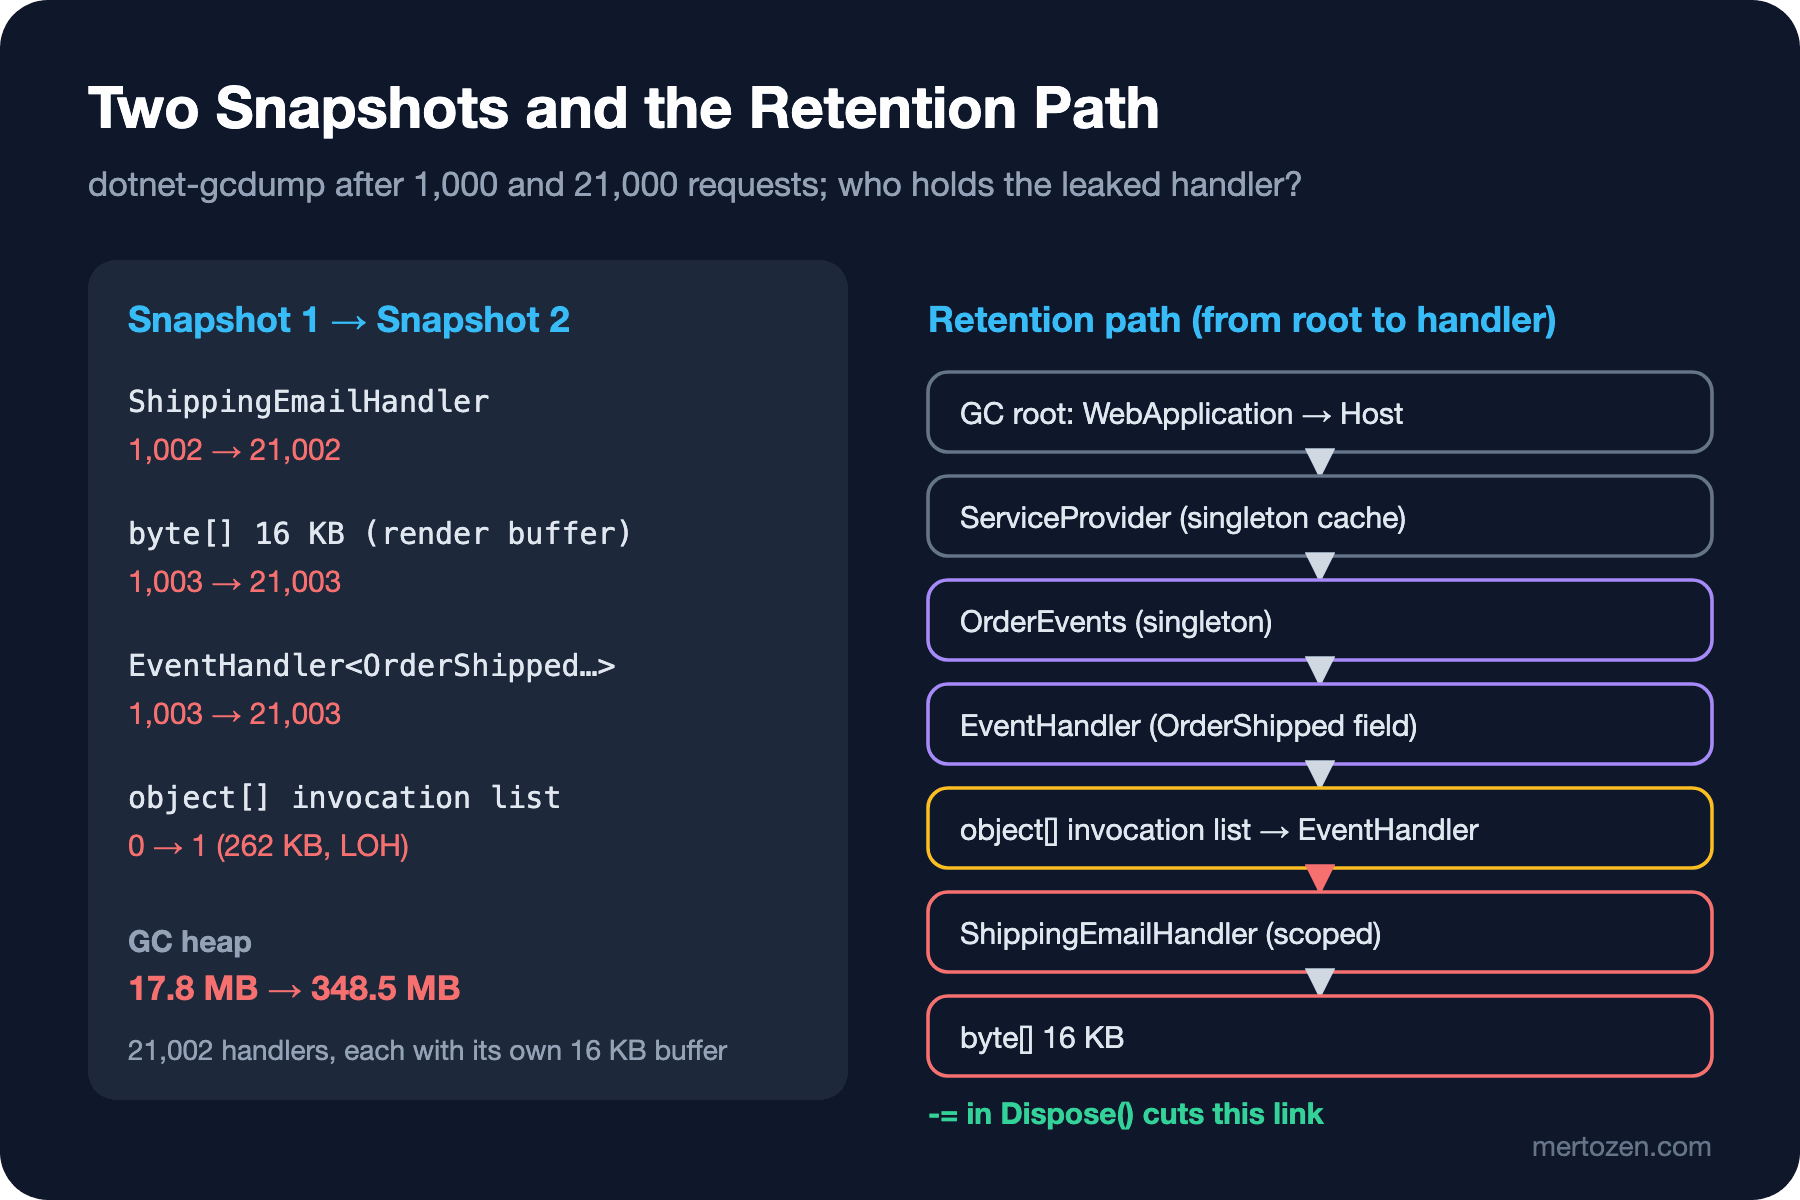
(I shortened the middle of the generic type names.) Reading the chain top-down tells the story: the app itself holds the DI container, the container holds OrderEvents through the call site where it caches singletons, OrderEvents holds the multicast delegate in its event field, that delegate holds the invocation list with 21,002 entries, and each delegate in the list holds a handler through its _target field. The link that has to be cut is clear: the reference from the singleton to the scoped object.
The Fix and a Third Snapshot
// scoped: one instance per request; unsubscribes when the request scope is disposed
public sealed class ShippingEmailHandler : IDisposable
{
    private readonly byte[] _renderBuffer = new byte[16 * 1024];
    private readonly OrderEvents _events;
    private readonly ILogger<ShippingEmailHandler> _logger;

    public ShippingEmailHandler(OrderEvents events, ILogger<ShippingEmailHandler> logger)
    {
        _events = events;
        _logger = logger;
        _events.OrderShipped += OnOrderShipped;
    }

    public int SentCount { get; private set; }

    public void Dispose() => _events.OrderShipped -= OnOrderShipped;

    private void OnOrderShipped(object? sender, OrderShippedEventArgs e)
    {
        _renderBuffer[0] = (byte)(e.OrderId % 255);
        SentCount++;
        _logger.LogDebug("Shipping email rendered for order {OrderId}", e.OrderId);
    }
}
When a scope closes, the DI container disposes the scoped services that are IDisposable; the -= cuts the link there. I ran the fixed image in a fresh container, repeated the same experiment and took two more snapshots as proof:
      1,114,462  GC Heap bytes
      1,349,800  GC Heap bytes

       Bytes +   Count 1   Count 2  Type
        60,192       498     1,182  System.Reflection.RuntimeParameterInfo
        26,520       785     1,040  System.Reflection.RuntimeMethodInfo
        22,462     2,178     3,199  System.String
After 20,000 requests the heap went from 1.1 MB to 1.35 MB, and the report has not a single ShippingEmailHandler or EventHandler<OrderShippedEventArgs>. p95 stayed flat at 0.66-0.78 ms across all four batches. The remaining growth of a few tens of KB (reflection types, strings) may be framework internals that fill up on first calls; a fourth snapshot would tell whether that keeps growing too. This is the rule of proof: measure again under the same load after the fix and show that the growing row is gone.
Unsubscribing in Dispose is the smallest fix for this code, but the design is still fragile: if someone writes a new handler and forgets IDisposable, the leak comes back. The sturdier way is for the singleton publisher never to hold scoped handlers at all, resolving them from the current scope at publish time (for example as IEnumerable<IOrderShippedHandler>), or using a message queue instead of an event.
Common Leak Patterns
The pattern in this case is not the only one. The ones I run into most often in production, and how they show up in a diff:
- Event subscription: a short-lived subscriber on a long-lived publisher. Your subscriber type and
EventHandlergrow together in the diff. The mechanics are in the "Events in C#: EventHandler, Safe Raising and Subscription Leaks" post of the Advanced C# series. - A cache without a size limit: adding to
IMemoryCacheor a staticDictionarywith every distinct key. Your cache entry type and values grow in the diff. The "IMemoryCache in Depth: SizeLimit, Eviction, Change Tokens and the Hidden Stampede in GetOrCreate" post of the Caching series coversSizeLimit. - Captive dependency: a singleton taking and holding a scoped or transient service in its constructor. This case's cousin in DI; in the "Dependency Injection Basics in C#: Lifetimes, the Container and Captive Dependencies" post of the Advanced C# series.
- A timer that is never disposed: a running
Timeris held by the runtime's timer queue, and its callback holds the target object. If thedotnet.timer.countmetric from 02 keeps rising, look here. - An unbounded
Channelor queue: if the producer is faster than the consumer,Channel.CreateUnboundedpiles everything up in between. WithCreateBoundedthe capacity and what happens when it is full (wait, drop the oldest) must be chosen explicitly. - An
HttpClientper request: it looks small on the managed heap, but sockets and connections pile up; in the "How TCP Works: 3-Way Handshake, Congestion Control and HttpClient Socket Exhaustion" post of the Networking and HTTP series.
A Hint for Native Leaks
Not every memory growth is in the managed heap. If in dotnet-counters dotnet.process.memory.working_set rises while dotnet.gc.last_collection.heap.size and memory.committed_size stay put, what grows is outside the GC: a native library, unmanaged resources that are never disposed (SafeHandle, native buffers), pinned memory, or something that keeps generating new code (like the Regex compiled on every request in 03). In that case a gcdump shows you nothing, because it sees only the managed heap. The next step is a full dump and native memory tools: on Windows, VMMap and native heap tracing with WPR/WPA; on Linux, opening the dump with dotnet-dump analyze and looking at memory regions with commands such as maddress. The dump side is detailed in post 09 of the Debugging series as well.
In Production
A gcdump is cheap but not free. The gen2 GC it triggers gets longer as the heap grows; here it took 18.6 ms at 348 MB, on a heap of a few GB it can be hundreds of milliseconds, and every request waits during that time. The event buffer can grow up to 256 MB in the target process; in a container running close to its memory limit, the gcdump itself can cause an OOM kill. If possible, drain the instance from the load balancer first, and take the snapshots at the same load level, leaving enough time between them for a difference to build up.
A gcdump has no values, but it does have type names, counts and the reference structure, which reveal things about the system's internals. Put the files under the same access rules as dumps. Once the leak is confirmed, the best alarm is a metric: if the gen2 value of dotnet.gc.last_collection.heap.size keeps climbing for hours under the same load, it is time for a snapshot. In 08 we will see how to automate that with a collection rule.
Common Pitfalls
- Hunting a leak with a single snapshot: a single snapshot tells you what is big, not what grows.
- Taking the first snapshot before warm-up: caches, connection pools and lazy fields grow at startup and pollute the diff.
- Taking the first column of
dotnet-gcdump reportfor the type's total; it fooled me once while preparing this post. - Declaring the biggest byte row guilty: the fix was not the buffer but the handler holding it.
- Taking gcdumps back to back on a large heap without accounting for the gen2 GC's pause.
- "Proving" the fix with a code review: without a third snapshot under the same load you cannot know the leak is gone.
A Small Experiment
★☆☆ Send three batches of 5,000 requests to the leaking version of the lab, take a gcdump after each batch and show with the diff script that ShippingEmailHandler grows one-for-one with the requests. On Windows, open the same two files in Visual Studio and try the baseline comparison.
★★☆ Replace OrderEvents with a publisher that resolves handlers as IEnumerable<IOrderShippedHandler> from a scope opened with IServiceScopeFactory at publish time. Show with a diff that nothing leaks, and with p95 that the cost of publishing no longer depends on the number of subscribers.
★★★ Add a background service to the lab that uses Channel.CreateUnbounded<OrderShippedEventArgs>() and whose consumer waits 10 ms per message. Find the leak first in dotnet-counters, then with two gcdumps; fix it with CreateBounded and BoundedChannelFullMode.DropOldest and prove it with a third snapshot.
In this post we took snapshots by hand from the command line and multiplied a table with a script. The next post moves to the most comprehensive tool for the same jobs on Windows: GC Stats, JIT Stats, grouping/folding and comparing two traces with PerfView.