

The .NET Diagnostics Map: Which Tool for Which Question? EventPipe, Diagnostic Ports and Safe Collection
Tool choice starts from the question: dotnet-counters for whether something is wrong, dotnet-trace for where time goes, dotnet-gcdump for what stays in memory, dotnet-dump for the full process state. We measure the EventPipe vs ETW vs user_events difference, the diagnostic port's TMPDIR and user rules, sidecars in containers, installing with dnx and a tool manifest, and the real overhead and file size of a trace in the Bookstore lab.
Version note: The code in this post was built and run with .NET 10 (runtime 10.0.15 in the container), dotnet-counters, dotnet-trace and dotnet-gcdump 10.0.750501, with k6 2.4.0 generating load.
Guess First
Bookstore.Api's search endpoint answers about 1,450 requests per second in a container with 4 CPUs. While the load runs, you start dotnet-trace with no options except --duration, for 23 seconds. How many MB is the resulting .nettrace file: 2, 20 or 200? What changes if you record the same window with the gc-verbose profile, which turns on GC events and allocation sampling? And one more: how much does the recording slow the service down? The answers are in the measurement table in the middle of the post; the second one is not what most people expect.
Four Questions, Four Tools
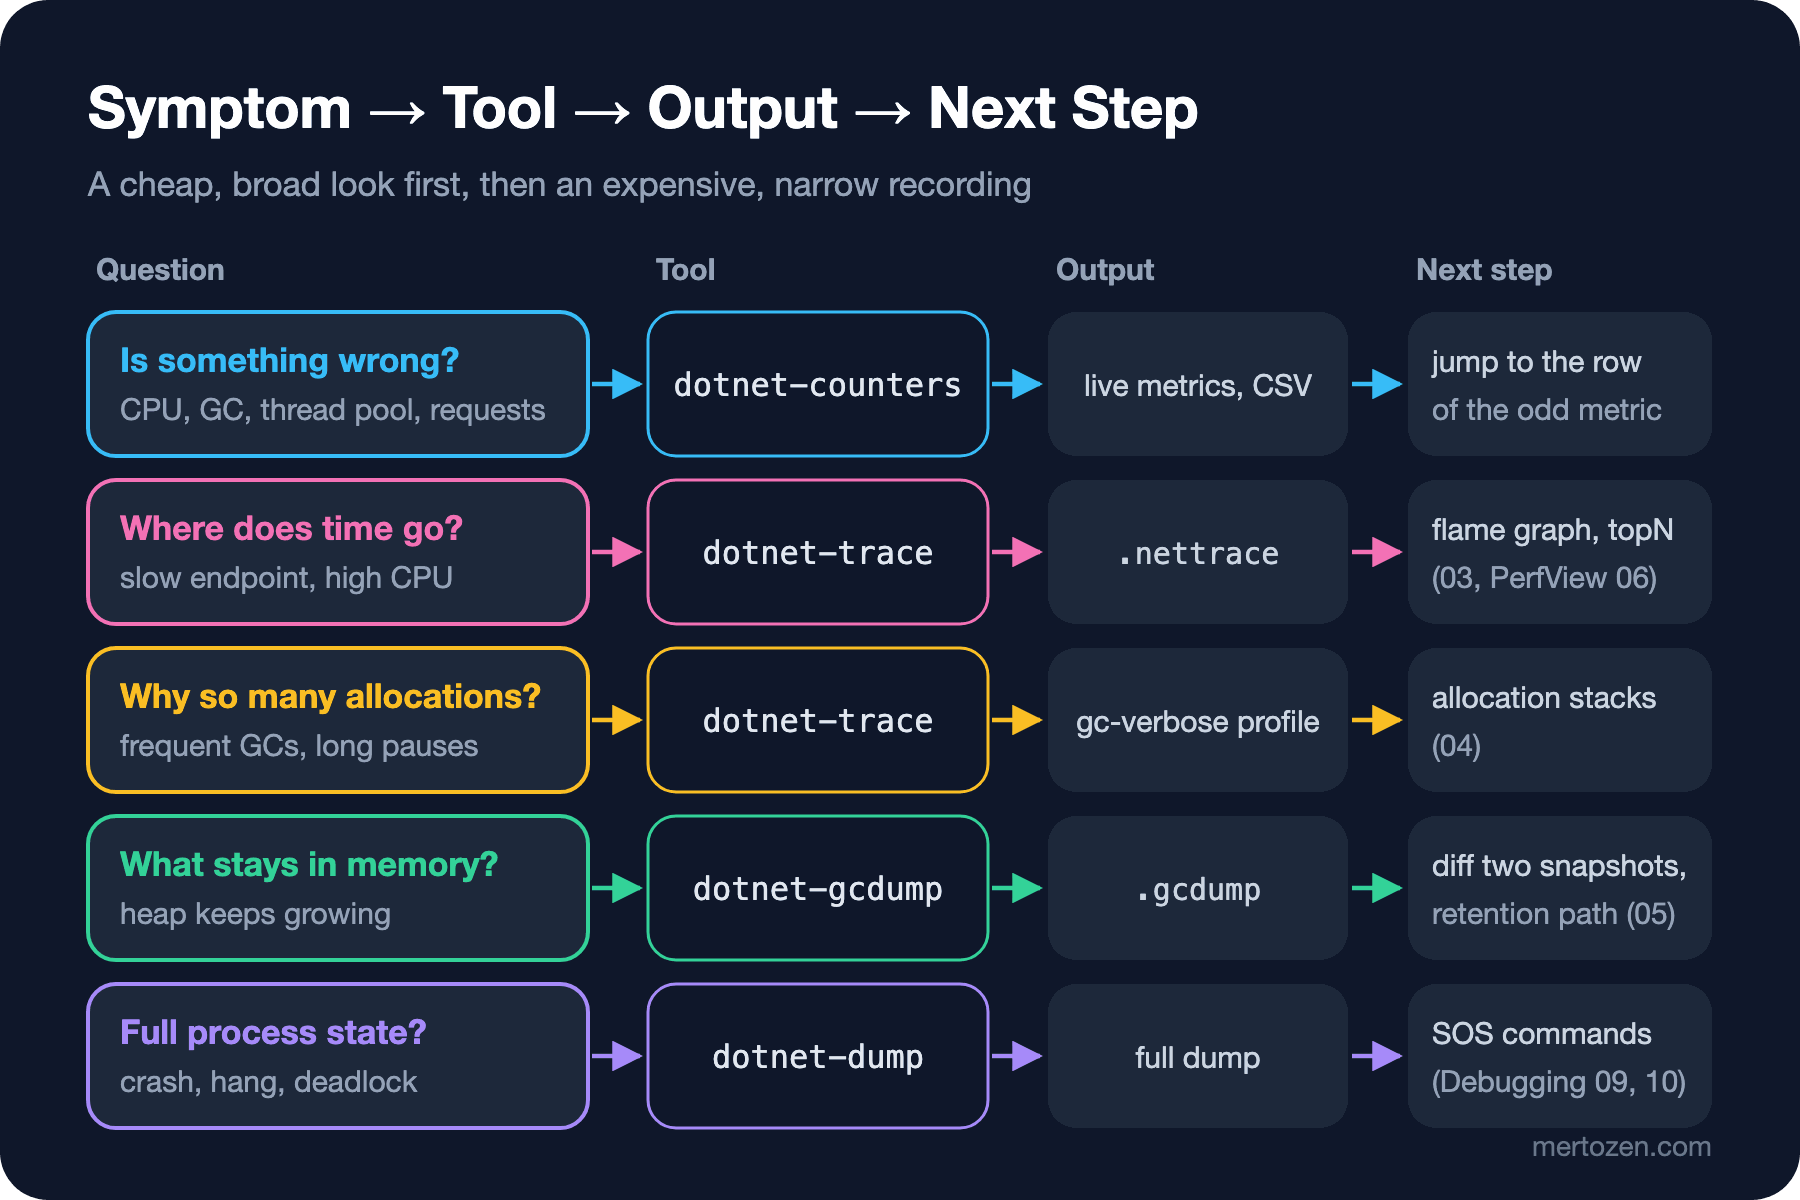
Someone who arrives with "the service is slow" or "memory keeps growing" usually opens the first tool that comes to mind. The most expensive mistake I have seen is exactly that: opening a profiler without looking at the symptom, studying flame graphs for two hours and only later noticing the problem was GC pauses. Tool choice should start from the question you are asking, not from the symptom. The .NET command-line diagnostics tools are split so that each answers one question:
| Question | Tool | What it gives you | Cost |
|---|---|---|---|
| Is something wrong, and where? | dotnet-counters | Per-second metrics: CPU, GC, thread pool, request duration | Very low, can stay on for hours |
| Where does the time go? | dotnet-trace | Stack samples and runtime events (.nettrace) | Low to medium; the file grows fast |
| What stays in memory? | dotnet-gcdump | Type statistics and the reference graph of managed heap objects | Triggers a full gen2 GC |
| What is the complete process state? | dotnet-dump | All memory, threads, stacks | Large file, a short freeze, sensitive data |
| What happens at the line of code? | Visual Studio and Rider profilers | Visual CPU, allocation, database and async analysis | Comfortable on a dev machine, not in production |
The order is always the same: a cheap, broad look first (counters), then an expensive, narrow recording (trace, gcdump, dump). Dump analysis with dotnet-dump and SOS debugger extension commands was covered in the "Analyzing Crash and Memory Dumps" post of the Debugging and Problem Solving series, and hang and thread pool starvation diagnosis in the "Diagnosing Hangs and Slowness" post of the same series; this series does not repeat them. IDE profilers come in post 07 and PerfView in 06.
The Plumbing: EventPipe, ETW and user_events on Linux
dotnet-counters, dotnet-trace and dotnet-gcdump all use the same runtime component: EventPipe. EventPipe is a tracing mechanism built into the runtime. It collects the events produced by the JIT compiler, the GC and the thread pool, plus whatever your EventSources and Meters publish, and streams them in the .nettrace format to a file or to a tool. Because it is part of the runtime, it works the same way on Windows, Linux and macOS and needs no admin rights.
The price is scope: EventPipe only sees managed code and the runtime. There are no native frames in the stacks, no kernel events, no other processes. For those you need the operating system's own tracing: ETW on Windows, perf_events on Linux. Both require elevated rights. PerfView (06) and the Visual Studio profiler use ETW on Windows, which is why they can see native frames and the kernel side too.
.NET 10 adds a middle ground on Linux: EventPipe can write its events to the kernel's user_events mechanism. dotnet-trace's collect-linux command uses it; managed events, native stacks and kernel events end up in a single trace, and all processes on the machine can be traced at once. The requirements are heavy: kernel 6.4 or later with CONFIG_USER_EVENTS support, root, the .NET 10 runtime and glibc 2.27 or later (of the distros .NET 10 supports, only Alpine 3.22 misses this). The kernel in the Docker environment I used for this post was 6.12 but was built without user_events, so checking the kernel version is not enough; you also have to check that the feature is enabled. Details in 03.
The Diagnostic Port: How Does a Tool Find the Process?
The channel the tools use to talk to a process is called the diagnostic port. When the runtime starts, it opens an IPC endpoint: a named pipe called \\.\pipe\dotnet-diagnostic-{pid} on Windows, and a Unix domain socket in the TMPDIR folder (/tmp if unset) on Linux and macOS. The tools connect to that endpoint and send commands such as "open an EventPipe session with these providers", "dump the GC heap" or "take a dump".
To keep it close to production, I run the Bookstore lab we will use throughout the series in a Linux container. Docker Desktop on Windows also runs Linux containers, so the same commands apply there. I install the tools in the image so that they get copied into the SDK-less runtime layer:
FROM mcr.microsoft.com/dotnet/sdk:10.0 AS build
WORKDIR /src
COPY Bookstore.Api/Bookstore.Api.csproj Bookstore.Api/
RUN dotnet restore Bookstore.Api/Bookstore.Api.csproj
COPY Bookstore.Api/ Bookstore.Api/
RUN dotnet publish Bookstore.Api/Bookstore.Api.csproj -c Release -o /app --no-restore
RUN for tool in dotnet-counters dotnet-trace dotnet-gcdump; do \
        dotnet tool install $tool --version 10.0.750501 --tool-path /tools; \
    done

FROM mcr.microsoft.com/dotnet/aspnet:10.0
WORKDIR /app
COPY --from=build /app .
COPY --from=build /tools /tools
ENV PATH="$PATH:/tools"
USER $APP_UID
ENTRYPOINT ["dotnet", "Bookstore.Api.dll"]
docker build -t profseries-api:lab .
docker run -d --name profseries-api --cpus 4 --memory 2g -p 5481:8080 profseries-api:lab
docker exec profseries-api dotnet-counters ps
docker exec profseries-api ls -la /tmp 1 dotnet /usr/share/dotnet/dotnet dotnet Bookstore.Api.dll
drwxrwxrwt 1 root root 4096 Nov 13 23:25 .
drwxr-xr-x 1 root root 4096 Nov 13 23:25 ..
prwx------ 1 app app 0 Nov 13 23:25 clr-debug-pipe-1-891387-in
prwx------ 1 app app 0 Nov 13 23:25 clr-debug-pipe-1-891387-out
srw------- 1 app app 0 Nov 13 23:25 dotnet-diagnostic-1-891387-socketThe socket name follows the dotnet-diagnostic-{pid}-{disambiguation-key}-socket pattern; the middle number is derived from the process start time so that a reused PID never gets confused with an old socket. Note the permissions: srw-------, meaning only the owner, the app user, can read and write it. These two details are the source of the two most common errors the tools give.
The first is a different TMPDIR. The tool looks for the socket in its own TMPDIR; if that differs from the app's, it cannot see the process at all:
docker exec -e TMPDIR=/var/tmp profseries-api dotnet-counters ps
docker exec -e TMPDIR=/var/tmp profseries-api dotnet-trace collect -p 1 --duration 00:00:00:02
No supported .NET processes were found
[ERROR] Microsoft.Diagnostics.NETCore.Client.ServerNotAvailableException: Unable to connect to Process 1. Please verify that /var/tmp/ is writable by the current user. If the target process is in a different container, ensure this process runs with 'pid: host' and has access to /proc/{pid}/root/ (requires CAP_SYS_PTRACE or privileged mode). Please see https://aka.ms/dotnet-diagnostics-port for more information.The second is a different user. The process shows up in the list, because /proc is enough to find the PID, but connecting to the socket needs permission:
docker exec -u 1000 profseries-api dotnet-trace collect -p 1 --duration 00:00:00:02[ERROR] Microsoft.Diagnostics.NETCore.Client.ServerNotAvailableException: Unable to connect to the server. Permission denied
---> System.Net.Sockets.SocketException (13): Permission deniedRunning the same command as root with -u 0 collected the trace without trouble. The rule is simple: the tool must run as the user that started the app, or as root. Windows has no TMPDIR issue, the named pipe name depends only on the PID, but the user rule applies there too.
In Containers: The Same PID Namespace, the Same /tmp
When you enter the app's container with docker exec or kubectl exec, both are already shared. If you do not want the tools in the app image, you can run them from a separate container (a sidecar); then the sidecar has to see two things: the app's process (a shared PID namespace) and the socket file (a shared /tmp). I restarted the app with /tmp on a volume and tried it:
docker run -d --name profseries-api --cpus 4 --memory 2g -p 5481:8080 \
    -v profseries-diag:/tmp profseries-api:lab

# volume only: the socket file is visible but the process is not
docker run --rm -v profseries-diag:/tmp --entrypoint dotnet-counters profseries-api:lab ps

# volume + PID namespace: together they are enough
docker run --rm -v profseries-diag:/tmp --pid container:profseries-api \
    --entrypoint dotnet-counters profseries-api:lab ps
No supported .NET processes were found
1 dotnet /usr/share/dotnet/dotnet dotnet Bookstore.Api.dllSharing only the PID namespace was not enough either: with --pid container:profseries-api but no volume, the tool could not find the process even as root with the SYS_PTRACE capability. The Kubernetes equivalent is shareProcessNamespace on the pod plus an emptyDir volume mounted into both containers. The durable solution, a dotnet-monitor sidecar and a fixed port through DOTNET_DiagnosticPorts, is the topic of post 08 in this series; the pod side is detailed in post 09 of the Kubernetes series.
There is also a setting in the opposite direction: a process started with DOTNET_EnableDiagnostics=0 opens no diagnostic port and accepts no debugger. I tried it; /tmp stayed empty and dotnet-counters ps said "No supported .NET processes were found". In an environment where you do not trust the same user on the same machine, that can be the right choice, but none of the tools in this post work on that process; know what you give up during an incident before you ship it to production.
Installing the Tools: Global Tool, dnx, Manifest and SDK-less Images
There are four ways, and the right one depends on where you run.
A global tool (dotnet tool install --global dotnet-trace) is the most convenient on a developer machine, but versions drift across the team. For a one-off job there is dnx, which ships with the .NET 10 SDK: it downloads and runs the tool without installing it. I started the lab app in the SDK image and tried it:
dnx dotnet-counters@10.0.750501 ps 8 dotnet /usr/share/dotnet/dotnet dotnet Bookstore.Api.dll
135 dotnet /usr/share/dotnet/dotnet exec /usr/share/dotnet/sdk/10.0.404/dotnet.dll dnx dotnet-counters@10.0.750501 psThe second line is dnx itself: it is a .NET process too. When you pick a PID by hand, check the command-line column so you do not end up tracing the tool. Pinning the version with @10.0.750501 is a good habit as well; without it, dnx fetches the latest version every time.
To make the whole team use the same version, a tool manifest in the repo is better:
dotnet new tool-manifest
dotnet tool install dotnet-trace --version 10.0.750501
dotnet tool install dotnet-counters --version 10.0.750501
dotnet tool restore
dotnet dotnet-trace --version
{
"version": 1,
"isRoot": true,
"tools": {
"dotnet-trace": {
"version": "10.0.750501",
"commands": [
"dotnet-trace"
],
"rollForward": false
},
"dotnet-counters": {
"version": "10.0.750501",
"commands": [
"dotnet-counters"
],
"rollForward": false
}
}
}The .NET 10 SDK created the manifest as dotnet-tools.json in the current folder. Starting with .NET 10, dotnet tool install also creates the manifest itself when it cannot find one; you get the same file even if you skip the first command, which I checked separately in an empty folder. With this file committed to the repo, the CI machine and every developer get the same version through dotnet tool restore. The last way is for SDK-less images: install with --tool-path in the build stage and copy into the runtime image, as in the Dockerfile above, or use the executables Microsoft publishes for direct download on each platform (such as https://aka.ms/dotnet-trace/win-x64 for Windows x64). The version installed with tool-path is framework-dependent; it uses the runtime in the image, so nothing extra was needed in the aspnet image.
The Bookstore Lab: The Series' Deliberate Bugs
We will use the same app throughout the series. There is no database; the catalog and the orders live in memory, so what we measure is only our own code. Each post has its own deliberate bug:
using Bookstore.Api.Catalog;
using Bookstore.Api.Ordering;
using Bookstore.Api.Reports;
using Bookstore.Api.Shipping;

WebApplicationBuilder builder = WebApplication.CreateBuilder(args);

builder.Services.AddSingleton<CatalogStore>();
builder.Services.AddSingleton<OrderStore>();
builder.Services.AddSingleton<OrderingMetrics>();
builder.Services.AddSingleton<OrderEvents>();
builder.Services.AddScoped<ShippingEmailHandler>();

WebApplication app = builder.Build();

app.MapGet("/health", () => Results.Ok("ok"));
app.MapOrderEndpoints();     // 02: metrics
app.MapSearchEndpoints();    // 03: CPU
app.MapReportEndpoints();    // 04: allocation and LOH
app.MapShippingEndpoints();  // 05: memory leak

app.Run();
POST /api/orders(02): our ownMeter; an order count and a payment duration histogram.GET /api/books/search(03): aRegexcompiled on every request and a 787 KB JSON response for 50 books; the-v2version of the same query returns 4 KB.GET /api/reports/orders.csv(04): a CSV export that builds 200,000 orders first in aStringBuilder, then in abyte[]; Large Object Heap pressure.POST /api/orders/{id}/ship(05): a scoped handler that subscribes to a singleton event and never unsubscribes; a growing heap.
The posts after 06 add their own cases to this app: an Entity Framework Core N+1 query (07) and an end-to-end performance case in checkout (09).
Overhead and Safe Collection
Here is the answer to the guessing question. I put a 20-second k6 load with 20 virtual users on the search endpoint and measured three rounds: first without tools, then while tracing with the default profiles, then with gc-verbose:
docker exec -d profseries-api dotnet-trace collect -p 1 --duration 00:00:00:23 -o /tmp/r1-default.nettrace
docker exec -d profseries-api dotnet-trace collect -p 1 --profile gc-verbose --duration 00:00:00:23 -o /tmp/r1-gcv.nettrace| Condition | Requests/s (3 rounds) | p95 (ms) | 23 s file |
|---|---|---|---|
| No tool | 1,518 / 1,431 / 1,480 | 18.6 / 19.9 / 18.8 | - |
Default (dotnet-common + dotnet-sampled-thread-time) | 1,320 / 1,467 / 1,460 | 22.9 / 19.3 / 18.5 | 20-22 MB |
gc-verbose | 1,267 / 1,432 / 1,514 | 23.4 / 21.1 / 18.2 | 197-234 MB |
In the first round the difference is clear: the default profiles cut throughput by 13 percent, gc-verbose by 17 percent, and p95 went from 18.6 ms to 23 ms. In the second and third rounds, though, the difference stayed inside the round-to-round variation (around 5 percent); in the third round the service was even faster with gc-verbose on than without any tool. So on this endpoint the cost of tracing is "sometimes noticeable, mostly unmeasurable". The real difference is the file: gc-verbose wrote about 9 MB per second, ten times the default. There is no fixed overhead percentage; it depends on how much your endpoint allocates and how many threads run. Do not promise that "tracing does not slow production down" before you have run the same A/B measurement (same load, with and without the tool) on your own service once.
The rules for safe collection follow from these numbers. Bound every recording in time (--duration); a session someone forgot to stop with Enter fills the disk. Check the free space where the file goes beforehand; a container's writable layer is usually small. If event production outruns the disk, the runtime buffer (256 MB by default, --buffersize) fills and events are dropped; the trace has gaps, but the app does not stop. The --buffering-mode Block option, which changes this default, requires a .NET 11 runtime (last post). dotnet-gcdump should be used with care: it triggers a full gen2 GC to walk the heap, and on a large heap that means a long pause during which every request waits (05).
In Production
Trace and dump files are not harmless log files. A gcdump carries the object graph and type names, and a full dump carries everything in memory: connection strings, tokens, a customer's email address. Decide who takes these files, where they get copied and how long they are kept beforehand, not during the incident. Access to the diagnostic port means the right to read the whole state of the process and change its behavior; anyone with exec rights on the container has it. Look at the pods/exec RBAC permission in Kubernetes with that in mind.
The order matters in production too. Keep dotnet-counters on as long as you like. Take dotnet-trace briefly and with a target: the default profiles first, gc-verbose if the problem is allocation. Prefer taking gcdumps and dumps on an instance that has been drained from the load balancer. Never try a tool for the first time during an incident; run the commands, permissions and file paths once on a calm day in staging and write them down.
Common Pitfalls
- Tracing an app started with
dotnet run:dotnet runfirst starts separate processes that run the SDK and the build, so picking the wrong PID from thepslist is easy. Measure withdotnet bin/Release/net10.0/Bookstore.Api.dllor the publish output. - Profiling a Debug build: optimizations are off, and the hot spots you see may not exist in Release at all. Every measurement in this series is Release.
- Running the tool as a different user or with a different
TMPDIRand then chasing the "process not found" error. - Attaching to a 32-bit app with a 64-bit tool (on Windows, x86 apps need the x86 tool).
- Starting a trace without
--durationand closing the terminal, or forgetting the file stays inside the container; delete the container beforedocker cpand the recording is gone. - Tracing while the app crashes with an unhandled exception: the recording gets cut off, and without the rundown information at the end, stacks may not resolve. The right tool for a crash is a dump.
A Small Experiment
★☆☆ Start the lab on your machine with dotnet bin/Release/net10.0/Bookstore.Api.dll and compare the output of dotnet-counters ps, dotnet-trace ps and dotnet-gcdump ps. On Windows, find the named pipe in PowerShell with Get-ChildItem \\.\pipe\ | Where-Object Name -like 'dotnet-diagnostic*' and match the PID in its name with the PID in the list.
★★☆ Put the same load on your own service three times without tools and three times with dotnet-trace collect --duration 00:00:00:20. Check whether the difference between rounds is bigger or smaller than the difference between with and without the tool; divide the file size by the seconds and compare it with the free space on your disk.
★★★ Start the app without the /tmp volume and try connecting from a sidecar; then make the app connect to a socket in the sidecar with DOTNET_DiagnosticPorts and accept it with dotnet-counters collect --diagnostic-port. Note which side listens and which side connects.
In the next post we start with the tool on the first row: we will read the System.Runtime Meter and the ASP.NET Core and Kestrel metrics with dotnet-counters, add our own Meter to Bookstore's order flow and record a baseline under k6 load.