

CPU Profiling: Reading Flame Graphs with dotnet-trace, Sampled Thread Time and collect-linux on Linux

dotnet-trace's default profile samples wall-clock time, not CPU, so waiting threads top the topN list and you find the hot spot in a flame graph by looking at request threads. In Bookstore's search endpoint we find a Regex compiled on every request in speedscope, fix it with [GeneratedRegex] and a projection, cut CPU per request from 1.87 ms to 0.07 ms, and show collect-linux's requirements with real errors.
Version note: The code in this post was built and run with .NET 10 (runtime 10.0.15 in the container), dotnet-trace and dotnet-counters 10.0.750501, with k6 2.4.0 generating load and Microsoft.Diagnostics.Tracing.TraceEvent 3.2.8 used to count samples.
Guess First
In the previous post, the metrics showed that in a warmed-up Bookstore service the JIT was compiling hundreds of methods per second. The suspect endpoint is clear: /api/books/search. You take a 15-second trace under load and list the most expensive methods with dotnet-trace report. What do you expect at the top of the list: Regex, JSON serialization, or something else entirely? And think about this too: which fix multiplies this endpoint's throughput by 23, fixing the code that eats the CPU, or something else?
The Default Profiles: What Gets Sampled Is Wall-Clock Time, Not CPU
When you run dotnet-trace without a profile, two profiles are enabled: dotnet-common (lightweight runtime events such as GC, JIT, assembly loading and exceptions) and dotnet-sampled-thread-time. The second is the heart of it: at regular intervals the runtime pauses all managed threads and records each one's stack. The important detail is that a sample is taken whether the thread is running on a CPU or waiting on a lock, a semaphore or I/O. So this is not a CPU profile, it is a profile of where threads spend their time.
In older versions the profile doing this was called cpu-sampling, and that is exactly why it was removed from the collect command: because it also counted threads not using the CPU, the name was misleading. The closest equivalent of the old behavior is --profile dotnet-sampled-thread-time,dotnet-common. The name cpu-sampling now exists only in collect-linux, where it really means the kernel's CPU sampling.
You will see two different numbers for the sampling rate: the dotnet-trace page on Microsoft Learn says about 1000 Hz, the tool's own list-profiles output says about 100 Hz. I counted the sample events in the trace with TraceEvent: in this container I got 499 samples per thread per second when idle and 403 under load. Do not assume an exact rate; in analysis, look at percentages rather than absolute times. If you need to change the rate, .NET 10.0.10 and later have the DOTNET_EventPipeThreadSamplingRate environment variable (in milliseconds); it is process-wide.
The Case: The Search Endpoint
The lab's search endpoint combines two bugs I have seen in real projects:
// slow version: a Regex compiled on every request and the full entity graph in the response
app.MapGet("/api/books/search", (string q, CatalogStore store) =>
{
    Regex separator = new(@"[^\p{L}\p{N}]+", RegexOptions.Compiled);
    string[] terms = separator.Split(q).Where(t => t.Length > 0).ToArray();

    List<Book> hits = store.Books
        .Where(b => terms.All(t => b.Title.Contains(t, StringComparison.OrdinalIgnoreCase)))
        .Take(50)
        .ToList();

    return Results.Ok(hits);
});
Book is a record that carries its author (with a 2,000-character biography) and 30 reviews. The UI shows only the title, author name and price, but the response contains everything about 50 books: 787 KB. RegexOptions.Compiled compiles the pattern to IL and generates new methods at run time; done once, that is fast, done on every request, it is a disaster.
I took a trace under a k6 load with 20 virtual users:
docker exec profseries-api dotnet-trace collect -p 1 --duration 00:00:00:15 -o /tmp/search-before.nettrace
docker cp profseries-api:/tmp/search-before.nettrace .
dotnet-trace report search-before.nettrace topN -n 12 --inclusive
Top 12 Functions (Inclusive) Inclusive Exclusive
1. (Non-Activities) 100% 0%
2. Threads 100% 0%
3. Thread.StartCallback() 80.97% 0%
4. PortableThreadPool+WorkerThread.WorkerThreadStart() 36.51% 0.02%
5. LowLevelLifoSemaphore.Wait(int32,bool) 19.16% 0.07%
6. WaitHandle.WaitOneNoCheck(int32,bool,class System.Object,value class W 19.06% 19.06%
7. LowLevelLifoSemaphore.WaitForSignal(int32) 18.97% 18.93%
8. ThreadPoolWorkQueue.Dispatch() 17.31% 0%
9. ExecutionContext.RunFromThreadPoolDispatchLoop(class System.Threading. 14.29% 0%
10. Monitor.Wait(class System.Object,int32) 12.7% 12.7%
11. ManualResetEventSlim.Wait(int32,value class System.Threading.Cancellat 12.7% 6.35%
12. Missing Symbol 12.24% 12.18%The first answer to the guessing question: there is neither Regex nor JSON at the top of the list. Waiting threads take the top spots: thread pool workers waiting for work (LowLevelLifoSemaphore.WaitForSignal), timer and logging threads (Monitor.Wait). With wall-clock sampling every idle thread accumulates time too. This list tells you "this process's threads spend a fifth of their time waiting for work"; it does not answer "what eats the CPU".
Reading a Flame Graph: speedscope and Chromium
For the real analysis you have to open the trace in a visual tool. On Windows, Visual Studio or PerfView open a .nettrace directly (06 and 07). The platform-independent way is converting the trace to the speedscope or Chromium format:
dotnet-trace convert search-before.nettrace --format Speedscope -o search-before
dotnet-trace convert search-before.nettrace --format Chromium -o search-before
Processing trace data file 'search-before.nettrace' to create a new Speedscope file 'search-before.speedscope.json'.
Conversion completeYou load search-before.speedscope.json into speedscope.app in the browser and the .chromium.json into the Performance panel of Chrome DevTools. The conversion is one-way; keep the original .nettrace. In speedscope each thread is a separate profile; the "Left Heavy" view merges identical stacks and puts the widest on the left. Three rules are enough to read a flame graph: width is the frame's share of total time, the vertical axis is call depth (the lower frame calls, the upper one is called), and colors mean nothing. dotnet-trace's speedscope output adds two pseudo-frames on top of every stack: CPU_TIME (the thread was running managed code) and UNMANAGED_CODE_TIME (in native code or waiting). These two are where you look to filter out waiting threads.
The difference between inclusive and exclusive matters here too. Inclusive time is the method plus everything it calls; exclusive time is only what is spent in the method's own body. dotnet-trace report sorts by exclusive by default; with --inclusive you see the methods higher up the call tree. If the handler's inclusive time is high and its exclusive time low, the time is in something it calls.
Focusing on the request threads changed the picture. I split the busy time (the samples that were not waiting) under Kestrel's HttpProtocol.ProcessRequests frame into components:
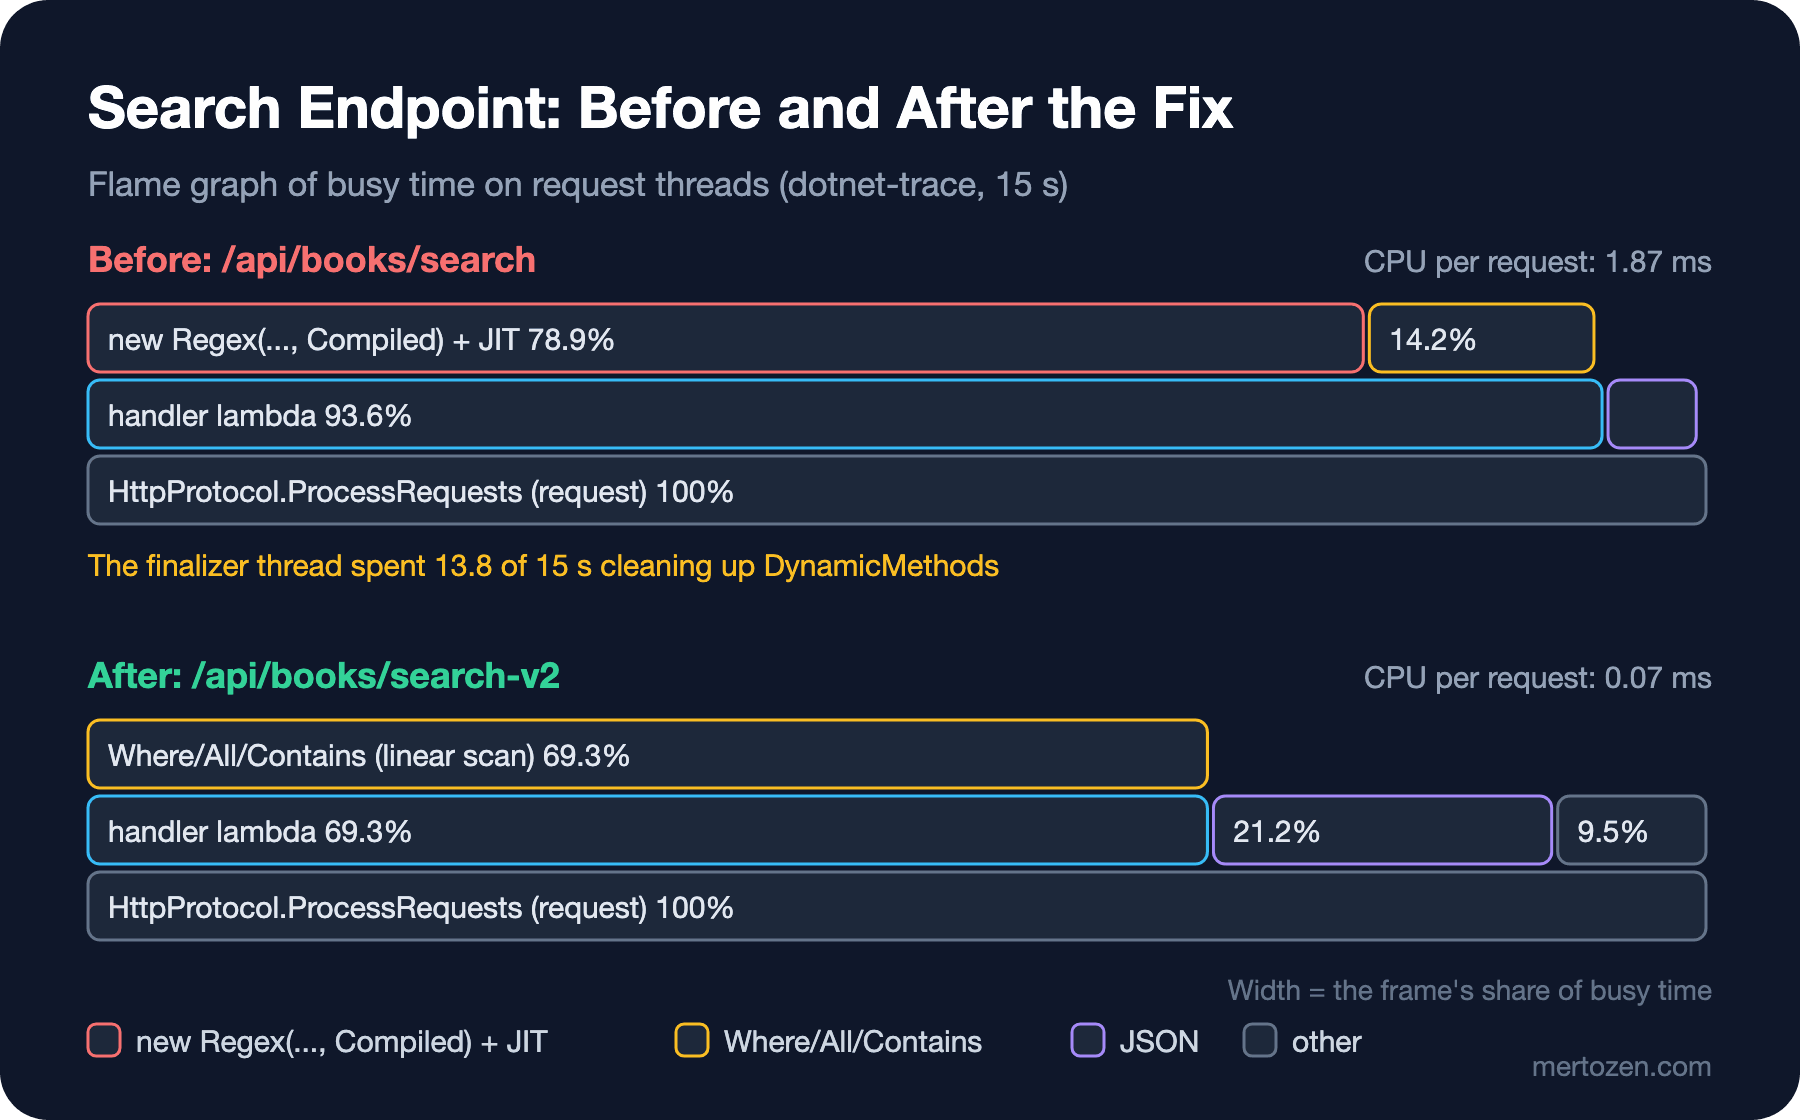
78.9 percent of the request time is in Regex. The interesting part is where: the Regex constructor is only 0.7 seconds; the other 18 seconds are in compiled methods with names such as dynamicClass.Regex575014_Scan. Because each request compiles a new Regex, each request gives birth to a new Scan method, which goes to the JIT on its first call. In the 15-second trace I counted 6,469 distinct RegexNNN_Scan names. This is also why topN never showed it: the time is split across thousands of different names, so none of them makes the list on its own. In a flame graph, on the other hand, it stands out right away as a wide comb of thin lines on top of the handler.
There is also a surprise outside the requests: the finalizer thread spent 13.8 of the 15 seconds in DynamicResolver+DestroyScout.Finalize(), cleaning up discarded dynamic methods. A single thread going almost entirely to this work means memory will grow too if cleanup cannot keep up with production.
The Fix: [GeneratedRegex] and a Projection
public sealed record BookSearchResult(int Id, string Title, string AuthorName, decimal Price);

public static partial class SearchEndpoints
{
    [GeneratedRegex(@"[^\p{L}\p{N}]+")]
    private static partial Regex TermSeparator();

    public static void MapSearchEndpoints(this IEndpointRouteBuilder app)
    {
        // fixed version: source-generated Regex and only the fields the client needs
        app.MapGet("/api/books/search-v2", (string q, CatalogStore store) =>
        {
            string[] terms = TermSeparator().Split(q).Where(t => t.Length > 0).ToArray();

            List<BookSearchResult> hits = store.Books
                .Where(b => terms.All(t => b.Title.Contains(t, StringComparison.OrdinalIgnoreCase)))
                .Take(50)
                .Select(b => new BookSearchResult(b.Id, b.Title, b.Author.Name, b.Price))
                .ToList();

            return Results.Ok(hits);
        });
    }
}
[GeneratedRegex] turns the pattern into C# code at build time; there is no compilation or IL generation at run time, and the method has a real name in the trace (RegexGenerator_g...TermSeparator). A static readonly Regex field would also do; what matters is creating the Regex once. The projection takes the response from 787 KB down to 4 KB. To separate the effect of the two fixes I added an intermediate endpoint that fixes only the Regex and measured all three versions with the same load (20 virtual users, 20 seconds); CPU and JIT values come from a dotnet-counters recording taken at the same time:
| Version | Requests/s | p95 | Response | CPU per request | JIT (methods/s) |
|---|---|---|---|---|---|
search | 926 | 38.9 ms | 787 KB | 1.87 ms | ~1,870 |
| Regex fix only | 1,361 | 27.0 ms | 787 KB | 0.88 ms | ~10 |
search-v2 | 21,696 | 1.63 ms | 4 KB | 0.07 ms | ~3 |
Here is the second answer to the guessing question. The fix the profile pointed to (Regex) halved the CPU per request but raised throughput by only 47 percent. The 23x jump came from the projection. The reason: in the slow version only 1.7 of the container's 4 CPUs were in use; the bottleneck was not the CPU but 0.7-1.1 GB per second of response traffic. A sampled thread time profile cannot see that, because a request waiting for the socket to drain during an async write keeps no thread busy; there is no stack to sample. A flame graph tells you correctly where the CPU goes, but the whole answer to "why is it slow" may not be there. That is why you should always back a before/after comparison with an end-to-end measurement (p95, throughput) and resource usage.
In the profile of the fixed version there is no trace of Regex left (2 ms); 69 percent of request time is in Where/All/Contains scanning all 20,000 books, and 21 percent in JSON. The next improvement would be a search index, but for a 0.07 ms request I would only go there if the load really demanded it.
collect-linux on Linux
collect-linux, new in .NET 10, uses the kernel's perf_events and user_events instead of EventPipe. The gain: native frames (the JIT itself, the GC, native libraries) show up in stacks, real CPU sampling (cpu-sampling) and context switches (thread-time) can be recorded, and every process on the machine can be traced at once. It is the only way to open up the JIT time that appears as UNMANAGED_CODE_TIME in the case above. The requirements are heavy: kernel 6.4+ with CONFIG_USER_EVENTS, a mounted tracefs, root (CAP_PERFMON or CAP_SYS_ADMIN), the .NET 10 runtime, glibc 2.27+ (except Alpine 3.22). For native frame names you need to download the runtime's symbols with dotnet-symbol and place them next to the libraries.
You can first check whether the process supports this mode with --probe, which does not need root:
docker exec profseries-api dotnet-trace collect-linux --probeProbing .NET processes for support of the EventPipe UserEvents IPC command used by collect-linux. Requires runtime '10.0.0' or later.
.NET processes that support the command:
1 dotnet
.NET processes that do NOT support the command:The process may support it while the environment does not. When I tried as root in the lab container, the tool first said tracefs was not mounted; after mounting tracefs in a privileged container and trying again, it hit the second obstacle:
Error: Tracefs is not accessible: It appears tracefs is not mounted. You can mount it by running mount -t tracefs nodev /sys/kernel/tracing.

Error: User events are not accessible.
This environment's kernel is 6.12, but CONFIG_USER_EVENTS is not enabled. Before trying on a Linux server, check with zgrep CONFIG_USER_EVENTS /proc/config.gz or by looking for the /sys/kernel/tracing/user_events_data file. If you run in containers, this is a question of the node's kernel and the granted privileges, not the pod, so most of the time you will need to talk to the platform team. Windows already has the equivalent: PerfView and Visual Studio work over ETW and show native frames too.
In Production
Keep CPU traces short in production: 10-30 seconds, in the window where the problem happens. If the problem is intermittent, tie the trace to a trigger instead of leaving it on; that is what dotnet-monitor's collection rules are for (08). At the end of a trace the runtime sends the names and addresses of loaded methods in a phase called "rundown"; in a large app stopping can stretch from seconds to minutes, so do not kill the process meanwhile. A trace file carries method names and stacks; it is less likely than a dump to carry secrets, but not zero, especially if you enabled events with payloads through --providers.
Make sure what you measure is the problem you have in production. Here, under the load of 20 users generated with k6, the bottleneck was network traffic; in production the same endpoint may be called 50 times per second and your real issue may be the GC or the finalizer queue. A profile describes the load it was taken under.
Common Pitfalls
- Profiling a Debug build: inlining and optimizations are off, so the hot spots change. Always
-c Release. - Taking a short trace right after the app starts: with tiered compilation, methods are first compiled quickly without optimization and recompiled later, so the profile fills with JIT noise. Send a few thousand requests to warm up, then record.
- Taking sampled thread time for a CPU profile and reading the waiting methods at the top of the list as "hot spots".
- Trusting
topNand never looking at the flame graph: methods generated at run time split across thousands of names and vanish from the list. - Tracing while the app crashes with an unhandled exception: without the rundown, stacks may not resolve; PerfView can open such a trace with
/ContinueOnError, but the right tool for a crash is a dump. - Fixing only what the profile shows and not measuring end to end: in this case CPU halved, while the time users saw barely changed.
A Small Experiment
★☆☆ Put load on the lab's search endpoint, take a trace and open it in speedscope. In the "Left Heavy" view, find the comb shape on top of the handler; see with your own eyes that several RegexNNN_Scan names differ from each other.
★★☆ Write a version that drops RegexOptions.Compiled but still creates new Regex(...) on every request. Measure the cost of building an interpreted Regex per request with dotnet.jit.compiled_methods and CPU per request; note when Compiled hurts and when it pays off.
★★★ Replace the linear scan in search-v2 with a Dictionary<string, List<Book>> index built from title words. Compare the before/after flame graphs and p95; account for the index's build time and memory cost as well.
On the CPU side we saw how busy the finalizer thread was; in the next post we move to the other side of memory: we will tie allocations to stacks with gc-verbose and allocation sampling, fix a CSV export that fills the LOH with streaming and ArrayPool<T>, and look at Server GC and DATAS settings.