

What Is PostgreSQL? Architecture for SQL Server Developers: Processes, Shared Buffers, WAL and MVCC
PostgreSQL starts a separate operating system process for every connection, leaves most memory to the operating system cache and keeps old row versions inside the table rather than in a separate version store; most differences a SQL Server developer meets come from this. With real output: the postmaster and backends, the 53300 error after 97 connections, connection pooling, shared_buffers, WAL and checkpoints, MVCC through xmin/xmax, a concept map, licensing and the release schedule.
Version note: The examples in this post were run with PostgreSQL 18.7 (the official postgres:18 Docker image), .NET 10 and Npgsql 10.0.3.
Guess First
Bookstore, the online bookstore used as the shared example across this site's series, has been running on SQL Server for years. Licensing costs push the team to try PostgreSQL, and the first load test fills the API logs with an error nobody has seen before. To shrink the problem we write this code: connection pooling is off, the loop tries to open 120 connections and never closes any of them.
NpgsqlConnectionStringBuilder builder = new(connectionString) { Pooling = false };
await using NpgsqlDataSource dataSource = NpgsqlDataSource.Create(builder);

List<NpgsqlConnection> open = [];
try
{
    for (int i = 1; i <= 120; i++)
    {
        NpgsqlConnection connection = await dataSource.OpenConnectionAsync();
        open.Add(connection);
        if (i <= 3)
        {
            Console.WriteLine($"connection {i}: server process id {connection.ProcessID}");
        }
    }
}
catch (PostgresException ex)
{
    Console.WriteLine($"connection {open.Count + 1}: {ex.SqlState} {ex.MessageText}");
}
On SQL Server this loop finishes without complaint; with default settings it allows up to 32,767 user connections. What happens with PostgreSQL 18's defaults, and at which connection? And what does "server process id" in the output mean: is it the equivalent of a SQL Server session id, or a real operating system process?
connection 1: server process id 98
connection 2: server process id 99
connection 3: server process id 100
connection 98: 53300 remaining connection slots are reserved for roles with the SUPERUSER attribute
client backend processes on the server: 97
Connection 98 was rejected. max_connections defaults to 100; 3 of those slots (superuser_reserved_connections) are kept for superusers, so an ordinary application role can open at most 97 connections. The more important part is in the first lines: 98, 99 and 100 are not session numbers but the PIDs of operating system processes the server started for those connections. This post opens PostgreSQL up from exactly that point: the process model, memory, WAL and MVCC. We put each one next to its SQL Server counterpart, because most of the surprises a SQL Server developer meets in PostgreSQL come from these four topics.
Process per Connection: the postmaster and Backends
We don't need a permanent lab yet; we build one in post 02. A throwaway container is enough for this post. In PowerShell:
# Throwaway PostgreSQL 18; --rm removes it when it stops
$env:PG_LAB_PASSWORD = "<strong-password>"
docker run --rm -d --name pg-arch -e POSTGRES_PASSWORD=$env:PG_LAB_PASSWORD -p 5432:5432 postgres:18

# Processes inside the container
docker exec pg-arch ps -eo pid,ppid,cmd
PID PPID CMD
1 0 postgres
67 1 postgres: io worker 0
68 1 postgres: io worker 1
69 1 postgres: io worker 2
70 1 postgres: checkpointer
71 1 postgres: background writer
73 1 postgres: walwriter
74 1 postgres: autovacuum launcher
75 1 postgres: logical replication launcher
299 1 postgres: postgres postgres [local] SELECTPID 1 is the main process the documentation calls the postmaster. Its job is to listen on port 5432, authenticate each incoming connection and fork a new backend process for it. Process 299 on the last line is such a backend: it is connected to the postgres database as the postgres role and is running a SELECT right now. When the connection closes, the process exits. The lines in between are background processes that are always running:
checkpointer: periodically writes changed (dirty) pages from shared buffers to the data files and records a checkpoint.background writer: writes dirty pages ahead of time so backends don't have to write them themselves to find a free buffer.walwriter: flushes WAL buffers to disk at regular intervals.autovacuum launcher: checks which tables need cleaning and starts autovacuum workers when necessary.io worker: the default method of the asynchronous I/O subsystem introduced in PostgreSQL 18 (io_method = worker); these processes perform reads on behalf of backends, 3 of them by default.logical replication launcher: starts workers for logical replication subscriptions; it is idle here.
We run the loop with an ordinary application role, not a superuser. We create the role and set its password with \password, so the password never lands in the command history. The full code is in this post's snapshot under src/Bookstore.PgLab:
# Application role; psql prompts for the password
docker exec -it pg-arch psql -U postgres -c "CREATE ROLE bookstore_app LOGIN"
docker exec -it pg-arch psql -U postgres -c "\password bookstore_app"

$env:BOOKSTORE_PG = "Host=localhost;Port=5432;Database=postgres;Username=bookstore_app;Password=<app-password>"
dotnet run --project src/Bookstore.PgLab -- connections
dotnet run --project src/Bookstore.PgLab -- pool
You can see the same list from SQL. pg_stat_activity returns one row per process; think of it as a mix of SQL Server's sys.dm_exec_sessions and sys.dm_exec_requests:
SELECT pid, backend_type FROM pg_stat_activity ORDER BY backend_type, pid; pid | backend_type
-----+------------------------------
74 | autovacuum launcher
71 | background writer
70 | checkpointer
89 | client backend
67 | io worker
68 | io worker
69 | io worker
75 | logical replication launcher
73 | walwriter
(9 rows)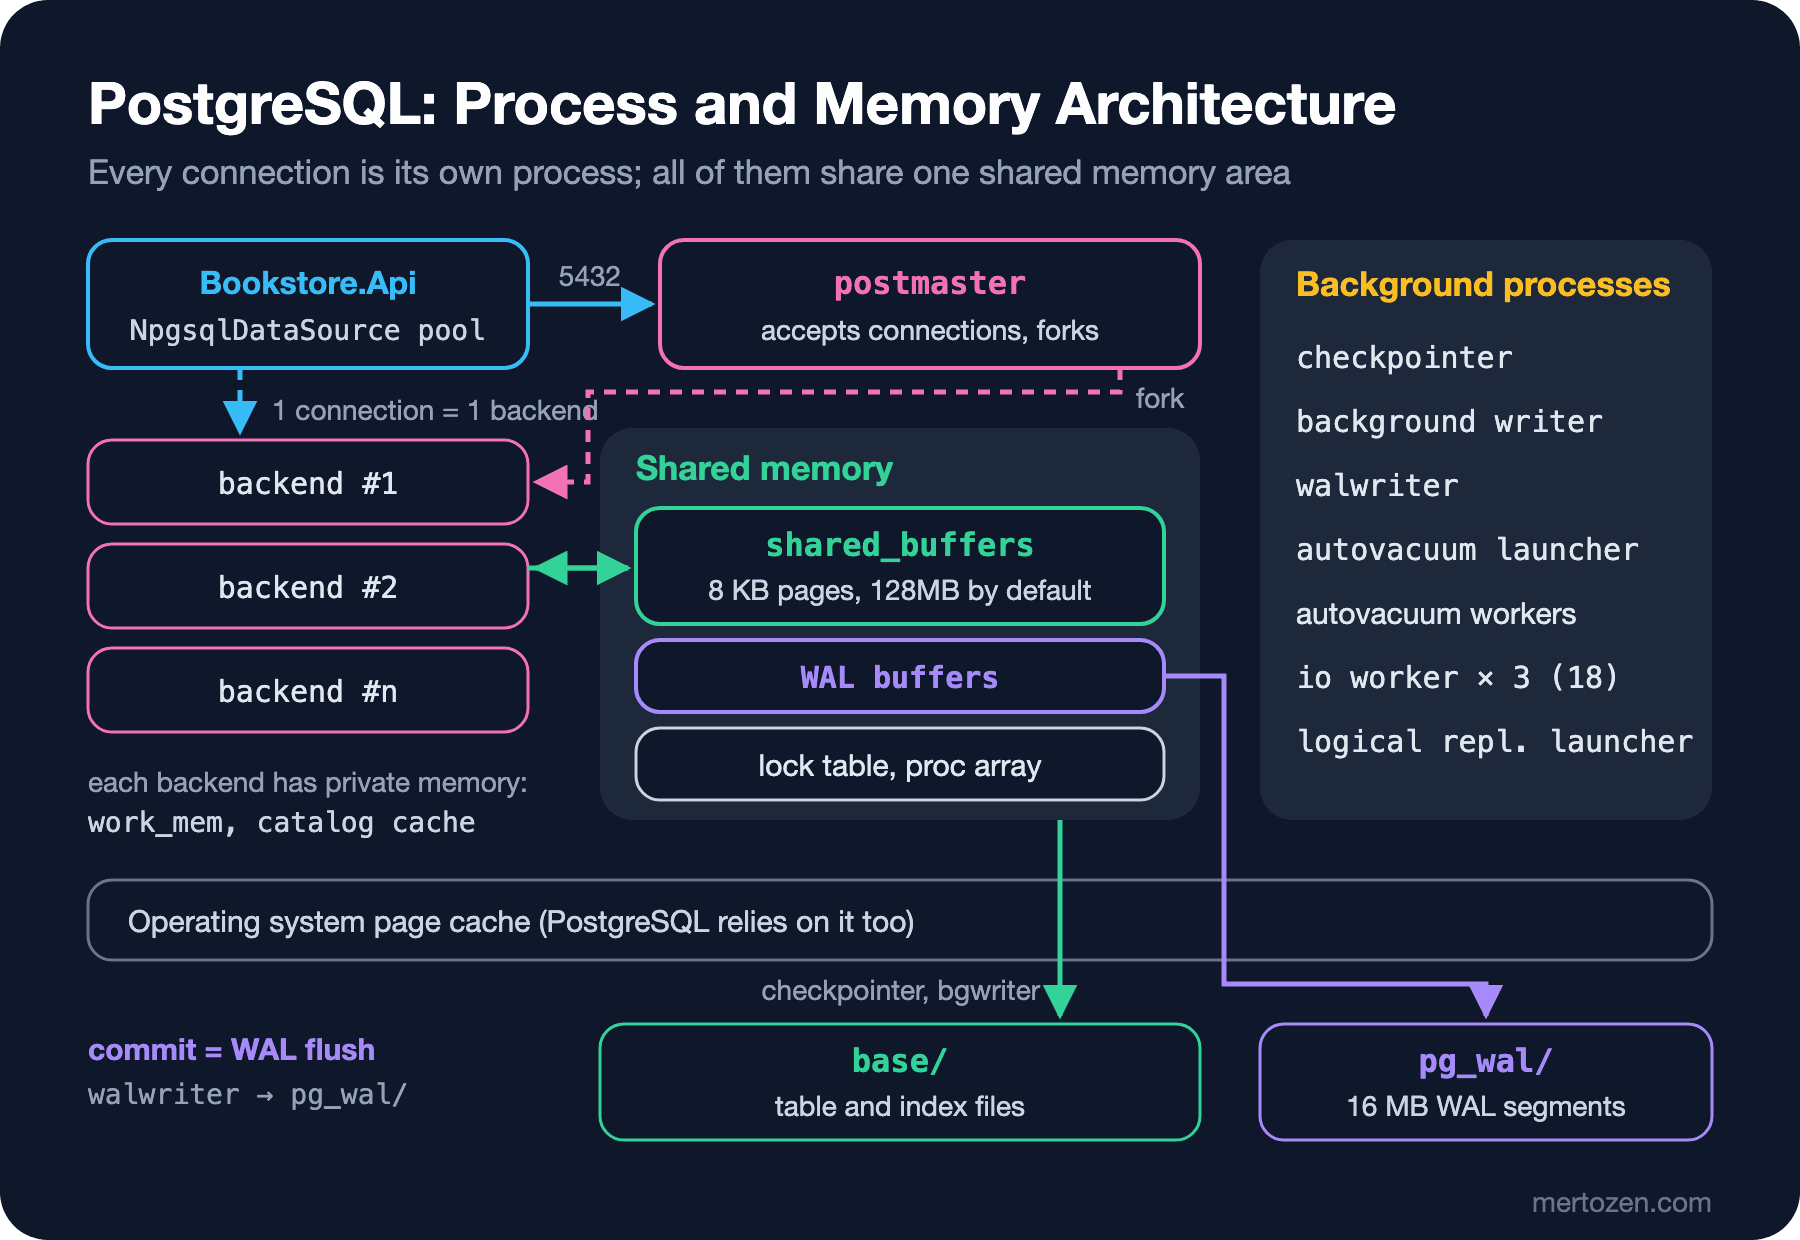
SQL Server works differently. As we saw in the first post of the SQL Server Derinlemesine series, SQL Server is a single process; its SQLOS layer runs schedulers and worker threads, and opening a connection doesn't even start a thread, it only creates a session object. In PostgreSQL every connection is a real process. That has consequences. When a query fails or a connection drops, only that process is affected; but if a backend crashes unexpectedly, the postmaster terminates all backends, because shared memory may be corrupted, and runs a short crash recovery. The everyday effect, though, is the per-connection cost: creating a process, authenticating, filling the catalog cache and the private memory every process carries.
That is why a connection pool is not optional in PostgreSQL. Pooling is on by default in Npgsql and Max Pool Size is 100. We sent 200 requests at once from the same machine, limited the pool to 20 and watched the number of server processes:
NpgsqlConnectionStringBuilder builder = new(connectionString) { MaxPoolSize = maxPoolSize };
await using NpgsqlDataSource pooled = NpgsqlDataSource.Create(builder);

await Parallel.ForEachAsync(Enumerable.Range(1, requests), new ParallelOptions { MaxDegreeOfParallelism = requests },
    async (_, ct) =>
    {
        await using NpgsqlCommand command = pooled.CreateCommand("SELECT pg_sleep(0.1)");
        await command.ExecuteNonQueryAsync(ct);
    });
200 queries, Max Pool Size=20
peak server processes for the app: 20
elapsed: 1.1 sTwo hundred requests finished with 20 processes; the 100 ms queries queued up in groups of 20 and the whole run took 1.1 seconds. The pool limit became the upper bound on server processes. Note that this limit applies per application instance. If you run Bookstore.Api as 8 instances and each one uses the default pool of 100, the worst case asks for 800 connections. At that point a server-side pooler such as PgBouncer comes in; that topic belongs to the Veritabanı Performansı ve Scaling series.
Memory: shared_buffers and the Operating System Page Cache
The area all backends share is shared memory. Its largest part is shared_buffers: the cache that holds 8 KB pages read from the data files. It is the counterpart of SQL Server's buffer pool, with one important difference. SQL Server prefers to take most of the memory and manage it itself; PostgreSQL deliberately takes a smaller share and leaves the rest to the operating system's page cache. For a dedicated database server with at least 1 GB of RAM the documentation suggests 25% of memory as a starting value, and notes that going above 40% is unlikely to help because the same data would then be cached twice. The default is 128MB.
To see both layers we evicted the pages of a 100,002-row table from shared buffers with the pg_buffercache extension and ran the same query twice:
CREATE EXTENSION pg_buffercache;
SELECT buffers_evicted FROM pg_buffercache_evict_relation('stock_items');
EXPLAIN (ANALYZE, COSTS OFF, TIMING OFF) SELECT sum(quantity_on_hand) FROM stock_items;
EXPLAIN (ANALYZE, COSTS OFF, TIMING OFF) SELECT sum(quantity_on_hand) FROM stock_items;
buffers_evicted
-----------------
447
Aggregate (actual rows=1.00 loops=1)
Buffers: shared read=443 dirtied=443
-> Seq Scan on stock_items (actual rows=100002.00 loops=1)
Buffers: shared read=443 dirtied=443
Planning Time: 0.052 ms
Execution Time: 5.270 ms
Aggregate (actual rows=1.00 loops=1)
Buffers: shared hit=443
-> Seq Scan on stock_items (actual rows=100002.00 loops=1)
Buffers: shared hit=443
Planning Time: 0.015 ms
Execution Time: 2.903 msThe first run shows 443 pages as read, the second as hit. Here read means "not in shared buffers, requested from the operating system", not "read from disk". Getting 443 pages in 5 ms shows they came from the operating system's cache. In PostgreSQL 18, EXPLAIN ANALYZE shows BUFFERS by default; we read plans in detail in post 07. dirtied=443 is interesting too: a read-only query changed pages. The reason is MVCC hint bits; the first query that reads freshly loaded rows notes on the page that the transaction which wrote them has committed. We come back to this in post 08.
Besides shared memory, every backend has its own private memory. The most important part is work_mem (4MB by default): sorts and hashes run in memory up to this limit and spill to disk beyond it. The limit applies not per query but per sort or hash node in the plan. If each of 97 connections runs a query with two hash joins, in theory at least 200 times work_mem can be in use. The central control of SQL Server's memory grants doesn't exist here, so when you raise work_mem you have to take the connection count into account.
WAL and Checkpoints
WAL is the counterpart of SQL Server's transaction log and rests on the same idea: at commit time, instead of writing the changed pages to disk, write only a sequential record of the change. The pages stay dirty in memory and are written at a checkpoint or by the background writer. After a crash, the WAL records since the last checkpoint are replayed. WAL files live in the pg_wal directory as 16 MB segments. We inserted 100,000 rows and measured how much WAL was produced:
SELECT pg_current_wal_lsn() AS before_lsn \gset
INSERT INTO stock_items SELECT g, g % 200 FROM generate_series(3, 100002) AS g;
SELECT pg_current_wal_lsn() AS after_lsn,
       pg_size_pretty(pg_wal_lsn_diff(pg_current_wal_lsn(), :'before_lsn')) AS wal_written,
       pg_size_pretty(pg_relation_size('stock_items')) AS table_size,
       pg_walfile_name(pg_current_wal_lsn()) AS wal_file;
after_lsn | wal_written | table_size | wal_file
-----------+-------------+------------+--------------------------
0/24C4D20 | 12 MB | 3544 kB | 000000010000000000000002
(1 row)An LSN, a byte position in the WAL stream, is read with pg_current_wal_lsn(), and the difference between two LSNs is the amount of WAL produced. The table is 3.5 MB and its primary key index 2.2 MB, yet 12 MB of WAL was written. That shouldn't surprise you: every row and every index entry gets its own WAL record, records have their own headers, and the first change to a page after a checkpoint writes the whole page into the WAL (full_page_writes, the protection against torn pages). During bulk loads the WAL volume can exceed the data itself. Replication and point-in-time recovery consume this same WAL stream.
SELECT num_timed, num_requested, buffers_written FROM pg_stat_checkpointer;
CHECKPOINT;
SELECT num_timed, num_requested, buffers_written FROM pg_stat_checkpointer;
num_timed | num_requested | buffers_written
-----------+---------------+-----------------
0 | 1 | 0
num_timed | num_requested | buffers_written
-----------+---------------+-----------------
0 | 2 | 851The checkpoint we triggered by hand wrote the 851 dirty buffers left over from the insert to the data files. Normally a checkpoint happens on its own when checkpoint_timeout (5 minutes by default) expires or when WAL approaches max_wal_size (1GB by default). If num_requested grows quickly relative to num_timed, checkpoints are being triggered early because the WAL limit fills up; on write-heavy systems that is one of the first metrics to look at.
MVCC: the Old Row Version Stays in the Table
Both databases have MVCC, but where the old versions live is completely different. Let's try it with two sessions. Session A updates the stock and doesn't commit for three seconds; meanwhile session B reads the same row:
CREATE TABLE stock_items (book_id int PRIMARY KEY, quantity_on_hand int NOT NULL);
INSERT INTO stock_items VALUES (1, 36), (2, 12);

/* A */
BEGIN;
UPDATE stock_items SET quantity_on_hand = 35 WHERE book_id = 1;
SELECT ctid, xmin, xmax, quantity_on_hand FROM stock_items WHERE book_id = 1;
SELECT pg_sleep(3);
COMMIT;

/* B, before A commits */
SELECT ctid, xmin, xmax, quantity_on_hand FROM stock_items WHERE book_id = 1;
session | ctid | xmin | xmax | quantity_on_hand
----------+-------+------+------+------------------
[A] sees | (0,3) | 767 | 0 | 35
session | ctid | xmin | xmax | quantity_on_hand
----------+-------+------+------+------------------
[B] sees | (0,1) | 766 | 767 | 36
Time: 0.969 msB didn't wait (1 ms) and saw the old value, 36. A sees the 35 it wrote. The two sessions read two different physical copies of the same row: ctid is the physical address of the row (page 0, items 1 and 3), xmin the ID of the transaction that created it and xmax the ID of the transaction that deleted or updated it. In PostgreSQL an UPDATE does not change the row in place; it writes its own transaction ID into the old row's xmax and inserts a new row. Each query decides which version to see based on its own snapshot. Looking inside the page with the pageinspect extension, both versions are there:
CREATE EXTENSION pageinspect;
SELECT lp, t_xmin, t_xmax, t_ctid FROM heap_page_items(get_raw_page('stock_items', 0));
SELECT n_live_tup, n_dead_tup FROM pg_stat_user_tables WHERE relname = 'stock_items';
lp | t_xmin | t_xmax | t_ctid
----+--------+--------+--------
1 | 766 | 767 | (0,3)
2 | 766 | 0 | (0,2)
3 | 767 | 0 | (0,3)
n_live_tup | n_dead_tup
------------+------------
2 | 1Item 1 is now a dead tuple: a committed transaction updated it and no open snapshot can see it anymore, yet it still takes up space on the page. The operation that reclaims this space is VACUUM:
VACUUM stock_items;
SELECT lp, lp_flags, t_xmin, t_xmax, t_ctid FROM heap_page_items(get_raw_page('stock_items', 0));
lp | lp_flags | t_xmin | t_xmax | t_ctid
----+----------+--------+--------+--------
1 | 2 | | |
2 | 1 | 766 | 0 | (0,2)
3 | 1 | 767 | 0 | (0,3)The data of the old version is gone; slot 1 only holds a small pointer to slot 3 (lp_flags = 2, a redirect). The redirect is part of the HOT mechanism, an update written to the same page without adding a new index entry; post 08 covers the details.
In SQL Server the default READ COMMITTED works with locking, and B would have waited until A committed. To keep readers from waiting you turn on RCSI; old versions are then copied to the version store in tempdb, or into the database's own PVS when ADR is on. We covered that mechanism in detail in the isolation level post of the SQL Server Derinlemesine series. PostgreSQL has no separate version store; the old version stays in the table itself (the heap), and READ COMMITTED behaves like RCSI by default. The price of this design is clear: if dead tuples aren't cleaned up, tables and indexes bloat, and a transaction left open for a long time stops the cleanup. That's why autovacuum is not something to turn off; it is part of how PostgreSQL works.
SQL Server Concepts and Their PostgreSQL Counterparts
Sometimes the names are the same and the meanings differ. The ones people mix up most often:
| SQL Server | PostgreSQL | Difference |
|---|---|---|
| Instance | Cluster | A single data directory managed by one postmaster; not a group of machines. |
| Database | Database | A query can't reach another database in the same cluster; use postgres_fdw or dblink if you must. |
Schema (dbo) | Schema (public) | search_path decides which schemas are searched. |
| Login + User | Role | One concept; a role with LOGIN can connect. |
| Filegroup | Tablespace | Points to a directory on another disk; most setups don't need it. |
| Transaction log (.ldf) | WAL (pg_wal) | 16 MB segment files; no recovery model, archiving is a separate setting. |
| Buffer pool | shared_buffers + OS page cache | PostgreSQL leaves most memory to the operating system. |
| tempdb version store / PVS | Old tuples in the heap | VACUUM and autovacuum clean them up. |
| Session (thread) | Backend (process) | One process per connection; pooling is mandatory. |
| SQL Server Agent | None | For scheduled jobs use the pg_cron extension or the application. |
"Cluster" causes the most confusion: in the PostgreSQL documentation a database cluster is the set of databases managed by one server process. We look at the role model and at separating the application role from the owner role in post 02, and at permissions in post 14.
License, Community and Release Schedule
PostgreSQL ships under the PostgreSQL License, a short license in the spirit of the most permissive open source licenses that allows commercial use and modified redistribution. No single company owns the project; it is developed under the name PostgreSQL Global Development Group by a community of contributors from many companies and independent developers. That means the roadmap doesn't depend on one vendor's commercial decisions; on the other hand, for "support" you rely on your own team, a consultancy or a managed service provider.
The versioning policy is simple and predictable. A major version comes out every year, usually in September or October, and each major version is supported for 5 years after its first release. Bug and security fixes arrive in minor releases at least every three months; a minor update only replaces binaries and never changes the data file format. In the week this post was written, on 12 November 2026, 18.7, 17.12, 16.16, 15.20 and 14.25 were released. 14.25 is the final release of PostgreSQL 14, which is now out of support. PostgreSQL 18 came out on 25 September 2025 and is supported until 14 November 2030. Moving between major versions requires pg_upgrade or a dump and restore; we cover that in post 14. This series is based on PostgreSQL 18; 19 is still a release candidate and is covered only in the last post.
When PostgreSQL, When SQL Server?
The decision usually comes down to cost and the team rather than technical superiority. Still, there are concrete points to weigh:
Licensing: PostgreSQL has no license cost. SQL Server Express is free but, even in SQL Server 2025, limited to 50 GB per database, at most 4 cores and about 1.4 GB of buffer pool; Developer edition can't be used in production; Standard and Enterprise are licensed per core. For a product like Bookstore whose growth is uncertain, this difference becomes decisive, especially when there are many environments such as test, staging or one installation per customer.
Ecosystem: PostgreSQL's extension mechanism is strong. Geographic data with PostGIS, similarity search with pg_trgm and vector search with pgvector can all live in the same database. PostgreSQL-specific types such as JSONB, arrays and ranges are the subject of posts 03 and 05 of this series.
Managed options: Azure Database for PostgreSQL (flexible server), Amazon RDS for PostgreSQL and Aurora PostgreSQL, Google Cloud SQL. Managed services don't give you superuser rights, and the extensions you can install are limited by an allow list; we look at this in post 13.
Where SQL Server is strong: integration with Windows authentication and Active Directory, tools that come from one place such as SSMS and Query Store, extra services that come with the same license such as SSIS, and built-in Always On availability groups. PostgreSQL has streaming replication in core, but automatic failover needs an external tool such as Patroni or a managed service. If the team has written T-SQL for years, reads execution plans in SSMS and has a SQL Server DBA on the operations side, the real cost of migrating can exceed the license savings.
In short: for a new project, especially in a Linux- and container-heavy environment and in the cloud, PostgreSQL is a strong default. With a large existing SQL Server investment, a tight dependency on the Microsoft ecosystem or no PostgreSQL operations experience in the team, staying on SQL Server is usually the lower-risk choice.
In Production
Connection count: raising max_connections to 1000 is not a lasting fix in a process model. Each process needs memory and CPU time, and many concurrently running processes compete in lock and snapshot bookkeeping. First add up the application-side pools: instance count times Max Pool Size must stay below max_connections, with room left for admin tools, migrations and monitoring agents. If that isn't enough, use PgBouncer.
Monitoring: the state column in pg_stat_activity is the single most valuable signal. A connection that sits in idle in transaction for a long time both holds locks and stops VACUUM from removing dead tuples. On the checkpoint side, watch num_requested grow in pg_stat_checkpointer.
Disk: plan separate space for WAL. If archiving fails or a replication slot isn't consumed, pg_wal keeps growing, and when the disk is full the database stops. It has a similar outcome to skipping log backups under the full recovery model in SQL Server.
Common Pitfalls
Creating a new NpgsqlDataSource per request: each data source carries its own pool, so one per request makes the pool useless and every request starts a new process. There should be a single data source for the lifetime of the application; we register it with dependency injection in post 11.
Reading read in EXPLAIN output as a disk read: it only says the page wasn't found in shared buffers. To tell real disk reads apart you need track_io_timing and operating system metrics.
Leaving transactions open: in SQL Server with RCSI a long transaction grows tempdb; in PostgreSQL the same mistake grows your tables directly, because the old versions live inside them.
Expecting cross-database queries: three-part names like OtherDb.dbo.Books in SQL Server have no counterpart in PostgreSQL. Data that the same application queries together should live in one database, in separate schemas if needed.
A Small Experiment
★☆☆ In the throwaway container, look at SHOW max_connections; and SHOW superuser_reserved_connections;. Then run ALTER SYSTEM SET max_connections = 20;, restart the container, predict at which connection the loop in this post stops and verify it.
★★☆ Open two psql sessions. In the first, type BEGIN;, update any row and wait. In the second, use SELECT pid, state, xact_start FROM pg_stat_activity; to find the first session showing as idle in transaction. Then run VACUUM VERBOSE on the updated table and read from the output how many dead tuples could not be removed.
★★★ Run the pool demo with Max Pool Size=5 and Timeout=1. Watch some requests time out while waiting for a connection from the pool and compare the error message with the server's 53300 error: which limit is set by the application and which by the database?
In the next post we leave the throwaway container behind and build a permanent lab: the changed volume path of the PostgreSQL 18 image, the everyday psql commands, porting the Bookstore schema to PostgreSQL and separating the application role from the superuser.