

PostgreSQL Index Types: B-tree, Hash, GIN, GiST, SP-GiST, BRIN and Partial/Expression Indexes

In PostgreSQL the shape of the query, not the column type, decides the index type: B-tree for equality and ranges, GIN for arrays, JSONB and ILIKE '%...%', GiST for overlaps, BRIN for tables that grow over time. A query that reads 26 pages instead of 10,328 with 18's skip scan, deduplication, INCLUDE and index-only scans, a 24 kB BRIN instead of a 21 MB B-tree, hash, partial and expression indexes, an INVALID index left by CONCURRENTLY and an index that breaks HOT updates.
Version note: The examples in this post were run on PostgreSQL 18.7 (the official postgres:18 Docker image), in the Bookstore lab we set up in post 02, right after reloading the schema; for comparison, one query was also run on PostgreSQL 17.11.
Guess First
The back-office screen of Bookstore, the online bookstore used as the shared example across this site's series, lists orders by status, so the orders table has an index on (status, created_at). The reporting team, however, asks for "yesterday's orders" regardless of status; status doesn't appear in the query at all. We turned off parallel query in the session to keep the plans simple:
SET max_parallel_workers_per_gather = 0;
CREATE INDEX ix_orders_status_created_at ON orders (status, created_at);
ANALYZE orders;

EXPLAIN (ANALYZE, COSTS OFF, TIMING OFF, SUMMARY OFF)
SELECT count(*) FROM orders
WHERE created_at >= timestamptz '2026-10-20' AND created_at < timestamptz '2026-10-21';
In SQL Server the answer is known: if the leading column of the index isn't in the predicate there is no seek; either the whole index or the table gets scanned. What does PostgreSQL 18 do? We also loaded the same data into PostgreSQL 17.11 and ran the query there.
/* PostgreSQL 18.7 */
 Aggregate (actual rows=1.00 loops=1)
   Buffers: shared hit=11 read=15
   ->  Index Only Scan using ix_orders_status_created_at on orders (actual rows=640.00 loops=1)
         Index Cond: ((created_at >= '2026-10-20 00:00:00+00'::timestamp with time zone) AND (created_at < '2026-10-21 00:00:00+00'::timestamp with time zone))
         Heap Fetches: 0
         Index Searches: 6
         Buffers: shared hit=11 read=15

/* PostgreSQL 17.11 */
 Aggregate (actual rows=1 loops=1)
   Buffers: shared hit=2368 read=7960
   ->  Seq Scan on orders (actual rows=640 loops=1)
         Filter: ((created_at >= '2026-10-20 00:00:00+00'::timestamp with time zone) AND (created_at < '2026-10-21 00:00:00+00'::timestamp with time zone))
         Rows Removed by Filter: 999360
         Buffers: shared hit=2368 read=7960
In 17 all one million rows were read: 10,328 pages. In 18 the same index was used and 26 pages were enough. The Index Searches: 6 line at the bottom of the plan tells you what happened: PostgreSQL 18's skip scan searched separately for each of the five distinct values of the leading column, reading five small ranges like status = 'Cancelled' AND created_at ... and status = 'Delivered' AND created_at .... In this post we try PostgreSQL's index types one by one: what's new for B-tree in 18, covering indexes, GIN, GiST, BRIN, Hash, partial and expression indexes, CREATE INDEX CONCURRENTLY and the cost indexes add on the write side.
B-tree: Skip Scan, Deduplication and Column Order
B-tree is PostgreSQL's default index and the right answer in most cases: it serves equality, ranges, ORDER BY, IS NULL and prefix LIKE 'abc%' (with a suitable collation). We saw its structure in the balanced tree post of the Algoritmalar ve Data Structure'lar series. The most important difference from SQL Server: PostgreSQL has no clustered index. The table is always a heap, and every index, the primary key included, is a separate structure pointing to the physical address of the row in the table (ctid).
Skip scan relaxes the column order rule for multicolumn indexes but doesn't remove it. The query above was fast because status has only five distinct values; with hundreds of thousands of distinct values in the leading column, the planner would find that many small searches too expensive and not use it. The general rule still holds: columns searched by equality first, then the range or sort column. Skip scan is a fallback that strengthens your hand when you ask "is it worth a separate index for this query?".
Since PostgreSQL 13, B-tree stores repeated key values in a single entry (deduplication). We built a second index on the same column with this turned off and compared sizes:
CREATE INDEX ix_orders_status ON orders (status);
CREATE INDEX ix_orders_status_nodedup ON orders (status) WITH (deduplicate_items = off);
indexrelname | size
-----------------------------+---------
ix_orders_status | 6904 kB
ix_orders_status_created_at | 39 MB
ix_orders_status_nodedup | 30 MBOn a one-million-row column with five distinct values, deduplication shrank the index from 30 MB to 6.9 MB. The (status, created_at) index on the same table is 39 MB: the second column makes every entry unique, so there are no duplicates to merge.
Covering Indexes and Index-Only Scans
A customer's order history screen: filter by customer number, sort by date, show three columns. The schema only has an index on customer_id:
EXPLAIN (ANALYZE, COSTS OFF, TIMING OFF, SUMMARY OFF)
SELECT order_number, created_at, total_amount FROM orders WHERE customer_id = 42 ORDER BY created_at DESC;
Sort (actual rows=473.00 loops=1)
Sort Key: created_at DESC
Sort Method: quicksort Memory: 47kB
Buffers: shared hit=62 read=405
-> Bitmap Heap Scan on orders (actual rows=473.00 loops=1)
Recheck Cond: (customer_id = 42)
Heap Blocks: exact=464
Buffers: shared hit=62 read=405
-> Bitmap Index Scan on ix_orders_customer_id (actual rows=473.00 loops=1)
Index Cond: (customer_id = 42)The 473 orders are spread over 464 different pages; the table was visited for each of them and the result was sorted in memory. This is the PostgreSQL version of the key lookup problem from the nonclustered index post of the SQL Server Derinlemesine series. The fix is the same as well: put the sort column in the key and the displayed columns in INCLUDE.
CREATE INDEX ix_orders_customer_created_incl ON orders (customer_id, created_at DESC)
    INCLUDE (order_number, total_amount);
Index Only Scan using ix_orders_customer_created_incl on orders (actual rows=473.00 loops=1)
Index Cond: (customer_id = 42)
Heap Fetches: 0
Index Searches: 1
Buffers: shared hit=1 read=6From 467 pages down to 7, and the Sort operator disappeared. Heap Fetches: 0 is an important detail: in PostgreSQL the visibility information of a row (the xmin/xmax we saw in post 01) lives in the table, not in the index. To answer without visiting the table, an index-only scan checks the visibility map, which records the pages whose rows are all visible to everyone. The map is maintained by VACUUM; on a frequently updated table that isn't vacuumed enough, Heap Fetches goes up and the index-only scan loses its advantage. So the value of a covering index depends on the health of autovacuum; we return to this relationship in post 08.
GIN and pg_trgm: Searching with ILIKE '%...%'
GIN is used for arrays, JSONB and full-text search; we saw the JSONB side in post 05, full-text comes in post 10. Here is its most practical use: searching within a book title. A B-tree can't help a LIKE '%...%' that isn't anchored at the start. The pg_trgm extension splits text into three-letter pieces (trigrams) and indexes them with GIN; the extension is trusted, so the owner role can install it:
CREATE EXTENSION IF NOT EXISTS pg_trgm;
EXPLAIN (ANALYZE, COSTS OFF, TIMING OFF, SUMMARY OFF)
SELECT count(*) FROM books WHERE title ILIKE '%hobbit #12%';
CREATE INDEX ix_books_title_trgm ON books USING gin (title gin_trgm_ops);
EXPLAIN (ANALYZE, COSTS OFF, TIMING OFF, SUMMARY OFF)
SELECT count(*) FROM books WHERE title ILIKE '%hobbit #12%';
Aggregate (actual rows=1.00 loops=1)
Buffers: shared hit=444
-> Seq Scan on books (actual rows=56.00 loops=1)
Filter: (title ~~* '%hobbit #12%'::text)
Rows Removed by Filter: 39944
Aggregate (actual rows=1.00 loops=1)
Buffers: shared hit=31
-> Bitmap Heap Scan on books (actual rows=56.00 loops=1)
Recheck Cond: (title ~~* '%hobbit #12%'::text)
Heap Blocks: exact=14
-> Bitmap Index Scan on ix_books_title_trgm (actual rows=56.00 loops=1)
Index Cond: (title ~~* '%hobbit #12%'::text)From a 444-page scan down to 31 pages. The index is 1,480 kB and also serves case-insensitive search (ILIKE). The search term should be at least three characters long; for one-letter or very common terms the index helps less. Typo-tolerant similarity search (similarity, the % operator) is the subject of post 10.
GiST, SP-GiST, BRIN and Hash
We met GiST in post 04: a GiST index was working behind the exclusion constraint and the temporal primary key. && and @> on ranges, geometry queries in PostGIS and nearest-neighbor ordering such as "the 10 closest stores" are GiST's job. SP-GiST is for unbalanced structures such as prefix trees and quadtrees: IP addresses (inet), text prefixes, point data. Bookstore has no query that needs SP-GiST right now; knowing it exists is enough.
BRIN is for large tables that grow over time. Orders are inserted in creation order, so the correlation of created_at with the physical order is exactly 1:
SELECT attname, correlation FROM pg_stats
WHERE tablename = 'orders' AND attname IN ('created_at', 'customer_id', 'total_amount') ORDER BY 1;
CREATE INDEX ix_orders_created_at_btree ON orders (created_at);
CREATE INDEX ix_orders_created_at_brin ON orders USING brin (created_at);
attname | correlation
--------------+----------------
created_at | 1
customer_id | 0.033856127
total_amount | -0.00050482864
indexrelname | size
----------------------------+-------
ix_orders_created_at_brin | 24 kB
ix_orders_created_at_btree | 21 MBFor the same column the B-tree is 21 MB and the BRIN 24 kB. We dropped the B-tree and asked for one day's orders:
 Aggregate (actual rows=1.00 loops=1)
   Buffers: shared hit=133
   ->  Bitmap Heap Scan on orders (actual rows=720.00 loops=1)
         Recheck Cond: ((created_at >= '2026-10-01 00:00:00+00'::timestamp with time zone) AND (created_at < '2026-10-02 00:00:00+00'::timestamp with time zone))
         Rows Removed by Index Recheck: 11696
         Heap Blocks: lossy=128
         ->  Bitmap Index Scan on ix_orders_created_at_brin (actual rows=1280.00 loops=1)
BRIN finds page ranges, not rows (lossy=128): by default it keeps a summary per block of 128 pages, reads a matching block completely and rechecks the rows one by one. To find 720 rows it read 12,416, but only 133 pages of the one-million-row table. BRIN depends entirely on correlation: on a randomly distributed column such as customer_id every block covers almost every value and the index is useless. Order events, logs, measurements and audit tables are where BRIN helps most; as updates and deletes disturb the physical order, its effect fades.
A hash index supports equality only. Since PostgreSQL 10 it is WAL-logged and safe to use with replication; the old "don't use hash indexes" warning no longer applies. In most cases it has no advantage, though:
CREATE INDEX ix_orders_order_number_hash ON orders USING hash (order_number);
EXPLAIN (COSTS OFF) SELECT * FROM orders WHERE order_number > 'BK-00999990';
indexrelname | size
-----------------------------+-------
ix_orders_order_number_hash | 32 MB
ux_orders_order_number | 30 MB
Index Scan using ux_orders_order_number on orders
Index Cond: ((order_number)::text > 'BK-00999990'::text)On short order numbers the hash index isn't even smaller than the B-tree, and for the range query the planner went back to the B-tree; a hash index also can't be unique. Where it makes sense is equality-only lookups on very long values (URLs, long hashes): a B-tree stores the whole value, a hash index only its 4-byte hash.
Partial and Expression Indexes
A partial index covers only the rows of a table that satisfy a condition. Of one million orders 4,800 are Pending, and the operations screen only cares about those:
CREATE INDEX ix_orders_pending ON orders (created_at) WHERE status = 'Pending';
EXPLAIN (ANALYZE, COSTS OFF, TIMING OFF, SUMMARY OFF)
SELECT order_id, created_at FROM orders WHERE status = 'Pending' ORDER BY created_at LIMIT 20;
EXPLAIN (COSTS OFF)
SELECT order_id FROM orders WHERE status IN ('Pending', 'PaymentPending') ORDER BY created_at LIMIT 20;
partial_size
--------------
128 kB
Limit (actual rows=20.00 loops=1)
Buffers: shared hit=1 read=2
-> Index Scan using ix_orders_pending on orders (actual rows=20.00 loops=1)
Limit
-> Sort
Sort Key: created_at
-> Seq Scan on orders
Filter: (status = ANY ('{Pending,PaymentPending}'::text[]))The 128 kB index answered by reading 3 pages. The second query couldn't use it: a partial index is used only if the query's condition logically implies the index's condition, and IN ('Pending', 'PaymentPending') doesn't guarantee status = 'Pending'. It is the counterpart of SQL Server's filtered index; the WHERE deleted_at IS NULL unique index from the soft delete post of the Çözüm Desenleri series is built the same way.
An expression index indexes the result of an expression. To ignore case when logging in by e-mail:
EXPLAIN (ANALYZE, COSTS OFF, TIMING OFF, SUMMARY OFF)
SELECT customer_id FROM customers WHERE lower(email) = 'customer42@example.com';
CREATE INDEX ix_customers_email_lower ON customers (lower(email));
Seq Scan on customers (actual rows=1.00 loops=1)
Filter: (lower(email) = 'customer42@example.com'::text)
Rows Removed by Filter: 99999
Buffers: shared read=1165
Bitmap Heap Scan on customers (actual rows=1.00 loops=1)
Recheck Cond: (lower(email) = 'customer42@example.com'::text)
-> Bitmap Index Scan on ix_customers_email_lower (actual rows=1.00 loops=1)
Index Cond: (lower(email) = 'customer42@example.com'::text)
Buffers: shared read=3The unique index on email didn't help the lower(email) query; the expression has to match exactly. In SQL Server the same job requires a computed column that you then index. Let's put what we've seen so far together by the shape of the query:
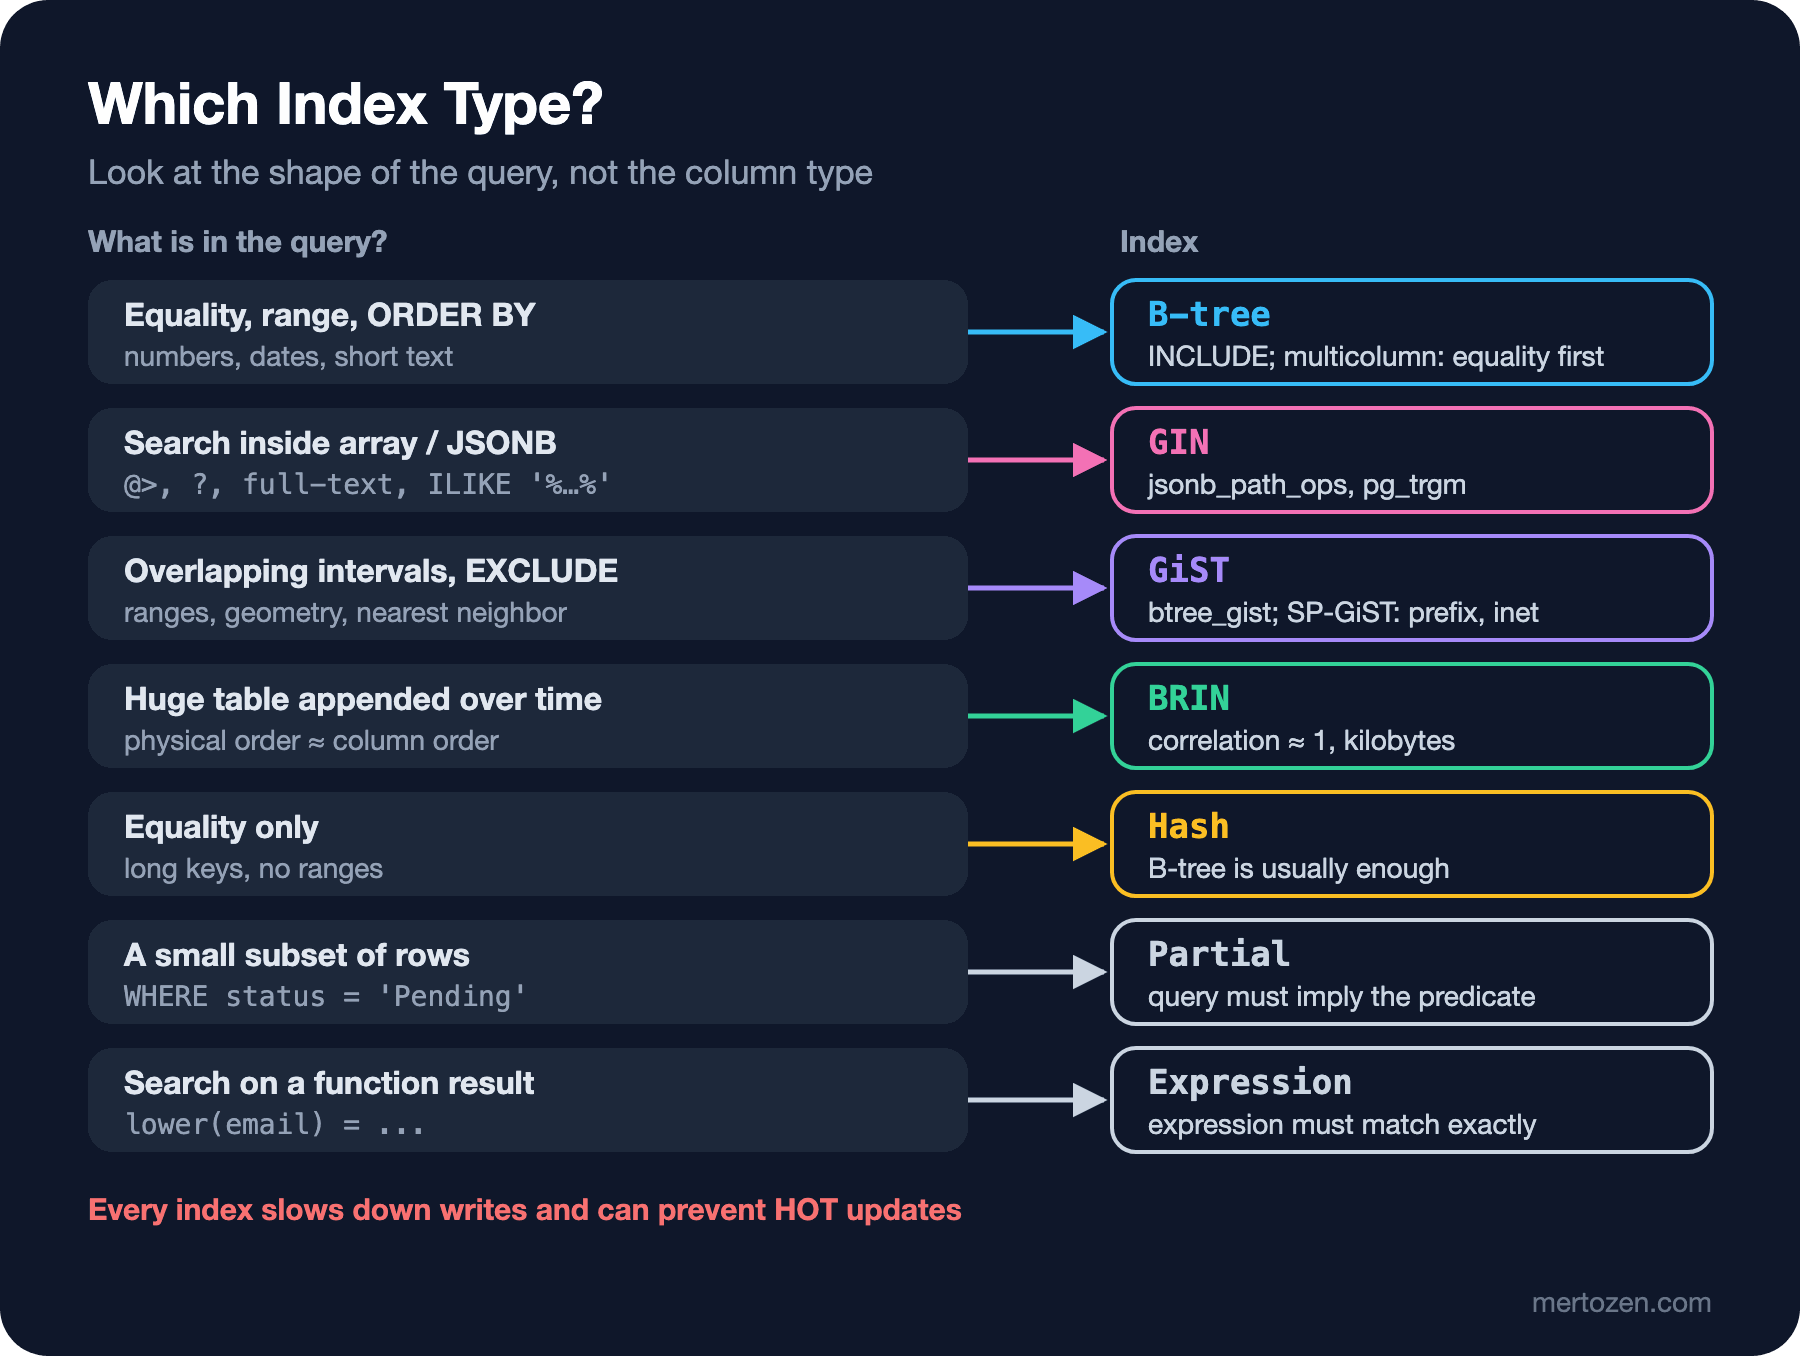
CREATE INDEX CONCURRENTLY and INVALID Indexes
A plain CREATE INDEX blocks writes to the table while it runs (reads are allowed). The way to add an index to a large table in production is CONCURRENTLY: it scans the table twice and doesn't block writes, but it can't run inside a transaction and leaves something behind when it fails. Let's try a unique index that assumes last name and first name are unique:
CREATE UNIQUE INDEX CONCURRENTLY ux_customers_last_first ON customers (last_name, first_name);
SELECT indexrelid::regclass AS index_name, indisvalid, indisready FROM pg_index
WHERE indexrelid = 'ux_customers_last_first'::regclass;
\d customers
ERROR: could not create unique index "ux_customers_last_first"
DETAIL: Key (last_name, first_name)=(Borg, Linus) is duplicated.
index_name | indisvalid | indisready
-------------------------+------------+------------
ux_customers_last_first | f | f
Indexes:
"customers_pkey" PRIMARY KEY, btree (customer_id)
"ux_customers_email" UNIQUE, btree (email)
"ux_customers_last_first" UNIQUE, btree (last_name, first_name) INVALIDThe command failed but the index wasn't removed; it stayed behind as INVALID. Queries won't use it, but depending on how far it got it may keep being maintained on writes, and trying to create it again with the same name fails with "already exists". The right cleanup is DROP INDEX CONCURRENTLY ux_customers_last_first;, then fixing the problem and trying again. With migration tools (using CONCURRENTLY in EF Core migrations is covered in post 12), checking pg_index for indexes with indisvalid = false after a failed deploy is a good habit.
Unused Indexes and the Cost of Writes
Every index might speed up reads, but it certainly slows down writes: every INSERT adds an entry to every index. In PostgreSQL there is one more cost: the HOT update, an update that writes the new row version into the same page and doesn't touch the indexes when no indexed column changes. On a copy of the stock table with free space left in its pages (fillfactor = 80), we first updated a column without an index, then indexed that column and ran the same update on other rows:
CREATE TABLE stock_demo WITH (fillfactor = 80) AS SELECT * FROM stock_items;
ALTER TABLE stock_demo ADD PRIMARY KEY (book_id);
UPDATE stock_demo SET quantity_reserved = quantity_reserved + 1 WHERE book_id % 100 = 0;
SELECT n_tup_upd, n_tup_hot_upd FROM pg_stat_user_tables WHERE relname = 'stock_demo';
CREATE INDEX ix_stock_demo_reserved ON stock_demo (quantity_reserved);
UPDATE stock_demo SET quantity_reserved = quantity_reserved + 1 WHERE book_id % 100 = 50;
SELECT n_tup_upd, n_tup_hot_upd FROM pg_stat_user_tables WHERE relname = 'stock_demo';
n_tup_upd | n_tup_hot_upd
-----------+---------------
400 | 400
n_tup_upd | n_tup_hot_upd
-----------+---------------
800 | 400All of the first 400 updates were HOT; none of the 400 after adding the index were. Every non-HOT update writes a new entry into every index on the table, bloats the indexes and leaves more work for VACUUM. Think about this cost before indexing frequently updated columns (stock, status, counters); HOT and fillfactor are covered in detail in post 08.
pg_stat_user_indexes tells you which indexes are never used:
SELECT indexrelname, idx_scan, pg_size_pretty(pg_relation_size(indexrelid)) AS size
FROM pg_stat_user_indexes
WHERE schemaname = 'public' AND relname IN ('orders', 'order_items', 'books')
ORDER BY pg_relation_size(indexrelid) DESC;
indexrelname | idx_scan | size
-------------------------+----------+---------
order_items_pkey | 0 | 54 MB
ix_order_items_order_id | 0 | 39 MB
ux_orders_order_number | 1 | 30 MB
orders_pkey | 2 | 21 MB
ix_order_items_book_id | 0 | 17 MB
ix_orders_customer_id | 1 | 9064 kB
ux_books_isbn | 0 | 1248 kB
books_pkey | 1 | 896 kB
ix_books_author_id | 0 | 408 kBSince the schema was just loaded in the lab, the counters are close to zero; in production the same query looks at statistics accumulated over weeks. A large index with idx_scan = 0 is a candidate for removal, but check three things before deciding: when the counters were last reset (pg_stat_reset, a major upgrade), whether replicas use the index, since statistics are kept separately on each server, and whether the index backs a unique or primary key constraint (then it is needed even if unused). It is the counterpart of SQL Server's sys.dm_db_index_usage_stats.
The last question people coming from SQL Server ask: can the table be physically ordered by an index? CLUSTER orders USING ix_orders_customer_id rewrites the table in that order once, but it locks the table completely while it runs, and rows added later don't keep the order; it is not a permanent arrangement like a SQL Server clustered index. PostgreSQL 19 brings the REPACK command, which can do this without blocking; that's in the last post of the series.
In Production
Add and drop indexes with CONCURRENTLY; a long-running plain CREATE INDEX makes every write on the table wait. CONCURRENTLY isn't free either: it scans the table twice, waits for open transactions on the table before it starts and can hang for hours if there is a long transaction. Bound it with lock_timeout and statement_timeout.
Think about indexes together with memory: shared buffers and the operating system cache should be able to hold the upper levels of frequently used indexes. In the lab the order_items table itself is 124 MB, while its three indexes alone add up to 109 MB. Every unnecessary index competes for the same cache space as frequently used data.
Before adding an index to a large table, verify with EXPLAIN that it will actually be chosen, and after adding it, verify with pg_stat_user_indexes that it is used. We learn to read the planner's decisions in post 07.
Common Pitfalls
A separate index on every column: for queries like WHERE customer_id = ? AND status = ?, one multicolumn index is usually better than two single-column indexes. PostgreSQL can combine two indexes with a bitmap (BitmapAnd), but that is more expensive than a single, correctly ordered index.
Leaving foreign key columns without an index: like SQL Server, PostgreSQL doesn't create an index for a foreign key automatically. When a parent row is deleted or updated, the child table is scanned; that's why the Bookstore schema has indexes such as ix_order_items_order_id from the start.
Expecting a plain index to help a column wrapped in a function: expressions such as lower(email), created_at::date or (attributes ->> 'pages')::int need an expression index, or the query rewritten as created_at >= ... AND created_at < ....
Not noticing an INVALID index left over from a failed CONCURRENTLY: it takes disk space and can slow down writes. Keep SELECT indexrelid::regclass FROM pg_index WHERE NOT indisvalid; on your regular checklist.
A Small Experiment
★☆☆ Compare the sizes of indexes on (book_id) and (book_id, order_id) on order_items. In which one does deduplication help more, and why?
★★☆ Build a B-tree and a BRIN index on shipped_at in the shipments table. Using the correlation in pg_stats, predict which one will do better for a one-week range query and verify with EXPLAIN (ANALYZE, BUFFERS).
★★★ Design an index strategy on orders and order_items for the query "best-selling books of the last 30 days". Record the plan without indexes first, then add the indexes and compare the number of pages the two plans read. We read this query in detail in the next post.
In the next post we open up the things we skimmed over while reading the plans in this post: EXPLAIN (ANALYZE, BUFFERS), scan and join nodes, planner statistics and pg_stat_statements for finding slow queries.