

Code Splitting, Tree Shaking and Bundle Analysis: Finding What Bloats Your Bundle

Do not guess what bloats a bundle, measure it: ng build --stats-json, source-map-explorer, rollup-plugin-visualizer and webpack-bundle-analyzer show the breakdown by package, and tree shaking only works on ESM modules without side effects. In Bookstore's Angular app we see that named imports from lodash gain nothing, that a barrel file carries side effects, that removing moment and lodash takes main from 359 kB to 224 kB, and how to make the vendor chunk decision in Vite.
Version note: The examples in this post were run with Angular 22.2 (Angular CLI and @angular/build 22.2.7), TypeScript 6.0 (Angular project) and 7.0 (Vite widget), Vite 8.3, webpack 5.112, rollup-plugin-visualizer 7.1, webpack-bundle-analyzer 5.4, source-map-explorer 2.5 and Node.js 24; browser behavior was observed with Playwright 1.65's Chromium.
Guess First
The catalog page of bookstore-web, the Angular client of Bookstore, the online bookstore used as the shared example across this site's series, uses lodash to group books by author:
import _ from 'lodash';

const byAuthor = _.groupBy(_.sortBy(matches, 'title'), 'author');
In code review someone says "we import all of lodash, let's take only what we use", and we change the import:
import { groupBy, sortBy } from 'lodash';

const byAuthor = groupBy(sortBy(matches, 'title'), 'author');_.map, _.groupBy and _.sumBy on the admin page become named imports the same way. After ng build, how many kB will the main bundle be, given that it was 359.02 kB before? What would change if we made the same change with lodash-es instead of lodash?
This is the sixth post of the Build Tools series. In the previous post, while looking at the Angular CLI's build system, we set the CommonJS warnings aside; now we return to them: measuring what bloats the bundle, the conditions tree shaking needs, code splitting and the vendor chunk decision. Measuring how a smaller bundle affects page speed is the topic of the upcoming Web Performance series; this post deals with the bundle itself.
Measure First: stats.json and Source Maps
Do not start shrinking a bundle on a guess; first look at what is inside it. The Angular CLI offers the --stats-json flag for this. The build writes a file in esbuild's metafile format; since 22.2 there are separate files for browser and server, so the file is named browser-stats.json. We wrote a small script that summarizes this file by package:
// Usage: ng build --stats-json && node scripts/bundle-report.mjs
// Groups the bytes of the main bundle by npm package (or "src" for our own code).
import { readFileSync } from 'node:fs';

const stats = JSON.parse(readFileSync('dist/bookstore-web/browser-stats.json', 'utf8'));

function packageOf(input) {
  const index = input.lastIndexOf('node_modules/');
  if (index < 0) {
    return 'src';
  }
  const parts = input.slice(index + 'node_modules/'.length).split('/');
  return parts[0].startsWith('@') ? `${parts[0]}/${parts[1]}` : parts[0];
}

for (const [file, output] of Object.entries(stats.outputs)) {
  if (output.entryPoint !== 'src/main.ts') {
    continue;
  }
  const byPackage = new Map();
  for (const [input, { bytesInOutput }] of Object.entries(output.inputs)) {
    byPackage.set(packageOf(input), (byPackage.get(packageOf(input)) ?? 0) + bytesInOutput);
  }
  const total = [...byPackage.values()].reduce((sum, bytes) => sum + bytes, 0);
  console.log(`${file}: ${(output.bytes / 1000).toFixed(2)} kB`);
  for (const [name, bytes] of [...byPackage].sort((a, b) => b[1] - a[1]).slice(0, 8)) {
    const share = ((bytes / total) * 100).toFixed(1).padStart(5);
    console.log(`  ${name.padEnd(28)} ${share}%`);
  }
}
We added "analyze": "ng build --stats-json && node scripts/bundle-report.mjs" to package.json:
npm run analyzemain-KUFRJQIS.js: 359.02 kB
@angular/core 29.2%
lodash 22.2%
@angular/router 20.3%
moment 17.4%
rxjs 4.5%
@angular/platform-browser 3.2%
@angular/common 1.5%
src 1.2%Our own code is 1.2 percent of main; lodash and moment together are about 40 percent. There is a reason the script shows percentages instead of bytes. As the @angular/build source shows, when chunk optimization is on (the Rolldown step we saw in the previous post), the byte values in the stats file are computed proportionally from the chunk Rolldown produced. Their sum does not match the final file exactly: in our case the inputs add up to 466 kB while the file itself is 359 kB. The ratios give the right picture; for exact bytes you need a tool based on source maps:
npx ng build --source-map
npx source-map-explorer dist/bookstore-web/browser/main-*.js --no-border-checks
source-map-explorer ties every byte of the final file to its source file through the source map and opens a treemap in the browser. In our build lodash came out at 71.6 kB and moment at 62.8 kB, consistent with the ratios in the stats. Without --no-border-checks the tool stops with the error below; source-map-explorer, which has not been updated since 2022, treats one of the mappings in Angular's source map as invalid, and --no-border-checks turns that check off:
Your source map refers to generated column Infinity on line 1, but the source only contains 7436 column(s) on that line.The Conditions for Tree Shaking, and CommonJS
The answer to the guess: after moving to named imports, main is still 359.02 kB. Nothing changes. Moving to lodash-es, on the other hand, brings it down to 310.03 kB. The reason is that tree shaking works on ESM. With ESM the bundler knows what a module exports and who imports what without running the code; it can safely drop unused exports. The lodash package is CommonJS: a single file of about 546 kB that adds properties to module.exports at runtime. There is no way to know statically which property is used, so esbuild takes the whole file. Writing import { groupBy } from 'lodash' does not change that file; it only changes how the import is written.
The warning Angular prints during the build says exactly this:
▲ [WARNING] Module 'lodash' used by 'src/app/admin/admin-page.ts' is not ESM

  CommonJS or AMD dependencies can cause optimization bailouts.
You can silence the warning by adding the package name to the allowedCommonJsDependencies list in angular.json, but the Angular docs describe this option only as a way to turn the warning off; it has no effect on the bundle. Use it for a CommonJS dependency you accept knowingly, not to hide a problem.
lodash-es, by contrast, ships every function as a separate ESM file. But when we looked with source-map-explorer, 144 files and 19.4 kB came from lodash-es, while we used only four functions. The reason is string shorthands like groupBy(items, 'author'): lodash resolves them through its "iteratee" machinery, and that machinery brings in every iteratee kind, including property paths, matches and deep equality comparison. Tree shaking worked, but the dependencies of the function you use can be larger than you think.
sideEffects and Barrel Files
The second condition of tree shaking is side effects. Even if none of a module's exports is used, if code runs at the top level of the module (writing to a global, adding an event listener) the bundler cannot drop it. We tried this with a barrel file, an index.ts that re-exports the modules of a folder from one place. We temporarily added an error reporting module and a barrel to Bookstore's shared folder:
// Runs as soon as the module is evaluated: a top-level side effect
window.addEventListener('error', (event) => {
  console.warn('[bookstore] unhandled error reported', event.message);
});

export function reportError(error: unknown): void {
  console.warn('[bookstore] reported', error);
}
export * from './cart-store';
export * from './collections';
export * from './dates';
export * from './error-reporting';
export * from './format';The admin page was changed to import only formatPrice from ../shared instead of ../shared/format. reportError is not used anywhere. The result: the admin page's lazy chunk grew from 631 bytes to 723 bytes and contains the text unhandled error reported. The bundler had to load every module the barrel exports and, to preserve the side effect of error-reporting.ts, put it into the chunk. On top of that, the listener is now added only when the admin page opens; the barrel also changed when a side effect runs.
When we added "sideEffects": false to package.json, the chunk went back to 631 bytes and the hash of main returned to its value before the barrel. This field promises the bundler "none of the files in this package has side effects, drop what is unused". If the promise is wrong, you mislead the bundler without any warning: in our example the error reporting listener silently left the bundle. Library authors should write this field correctly with a list such as "sideEffects": ["*.css", "./src/polyfills.ts"]; in application code, importing directly from the file path instead of a barrel is safer. After the experiment we removed the barrel and the sideEffects line.
The Bookstore Case: Moving Off moment and lodash
The browser's own Intl APIs can take moment's place. Intl.RelativeTimeFormat has been in all major browsers since 2020. Temporal finished the TC39 process in 2026 and is available in Chrome 144 and Firefox 139, but not yet in a stable Safari release; it is not Baseline. So we do the date arithmetic with Date and leave the formatting to Intl:
const relative = new Intl.RelativeTimeFormat('en', { numeric: 'auto' });
const longDate = new Intl.DateTimeFormat('en-US', { dateStyle: 'long', timeZone: 'UTC' });

const units: readonly (readonly [Intl.RelativeTimeFormatUnit, number])[] = [
  ['year', 365 * 24 * 60 * 60],
  ['month', 30 * 24 * 60 * 60],
  ['day', 24 * 60 * 60],
  ['hour', 60 * 60],
  ['minute', 60],
];

export function fromNow(iso: string, now: number = Date.now()): string {
  const seconds = Math.round((Date.parse(iso) - now) / 1000);
  for (const [unit, size] of units) {
    if (Math.abs(seconds) >= size) {
      return relative.format(Math.round(seconds / size), unit);
    }
  }
  return relative.format(seconds, 'second');
}

export function formatLongDate(iso: string): string {
  return longDate.format(new Date(iso));
}
For lodash, the first thing that comes to mind is Object.groupBy. But according to MDN's compatibility data Safari added it in 17.4; as we saw in the previous post, Angular 22 supports Safari 17.0. Its "widely available" Baseline status also falls 30 months after March 2024, which is after 2026-05-07, the date Angular 22 picked. A build tool does not catch this gap: esbuild transforms syntax for the target but does not add a polyfill for a missing API. So we wrote a ten-line helper:
// Object.groupBy is Baseline only since March 2024 (Safari 17.4), while Angular 22 still supports Safari 17.0
export function groupBy<T, K>(items: readonly T[], key: (item: T) => K): Map<K, T[]> {
  const groups = new Map<K, T[]>();
  for (const item of items) {
    const groupKey = key(item);
    const group = groups.get(groupKey);
    if (group) {
      group.push(item);
    } else {
      groups.set(groupKey, [item]);
    }
  }
  return groups;
}
const byAuthor = groupBy(
[...matches].sort((a, b) => a.title.localeCompare(b.title)),
(book) => book.author,
);
return [...byAuthor.keys()]
.sort((a, b) => a.localeCompare(b))
.map((author) => ({ author, books: byAuthor.get(author) ?? [] }));The main line of the ng build output at each step:
| Step | main | Estimated transfer |
|---|---|---|
Start: import _ from 'lodash' and moment | 359.02 kB | 102.14 kB |
import { groupBy, sortBy } from 'lodash' | 359.02 kB | 102.23 kB |
lodash-es named imports | 310.03 kB | 85.83 kB |
Intl instead of moment, groupBy instead of lodash | 223.73 kB | 60.91 kB |
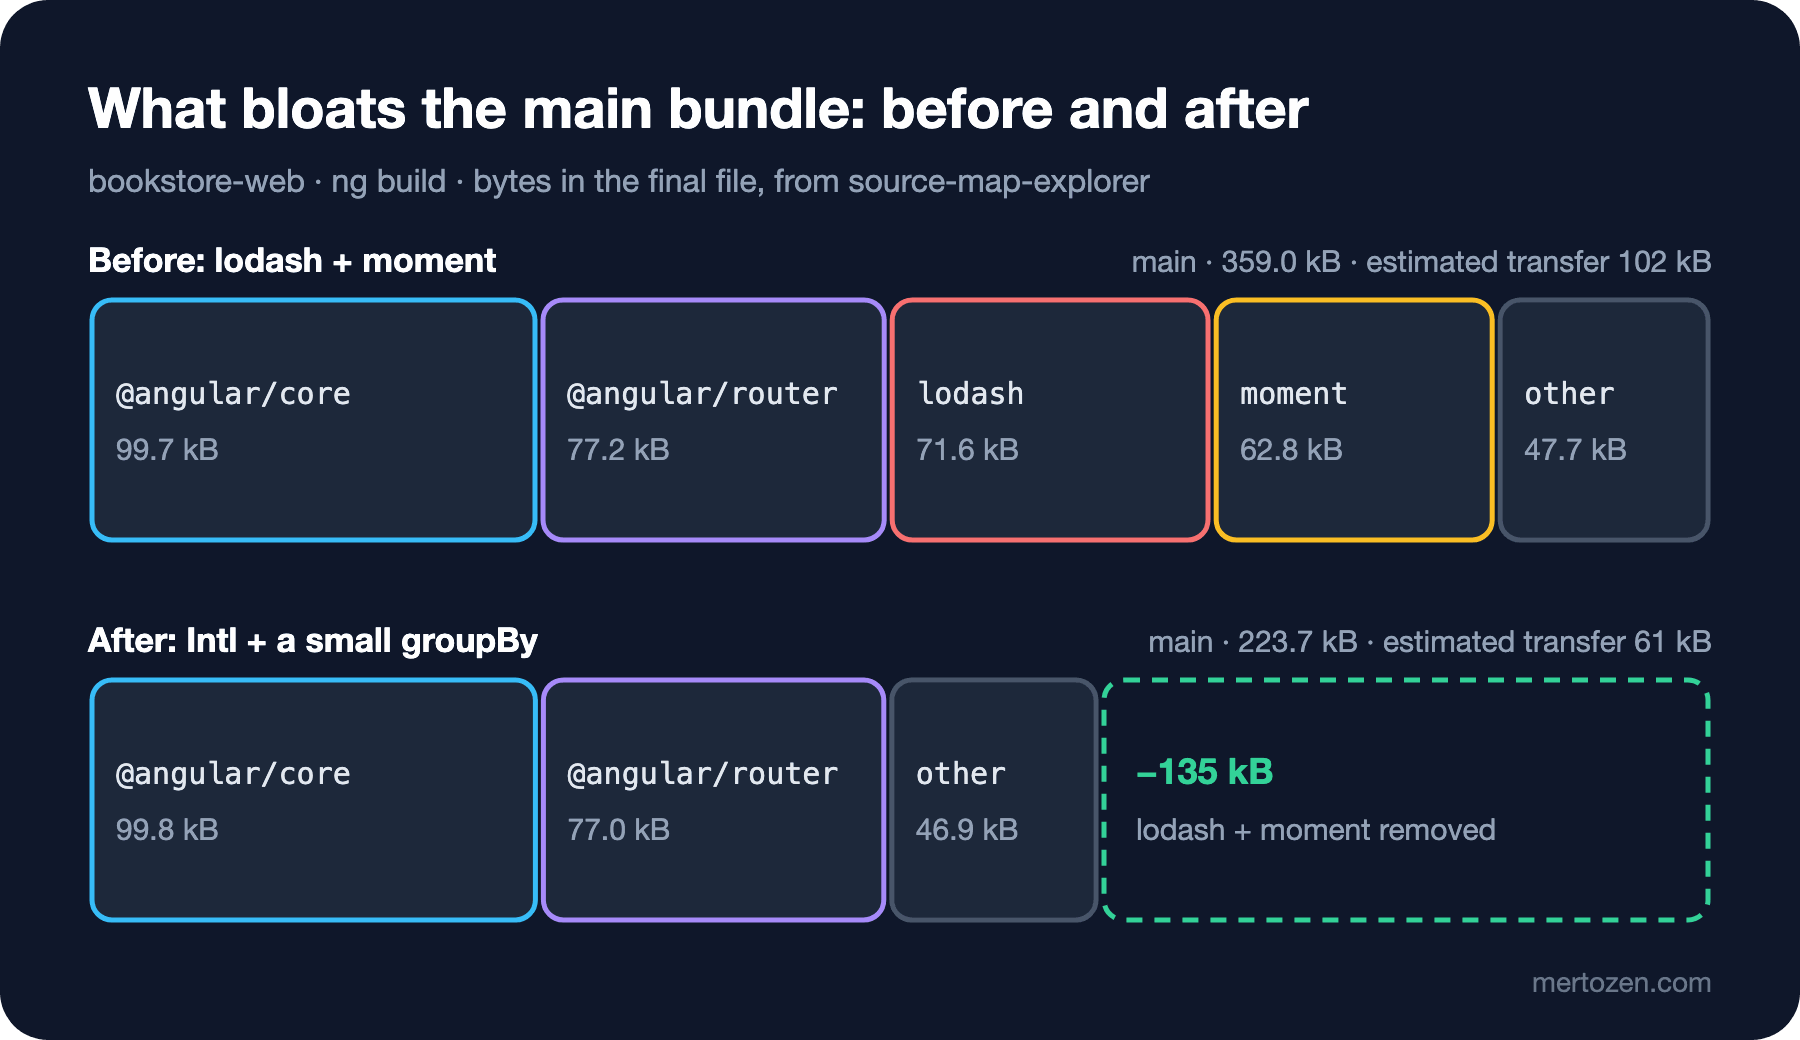
In the final state npm run analyze shows:
main-Y3GQS3U4.js: 223.73 kB
  @angular/core                 48.0%
  @angular/router               33.6%
  rxjs                           7.4%
  @angular/platform-browser      5.3%
  @angular/common                2.5%
  src                            2.3%
  tslib                          0.9%
The CommonJS warnings are gone and three packages (lodash, moment and @types/lodash) left package.json. But we compared the catalog page texts before and after the change with Playwright, and three of the eight books differed: where moment says "a day ago", Intl.RelativeTimeFormat with numeric: 'auto' says "yesterday", and where it says "a month ago", "last month"; a 107-day difference is "3 months ago" in moment and "4 months ago" with our 30-day month. Replacing a library means changing behavior; decide with the product side whether these differences are acceptable, and lock the decision in with a unit test.
Code Splitting: When Is a Separate Chunk Worth It?
The basic tool of code splitting is dynamic import(). In Angular we do this at the route level with loadComponent:
{ path: 'admin', loadComponent: () => import('./admin/admin-page'), title: 'Admin · Bookstore' },The admin page is in its own lazy chunk and is downloaded only when /admin opens. To defer a heavy part inside a page (a chart, an editor), Angular's @defer block uses the same mechanism; we will cover @defer triggers and their effect on page speed in the Web Performance series.
Splitting has a cost: every chunk is a request, and the bundler has to decide where the shared code a lazy chunk needs will live. As we saw in the previous post, esbuild splits that code into fine-grained shared chunks, and Angular merges them again with Rolldown once there are three or more lazy chunks. The general rule: pages most users never open (admin, reports) and heavy, rarely used components get their own chunk; code used on every page stays in main.
The Vendor Chunk: Logic That Changed After HTTP/2
In the HTTP/1.1 days the browser could open only a few parallel connections to the same server, and every request was expensive. The common strategy back then was to put all of node_modules into a single vendor file: even if the application code changes on every deploy, vendor stays the same and the browser uses it from the cache. HTTP/2 and HTTP/3 carry many requests in parallel over the same connection; the cost of the request count dropped. So the decision now depends less on "how many requests" and more on "which files stay unchanged across deploys".
In Vite 8 you make this decision with Rolldown's codeSplitting option. We added a vendor mode to the widget's config:
// npx vite build --mode vendor: node_modules goes into its own long-lived chunk
...(mode === "vendor" && {
    build: {
        rolldownOptions: {
            output: {
                codeSplitting: {
                    groups: [{ name: "vendor", test: /node_modules/ }],
                },
            },
        },
    },
}),
npx vite build --mode vendordist/assets/index-ovXL4q3W.js 2.10 kB │ gzip: 1.08 kB
dist/assets/vendor-BMhjzZUC.js 2.21 kB │ gzip: 1.04 kBWhen we changed the placeholder text in finder.ts and built again, the file became index-BFJAy8q9.js, while vendor-BMhjzZUC.js stayed the same. In the default single-file build (index-BvaywwEr.js, 2.02 kB gzipped), every change makes users download lodash-es's code again too. The price is one extra request and 0.10 kB gzipped. In this small widget the gain is negligible; but in a large project where application code changes often and dependencies rarely, a separate vendor chunk still makes sense.
The reverse is also true. In the previous post we saw that Angular's lazy chunks import main by its hashed name, so when main changes, the hashes of all lazy chunks change. Angular removed the vendorChunk option in the application builder and manages the chunk layout itself; in an Angular project you do not make this decision. If you make it in Vite, measure: groups can also change the order of side effects. The Rolldown docs recommend output.strictExecutionOrder for order-sensitive modules.
Analysis Tools: Which One for Which Bundler?
In the widget we also set up analysis for the Vite and webpack builds. On the Vite side, rollup-plugin-visualizer 7.1 supports Rolldown as a peer dependency and worked without problems with Vite 8:
npx vite build --mode analyze- `/node_modules/lodash-es/debounce.js`: 28.1% (2.51 KiB)
- ` vite/modulepreload-polyfill.js`: 13.0% (1.16 KiB)
- `/src/finder.ts`: 8.1% (737 B)
- `/node_modules/lodash-es/toNumber.js`: 7.7% (708 B)The plugin's markdown template writes this list to stats/list.md, and its treemap template writes an interactive HTML page to stats/treemap.html. The report's "Rendered" values are pre-minification sizes; the file itself is 4.26 kB while the report says 8.93 KiB. There is an interesting line in the list: Vite's modulepreload polyfill is 13 percent of the widget. If your browser target supports modulepreload, you can remove it with build.modulePreload.polyfill: false; we already did that for the backend integration in the Vite post of this series.
| Tool | Bundler | Input | Note |
|---|---|---|---|
ng build --stats-json plus a script or esbuild's web analyzer | Angular CLI, esbuild | metafile | With chunk optimization on, bytes are a proportional estimate |
rollup-plugin-visualizer | Vite, Rolldown, Rollup | plugin during the build | Treemap, sunburst, markdown; pre-minification size |
Vite DevTools (@vitejs/devtools) | Vite 8.3+ | devtools: true | Module, chunk and package views, comparing two builds; 0.8.2 at the time of writing, not tried in this post |
webpack-bundle-analyzer | webpack, Rspack | --json stats file | stat, parsed and gzip sizes separately |
source-map-explorer | All | final file and source map | Real bytes in the final file; needs --no-border-checks with Angular |
For webpack we added npm run analyze:webpack to the widget: first webpack --json=stats/webpack.json writes the stats file, then webpack-bundle-analyzer produces stats/webpack.html from it. We opened both HTML reports in Chromium and checked that they render without errors.
Production Notes
Do not leave analysis as a one-off job. Comparing the output of npm run analyze in pull requests catches the moment a large dependency slips in. Angular has a ready-made limit for this: budgets. We covered how to write budgets in the Angular series post "Angular Build and Deploy"; what matters here is that a budget stops the build when something exceeds it, while analysis shows what exceeded it. The two work together.
Shrinking the bundle is not a goal on its own. Going from 359 kB to 224 kB means users download and parse less JavaScript; but measuring its effect on LCP or INP with real user data is the topic of the Web Performance series.
When you replace a library that has behavior, such as dates or grouping, test the texts shown on screen. In our example the build succeeded, there were no warnings and the bundle was smaller; but the text of three of the eight books had changed.
Common Pitfalls
First, assuming tree shaking works when you use named imports from a CommonJS package. If the package is CommonJS, the whole file comes along; how you write the import does not change that.
Second, treating allowedCommonJsDependencies as a fix. It only silences the warning and does not touch the bundle.
Third, adding "sideEffects": false everywhere because it shrinks the bundle. A file with a side effect (a polyfill, a global style, a custom element that registers itself) then leaves the bundle without any warning.
Fourth, not checking the browser target when replacing a library with a built-in API. Object.groupBy works in Chrome but does not exist in Safari 17.0, which Angular 22 supports; the build tool does not add a polyfill.
Fifth, taking the number an analysis tool shows at face value. The stats file is a proportional estimate, the visualizer shows pre-minification size, and source-map-explorer shows the real bytes in the final file. When comparing, always use the same tool and the same measure.
A Small Experiment
★☆☆ Run npm run analyze in snapshot/06/web. Then stop loading the cart page as a lazy route, import it directly in app.routes.ts, and see how the src share in main changes.
★★☆ Add a date range filter to catalog-page.ts and write it with the ESM build of a date library (for example date-fns). Measure with npm run analyze how many modules come from the library and how much main grows; write the same thing with Intl and Date and compare.
★★★ In the widget, split the vendor group into two groups, one for lodash-es and one for the rest of node_modules (using priority). Write a script that, between two consecutive builds where only finder.ts changes, automatically reports which files got a new hash.
In the next post we look at the source maps we used for analysis here: the ECMA-426 format, hidden source maps in production, matching them up with error tracking services, and the risk of source maps leaking source code.