

Why Software Estimates Go Wrong: Estimate vs Target vs Commitment, the Cone of Uncertainty and the Planning Fallacy
Estimates go wrong because they are usually given as a single number, at the most uncertain moment and from an optimistic scenario; the honest answer is a range, a confidence level and assumptions. We cover estimate vs target vs commitment, the cone of uncertainty and the planning fallacy with C# code that processes the Bookstore team's estimation history for 12 features.
Version note: This post is based on the concepts in Steve McConnell's Software Estimation: Demystifying the Black Art (2006); the calculation example was built and run with .NET 10.
Make a Guess First
Monday morning, 16 November. Hakan from institutional sales drops by the team room of Bookstore, the online bookstore used as the shared example across this site's series. Nevin Hanım's school wants to place its spring term book order through the portal this year. For the Institutional Orders feature we worked out in the Requirements Analysis series, Hakan has one question: "Will it be ready by March 1?"
Emre answers without looking up from his screen: "Two months should do it." Hakan thanks him and leaves. In the afternoon, the email to Nevin Hanım contains this sentence: "Our institutional portal will be ready at the end of January."
Answer three questions before you read on. Was Emre's "two months" an estimate, a target or a promise? When Hakan sent the email, what did that sentence turn into, and who made the promise? Finally: if you knew how Emre's estimates for the last twelve features actually turned out, how would you correct "two months"?
Three Different Words: Estimate, Target and Commitment
In the first chapter of Software Estimation, McConnell separates these three concepts, because most fights about estimates start when they get mixed up. In our own words:
| Concept | What it says | Where it comes from | In Bookstore |
|---|---|---|---|
| Estimate | A prediction of how long the work takes that carries its uncertainty with it; by nature a range | The team doing the work | "With what we know today, between 8 and 14 weeks" |
| Target | A desired outcome from outside the work: a date, a budget, a scope | The business, a customer, the market | "March 1, for the school's spring order" |
| Commitment | A promise to deliver a given scope by a given date; it accepts the risk | The person or team who will keep it | "On March 1 they can paste a list and place an order" |
The three are independent. The target existed before any estimate; the school's calendar set March 1, not the team's speed. A commitment does not have to equal the estimate either. If the estimate says "10 weeks with 50% probability", the team can promise a more cautious date, or keep the date and promise a smaller scope. What matters is that whoever makes the promise has seen the estimate and takes the risk knowingly.
In the hallway conversation all three got mixed up. Hakan asked whether a target was reachable. Emre gave a number without breaking anything down; at best a rough estimate. The email then turned that number into a commitment without the person who said it knowing. On top of that, "two months" became "end of January" in the email, and details such as the New Year week and the sprint start date got lost.
McConnell's advice at this point is to fix the question itself: when someone asks for an estimate, what they often really ask is "can we hit this target?" The answer to that question is not a number but a plan: "What scope can we deliver by March 1, and how sure are we?" That is what Hakan actually needed.
The Cone of Uncertainty
The second key idea is how wrong an estimate can be depending on when in the project it is made. The idea comes from outside software, from cost estimation in engineering and construction. Barry Boehm adapted it to software in Software Engineering Economics in 1981; McConnell gave it the name "cone of uncertainty" in Software Project Survival Guide in 1997.
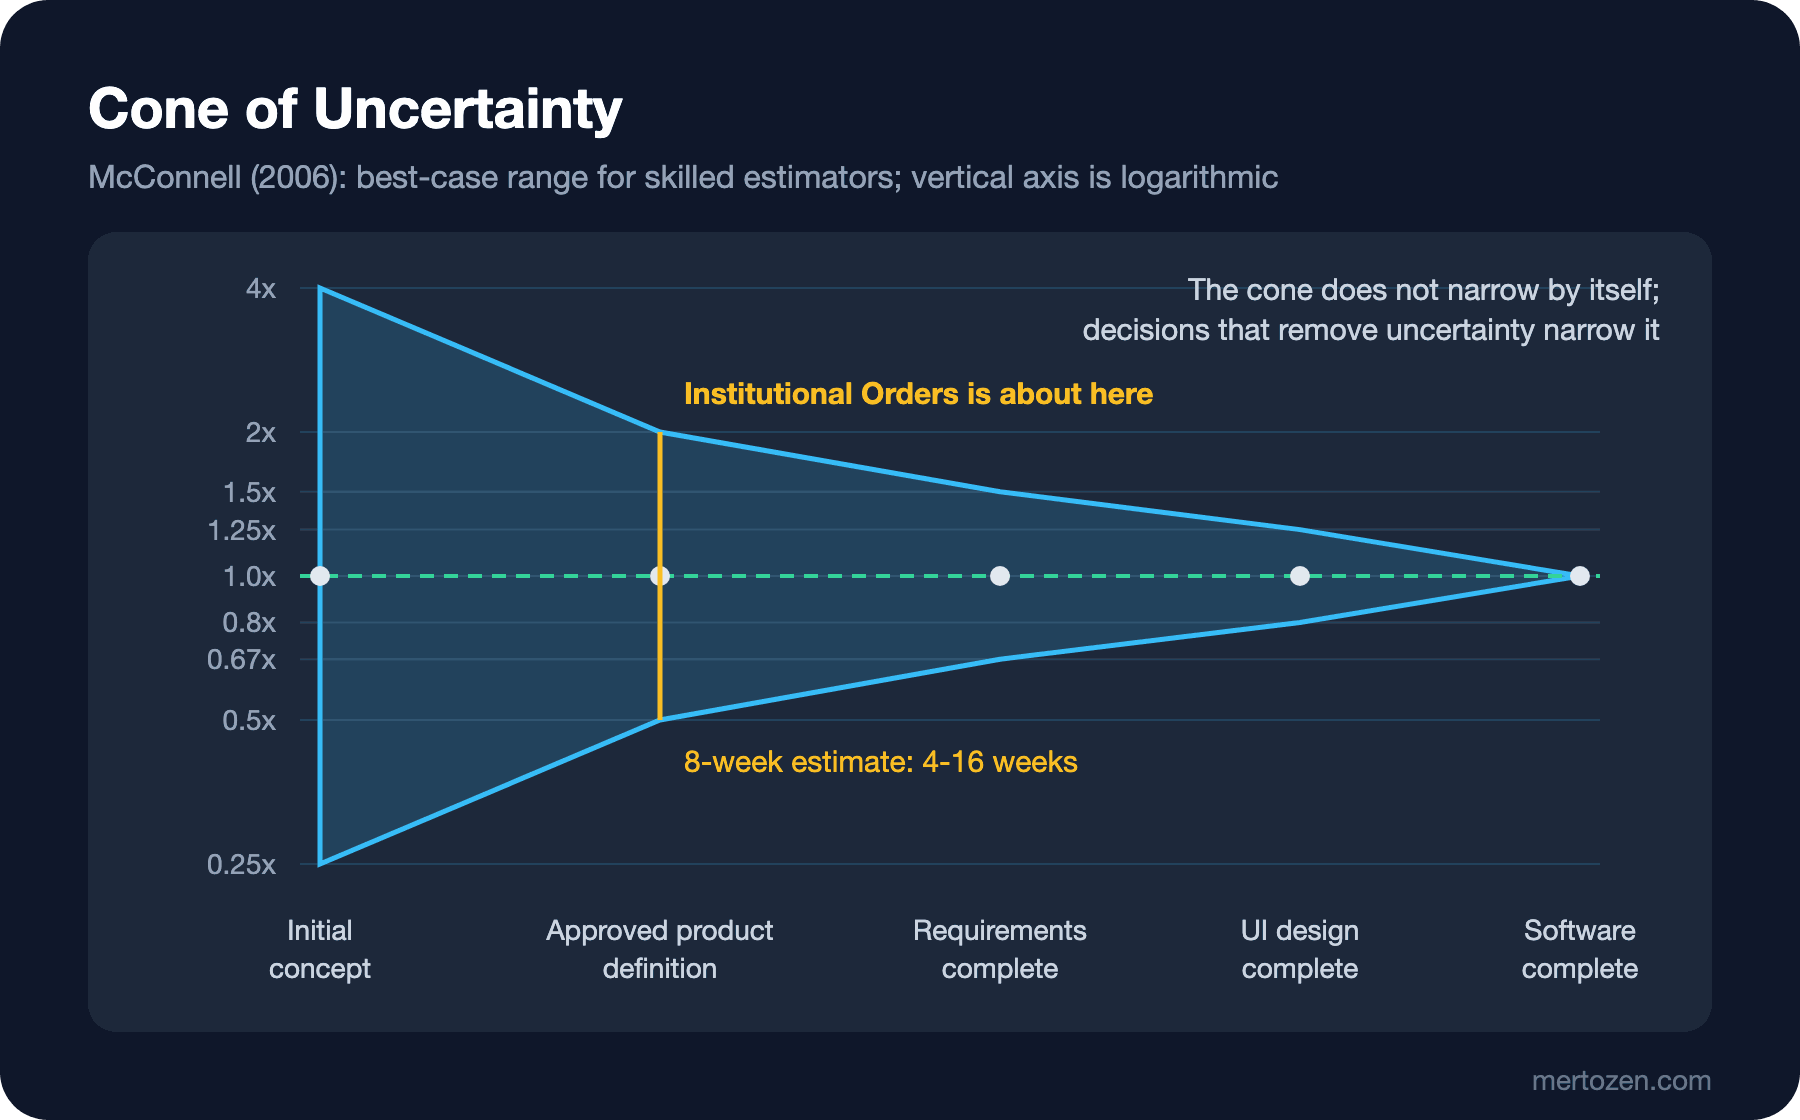
Using the values in McConnell's white paper published by Construx: an estimate made at the initial concept stage can be anywhere from 0.25 to 4 times the actual, a 16x spread between the lowest and highest ends. Once the product definition is approved the range shrinks to 0.5x–2x, to 0.67x–1.5x when requirements are complete and to 0.8x–1.25x when the user interface design is done.
Three details are often missed when reading this chart. First, the cone shows the best case. According to McConnell these ranges are the accuracy skilled estimators achieve; doing worse is easy, doing better only happens by luck. Second, the cone does not narrow just because time passes. What narrows it is decisions that remove uncertainty: deciding what the product will and will not do, pinning down requirements, designing the screens. Without those decisions you get, in McConnell's words, a cloud that persists to the end of the project instead of a cone. Third, most of the narrowing happens in the first 20–30% of the project's calendar time, and McConnell says meaningful commitments become possible from that point on.
The picture is a bit different for iterative teams. If requirements are clarified at the start of every iteration, each iteration goes through its own small cone: within a two-week sprint the range narrows in a few days. The price is long-range predictability: a team that clarifies requirements sprint by sprint can say less about the scope and date three months out.
Where does Institutional Orders stand today? In the Requirements Analysis series we built the story map and chose the skeleton of the first release. But the details of delivery points, how the invoice reaches accounting and the full institutional discount rules have not been discussed yet. That is close to an approved product definition. At this point Emre's 8 weeks means something between 4 and 16 weeks.
Code: The Cone and the Team's Own History
The cone's ratios come from the industry at large. The team's own history says something more concrete: how wrong are we, usually, when we estimate? The Bookstore team has kept the first estimate and the actual working days for the last twelve features in a table, and noted next to each which forgotten work caused most of the delay. Throughout this series we will do every calculation in a single console app:
dotnet new console -n Bookstore.Planning -o src/Bookstore.PlanningA small percentile helper we will use throughout the series:
namespace Bookstore.Planning;

public static class Stats
{
    // Nearest-rank percentile; the list must already be sorted
    public static T Percentile<T>(IReadOnlyList<T> sorted, double p)
    {
        int rank = (int)Math.Ceiling(p / 100.0 * sorted.Count);
        return sorted[Math.Clamp(rank, 1, sorted.Count) - 1];
    }
}
The cone's ranges and the team's history:
namespace Bookstore.Planning;

public sealed record ConePhase(string Milestone, double Low, double High);

public sealed record PastFeature(string Name, int EstimatedDays, int ActualDays, string Forgotten)
{
    public double Ratio => (double)ActualDays / EstimatedDays;
}

public static class Cone
{
    // McConnell (2006): best-case ranges for skilled estimators
    static readonly ConePhase[] Phases =
    [
        new("Initial concept", 0.25, 4.0),
        new("Approved product definition", 0.5, 2.0),
        new("Requirements complete", 0.67, 1.5),
        new("UI design complete", 0.8, 1.25),
    ];

    // Bookstore: the last 12 features, estimated vs. actual working days
    static readonly PastFeature[] History =
    [
        new("GiftCards", 15, 24, "payment provider sandbox"),
        new("Coupons", 10, 13, "code review rounds"),
        new("Returns", 20, 31, "data migration"),
        new("StockReservation", 12, 15, "load test"),
        new("ShipmentTracking", 8, 7, "-"),
        new("CampaignPricing", 10, 16, "data migration"),
        new("InvoicePdf", 5, 9, "deployment"),
        new("SearchRelevance", 15, 18, "code review rounds"),
        new("CartReminder", 6, 6, "-"),
        new("AuthorPages", 4, 5, "deployment"),
        new("ThreeDSecure", 12, 25, "payment provider sandbox"),
        new("AdminReports", 10, 14, "load test"),
    ];

    public static void Run()
    {
        const double gutWeeks = 8; // Emre's first answer: "two months should do it"

        Console.WriteLine($"Gut estimate: {gutWeeks} weeks");
        foreach (ConePhase phase in Phases)
            Console.WriteLine($"  {phase.Milestone,-28} {gutWeeks * phase.Low,5:F1} - {gutWeeks * phase.High,5:F1} weeks  (spread {phase.High / phase.Low:F1}x)");

        List<double> ratios = [.. History.Select(f => f.Ratio).Order()];
        int overran = History.Count(f => f.ActualDays > f.EstimatedDays);
        Console.WriteLine();
        Console.WriteLine($"Last {History.Length} features: {overran} overran, total {History.Sum(f => f.EstimatedDays)} estimated vs {History.Sum(f => f.ActualDays)} actual days");
        Console.WriteLine($"actual / estimate  p10 = {Stats.Percentile(ratios, 10):F2}  p50 = {Stats.Percentile(ratios, 50):F2}  p90 = {Stats.Percentile(ratios, 90):F2}");

        // Range corrected with our own history: p10..p90 = 80%
        double low = gutWeeks * Stats.Percentile(ratios, 10);
        double high = gutWeeks * Stats.Percentile(ratios, 90);
        Console.WriteLine($"80% range for an {gutWeeks}-week gut estimate: {low:F1} - {high:F1} weeks");

        Console.WriteLine();
        Console.WriteLine("Forgotten work behind the overruns:");
        foreach (IGrouping<string, PastFeature> g in History.Where(f => f.Forgotten != "-")
                     .GroupBy(f => f.Forgotten).OrderByDescending(g => g.Sum(f => f.ActualDays - f.EstimatedDays)))
            Console.WriteLine($"  {g.Key,-26} {g.Count()} features, +{g.Sum(f => f.ActualDays - f.EstimatedDays)} days");
    }
}
Program.cs only routes the command to the right class; in later posts we will add one line here each time:
using System.Globalization;
using Bookstore.Planning;

CultureInfo.CurrentCulture = CultureInfo.InvariantCulture;

switch (args.FirstOrDefault())
{
    case "cone": Cone.Run(); break;
    default: Console.WriteLine("Usage: dotnet run --project src/Bookstore.Planning -- cone"); break;
}
Let's run it:
dotnet run --project src/Bookstore.Planning -- coneGut estimate: 8 weeks
Initial concept 2.0 - 32.0 weeks (spread 16.0x)
Approved product definition 4.0 - 16.0 weeks (spread 4.0x)
Requirements complete 5.4 - 12.0 weeks (spread 2.2x)
UI design complete 6.4 - 10.0 weeks (spread 1.6x)
Last 12 features: 10 overran, total 127 estimated vs 183 actual days
actual / estimate p10 = 1.00 p50 = 1.30 p90 = 1.80
80% range for an 8-week gut estimate: 8.0 - 14.4 weeks
Forgotten work behind the overruns:
payment provider sandbox 2 features, +22 days
data migration 2 features, +17 days
load test 2 features, +7 days
code review rounds 2 features, +6 days
deployment 2 features, +5 daysReading the Output
The first block is the cone itself. The same 8-week answer means 2 to 32 weeks at the initial concept stage, 4 to 16 weeks once the product definition is approved and 5.4 to 12 weeks when requirements are complete. The number does not change; how much you can trust it does.
The second block is more uncomfortable. Ten of the last twelve features took longer than estimated; 127 days were estimated in total, 183 days were spent. That is 44% more. The median ratio is 1.30: a typical feature takes 30% longer than its estimate. Even the best 10% does not finish under the estimate but right on it (p10 = 1.00). In this team's history, "finished earlier than estimated" almost never happens.
Applying these ratios to Emre's answer gives an 80% range of 8.0 to 14.4 weeks. Starting today, that is between January 11 and February 24. The "end of January" in the email to Nevin Hanım sits in the optimistic half of this range, and March 1 lies just outside it. One caveat: the past estimates were at least given for work split into stories, while Emre's was given in a hallway. The real uncertainty is most likely wider than this range.
The third block shows where the delay comes from. The biggest item is the payment provider's sandbox: 22 days across two features. Data migration, load tests, code review rounds and deployment work follow. None of these is a surprise; all of them could have been known when the estimate was made, but they never made it onto the list. For Institutional Orders the equivalent list is clear: the invoice report that goes to the accounting system, moving the data of existing institutional customers and the performance of a 500-row order list.
Why Are We Always Optimistic?
This bias is not unique to the Bookstore team. In 1979 Daniel Kahneman and Amos Tversky described the tendency they called the planning fallacy: when people estimate how long their own work will take, they reason from an optimistic scenario even when they know similar work took longer in the past. In a 1994 study by Roger Buehler, Dale Griffin and Michael Ross, 37 psychology students were asked when they would finish their senior theses. The average prediction was 33.9 days, the actual average was 55.5 days, and only about 30% of the students finished within their own estimate. More strikingly, even the average of their worst-case estimates, given for the case where "everything goes wrong", was 48.6 days; reality was longer still.
There are several reasons for this. The first is that we estimate from the inside: we think through the steps one by one and picture each of them going smoothly. Interruptions, illness and another team's delays are not part of that picture. The second is anchoring: the first number mentioned in a conversation pulls later estimates towards itself. "March 1" was already in Hakan's question, and Emre's answer landed comfortably inside that date. Laboratory experiments by Magne Jørgensen and colleagues showed that even information unrelated to the work, such as how long the customer expects it to take, can shift estimates noticeably. In a 2011 field experiment with 46 software companies, Jørgensen and Stein Grimstad saw the effect again but much weaker. So anchoring is real, but it is not the whole explanation.
The third reason is forgotten work. Estimates are usually made for "writing the code". Preparing test data, fixes from code review, migrations, deployment, monitoring, documentation and meetings with other teams do not appear as separate lines in the estimate, but they take up space on the calendar. In the output above, all of the delay comes from this kind of work.
What Is an Estimate For?
Estimating has a cost too: the team's time. In his 2013 post PurposeOfEstimation, Martin Fowler treats estimation as neither good nor bad; as he puts it, "estimation is valuable when it helps you make a significant decision." The decisions Fowler lists are allocating resources, such as which of two options to build, coordinating across teams, such as when the warehouse team should add the delivery point field, and reassessing the plan when things change. He also counts the design discussion that estimation sessions trigger as a side benefit.
At Bookstore the decisions that depend on this estimate are clear. Hakan will decide what to tell Nevin Hanım about March 1. Selin, as Product Owner, will decide what scope goes into March 1 and whether Institutional Orders jumps ahead of other work. None of these decisions needs a single number; all of them need a range and an idea of what narrows it.
The other side of Fowler's point matters as well: if no decision depends on the estimate, a detailed estimate is waste. If the team works in priority order anyway and nobody plans around a date, estimating every story in hours helps nobody. We will come back to this idea under #NoEstimates in the second post.
Not a Number: A Range and a Confidence Level
An honest estimate has three parts: a range, the confidence level of that range and the assumptions behind it. The answer Emre should have given Hakan is roughly this: "With what we know today, 8 to 14 weeks with 80% probability, so between mid-January and the end of February. The range comes from our past estimation errors, and we don't know yet what the accounting report will look like. We'll size the stories within two weeks and narrow the range."
An 80% confidence level means that one in five estimates given this way will fall outside the range. That is not a weakness; you can widen the range to reach 95%, but then it becomes too wide to be useful. Which confidence level to pick depends on the decision: a promise to a school calls for 85–90%, while 50% may be enough for internal planning.
The most common way to hide uncertainty is padding, quietly adding a margin to the estimate. "I'll say two months; it's really six weeks plus two weeks of slack." Because padding is invisible, it cannot be managed: nobody knows what it is meant to cover, and it is the first thing to go when the schedule gets tight. A visible range carries the same information in the open. In the fourth post we will see how to turn the buffer into a visible line in the release plan.
The right moment for a commitment is when the cone has narrowed. Once the team has sized the stories in two weeks and pinned down the accounting report format, they will be able to tell Hakan: "This scope is certain for March 1, this scope is likely." Until then, the honest promise to Nevin Hanım is: "We will send you a firm date and scope on December 4."
In Production
Record your estimates. The whole calculation in this post rests on a single table: the first estimate, the actual duration and the reason for the delay. Without it, the only thing a team can say about its own error is "we're usually a bit late". You can keep the table in a spreadsheet or in your issue tracker with custom fields; we will see the Jira version in the Jira and Project Tools series. What matters is that the day the estimate was given, who gave it and with what information sit next to it. An estimate given before requirements were complete should not be compared on the same line with one given afterwards.
When you share an estimate in writing, keep the range and the assumption in the same sentence. Writing "between mid-January and the end of February, narrowing once the accounting format is clear" instead of "end of January" makes the email longer but prevents a wrong promise. And say up front when the estimate will be updated: every milestone where the cone narrows is a natural moment to re-estimate.
Common Pitfalls
- The hallway estimate becomes a contract: a number given without any breakdown ends up in an email, a slide deck or a contract without its author knowing.
- Using the target as the estimate: "it has to be ready by March 1" leads the team to shrink its estimate until it fits that date.
- Hidden padding: the uncertainty is buried inside the number, nobody can manage it and it is the first thing cut under pressure.
- Leaving forgotten work out of the estimate: testing, review, migration and deployment are part of every feature and need their own line in the estimate.
- Turning the estimate into a performance target: where developers who miss their estimates get questioned, estimates either get inflated or stop being given.
A Small Experiment
★☆☆ Put the first estimate and the actual duration of your last five pieces of work into the History array in Cone.cs and run the program. How many did you overrun, and what is your median ratio?
★★☆ Rewrite Hakan's email to Nevin Hanım: give the estimate, the target and the commitment in separate sentences; add the range, the confidence level and when the firm date will be communicated.
★★★ Add to the Cone class the case where the same work is re-estimated once requirements are complete: print the cone's range and the range from past ratios separately. Why might taking the intersection of the two ranges give you false confidence?
Emre's hallway answer was a number given by one person for work nobody had broken down. In the next post the team sizes the Institutional Orders stories together: story points, planning poker, t-shirt sizing and why story points are so contested.