

Release Planning: Velocity Ranges, Burn-Up, Fixed Date or Fixed Scope?

A release date comes not from one average velocity but from a range derived from past sprints; if the date is fixed, scope flexes in MoSCoW layers. Bookstore's 130-point Institutional Orders plan lands between February 12 and March 12, and the Must scope fits by March 1 even in the bad case. We also answer the same question with Monte Carlo and see why the two methods disagree.
Version note: The release plan and Monte Carlo code in this post were built and run with .NET 10; the meaning of velocity in Scrum follows the Scrum Guide 2020.
Make a Guess First
Friday, 20 November. The Release 1 backlog of Institutional Orders has been sized: 30 stories, 130 points. The team of Bookstore, the online bookstore used as the shared example across this site's series, starts Sprint 24 on Monday, and sprints are two weeks long. The velocities of the last 10 sprints are: 21, 17, 24, 19, 14, 22, 20, 23, 18, 22. The average is exactly 20.
The math looks easy: 130 / 20 = 6.5, rounded up to 7 sprints. The seventh sprint ends on Friday, February 26; three days before Hakan's March 1 target. Should Selin give Hakan this date? If she does, how likely do you think it is to hold: 50%, 70%, 90%? And if March 1 is not negotiable, because the school's ordering starts that day, what can the team change?
Velocity Is Not One Number
Velocity is the point total of the work a team brings to Done in a sprint. The Scrum Guide does not mention velocity; for Sprint Planning it only says that knowing their past performance makes the Developers more confident in their forecast. What velocity does and does not show within a sprint is covered in the Scrum series post "Scrum Metrics: What Velocity, Burndown and Sprint Goal Success Do and Don't Tell You". In this post we use velocity for one purpose only: roughly predicting a few sprints ahead.
Bookstore's velocity moves between 14 and 24. Using the average means assuming every sprint goes average; the same single-number problem we saw in the first post. In Agile Estimating and Planning and in his talks, Mike Cohn recommends expressing velocity as a range that matches your uncertainty: dividing the backlog total by the high velocity gives the shortest duration, dividing by the low velocity the longest.
There are many ways to pick the ends of the range. Taking the single lowest and highest sprint ties the range to one unusual sprint; the 14 in Sprint 18 came from a big story missing the end of the sprint. We use the average of the worst three sprints, the overall average and the average of the best three sprints. That is not a statistical formula but a deliberate choice: it describes a bad period by looking at three sprints, not one.
Code: A Release Plan with Ranges
We reuse the SprintHistory class from the second post as is. The new class answers three questions: if scope is fixed, what date range; if the date is fixed, what scope; and what does the flow view, Monte Carlo, say to the same question?
namespace Bookstore.Planning;

public static class ReleasePlan
{
    public static readonly DateOnly FirstSprintStart = new(2026, 11, 23); // Sprint 24, a Monday
    public static readonly DateOnly Target = new(2027, 3, 1);

    // Last working day of sprint n (2-week sprint, ends on a Friday)
    public static DateOnly SprintEnd(int n) => FirstSprintStart.AddDays(14 * (n - 1) + 11);

    public static (double Low, double Mean, double High) VelocityRange(Sprint[] history)
    {
        List<int> v = [.. history.Select(s => s.Velocity).Order()];
        return (v.Take(3).Average(), v.Average(), v.TakeLast(3).Average());
    }

    public static void Run()
    {
        Sprint[] history = SprintHistory.Last10;
        int scope = SprintHistory.Release1.Sum();
        (double low, double mean, double high) = VelocityRange(history);

        Console.WriteLine($"Scope: {scope} points. Velocity range (last {history.Length} sprints): worst-3 {low:F1}, mean {mean:F1}, best-3 {high:F1}");
        foreach ((string name, double v) in new[] { ("worst-3", low), ("mean", mean), ("best-3", high) })
        {
            int sprints = (int)Math.Ceiling(scope / v);
            Console.WriteLine($"  {name,-8} {sprints} sprints -> done by {SprintEnd(sprints):yyyy-MM-dd}");
        }

        // Fixed date: sprints that end before March 1 and the scope that fits
        int fixedSprints = Enumerable.Range(1, 20).Last(n => SprintEnd(n) < Target);
        (string Name, int Points)[] moscow = [("Must", 96), ("Should", 22), ("Could", 12)];
        Console.WriteLine();
        Console.WriteLine($"Fixed date {Target:yyyy-MM-dd}: {fixedSprints} sprints (last ends {SprintEnd(fixedSprints):yyyy-MM-dd})");
        foreach ((string name, double v) in new[] { ("worst-3", low), ("mean", mean), ("best-3", high) })
        {
            double capacity = fixedSprints * v;
            int cumulative = 0;
            string fits = string.Join(", ", moscow.TakeWhile(m => (cumulative += m.Points) <= capacity).Select(m => m.Name));
            Console.WriteLine($"  {name,-8} ~{capacity:F0} points -> {fits}");
        }

        // Flow view: Monte Carlo sampling past sprints (fixed seed)
        const int Runs = 10_000;
        Random rng = new(2026);
        int stories = SprintHistory.Release1.Length;
        List<int> byPoints = [.. Enumerable.Range(0, Runs).Select(_ => SprintsUntil(scope, () => history[rng.Next(history.Length)].Velocity)).Order()];
        List<int> byCount = [.. Enumerable.Range(0, Runs).Select(_ => SprintsUntil(stories, () => history[rng.Next(history.Length)].Throughput)).Order()];

        Console.WriteLine();
        Console.WriteLine($"Monte Carlo, {Runs:N0} runs: sprints needed (finish date)");
        Console.WriteLine($"  {"",4} {"by points (130)",-24} {"by count (30 stories)",-24}");
        foreach (int p in new[] { 50, 85, 95 })
        {
            int a = Stats.Percentile(byPoints, p), b = Stats.Percentile(byCount, p);
            Console.WriteLine($"  p{p}  {a} ({SprintEnd(a):yyyy-MM-dd}){"",8} {b} ({SprintEnd(b):yyyy-MM-dd})");
        }
        Console.WriteLine($"  P(done before {Target:yyyy-MM-dd}): by points {byPoints.Count(s => s <= fixedSprints) * 100.0 / Runs:F0}%, by count {byCount.Count(s => s <= fixedSprints) * 100.0 / Runs:F0}%");
    }

    static int SprintsUntil(int remaining, Func<int> nextSprint)
    {
        int sprints = 0;
        while (remaining > 0)
        {
            remaining -= nextSprint();
            sprints++;
        }
        return sprints;
    }
}
VelocityRange and SprintEnd are public because we will reuse them in the sixth post when we update the plan. We add case "release": ReleasePlan.Run(); break; to Program.cs and run it:
dotnet run --project src/Bookstore.Planning -- releaseScope: 130 points. Velocity range (last 10 sprints): worst-3 16.3, mean 20.0, best-3 23.0
worst-3 8 sprints -> done by 2027-03-12
mean 7 sprints -> done by 2027-02-26
best-3 6 sprints -> done by 2027-02-12
Fixed date 2027-03-01: 7 sprints (last ends 2027-02-26)
worst-3 ~114 points -> Must
mean ~140 points -> Must, Should, Could
best-3 ~161 points -> Must, Should, Could
Monte Carlo, 10,000 runs: sprints needed (finish date)
by points (130) by count (30 stories)
p50 7 (2027-02-26) 6 (2027-02-12)
p85 7 (2027-02-26) 7 (2027-02-26)
p95 8 (2027-03-12) 7 (2027-02-26)
P(done before 2027-03-01): by points 91%, by count 99%Reading the Output
The velocity range is 16.3, 20.0 and 23.0. With fixed scope, Release 1 takes 6 sprints and finishes on February 12 in the best case, 7 sprints and February 26 in the average case, 8 sprints and March 12 in the bad case. The sentence for Hakan should not be "February 26" but "between February 12 and March 12". March 1 is inside this range, but only three days past the average case.
Two things are not in this calculation. The first is the calendar: Sprint 26 runs from December 21 to January 1 and falls over New Year; leave will reduce that sprint's capacity. Capacity planning is covered in the Scrum series post "The Sprint and Sprint Planning: Why, What, How and the Sprint Goal"; here we will put it as an item on the risk list in the fifth post. The second is scope change: 130 points is what we know today, and according to the cone in the first post, requirements are not complete yet. Scope growth is almost certain.
Burn-Up: Keep the Scope Line Separate
The best way to show a release plan is a burn-up chart. A burndown shows remaining work; when scope grows the line jumps up or seems not to move at all, and the viewer cannot tell whether the team slowed down or the scope grew. A burn-up has two separate lines: work done and total scope. If the team slows down, the slope of the first line drops; if scope grows, the second line rises. Seeing them separately puts the answer to "why did the plan slip?", which we will discuss in the sixth post, into the chart itself.
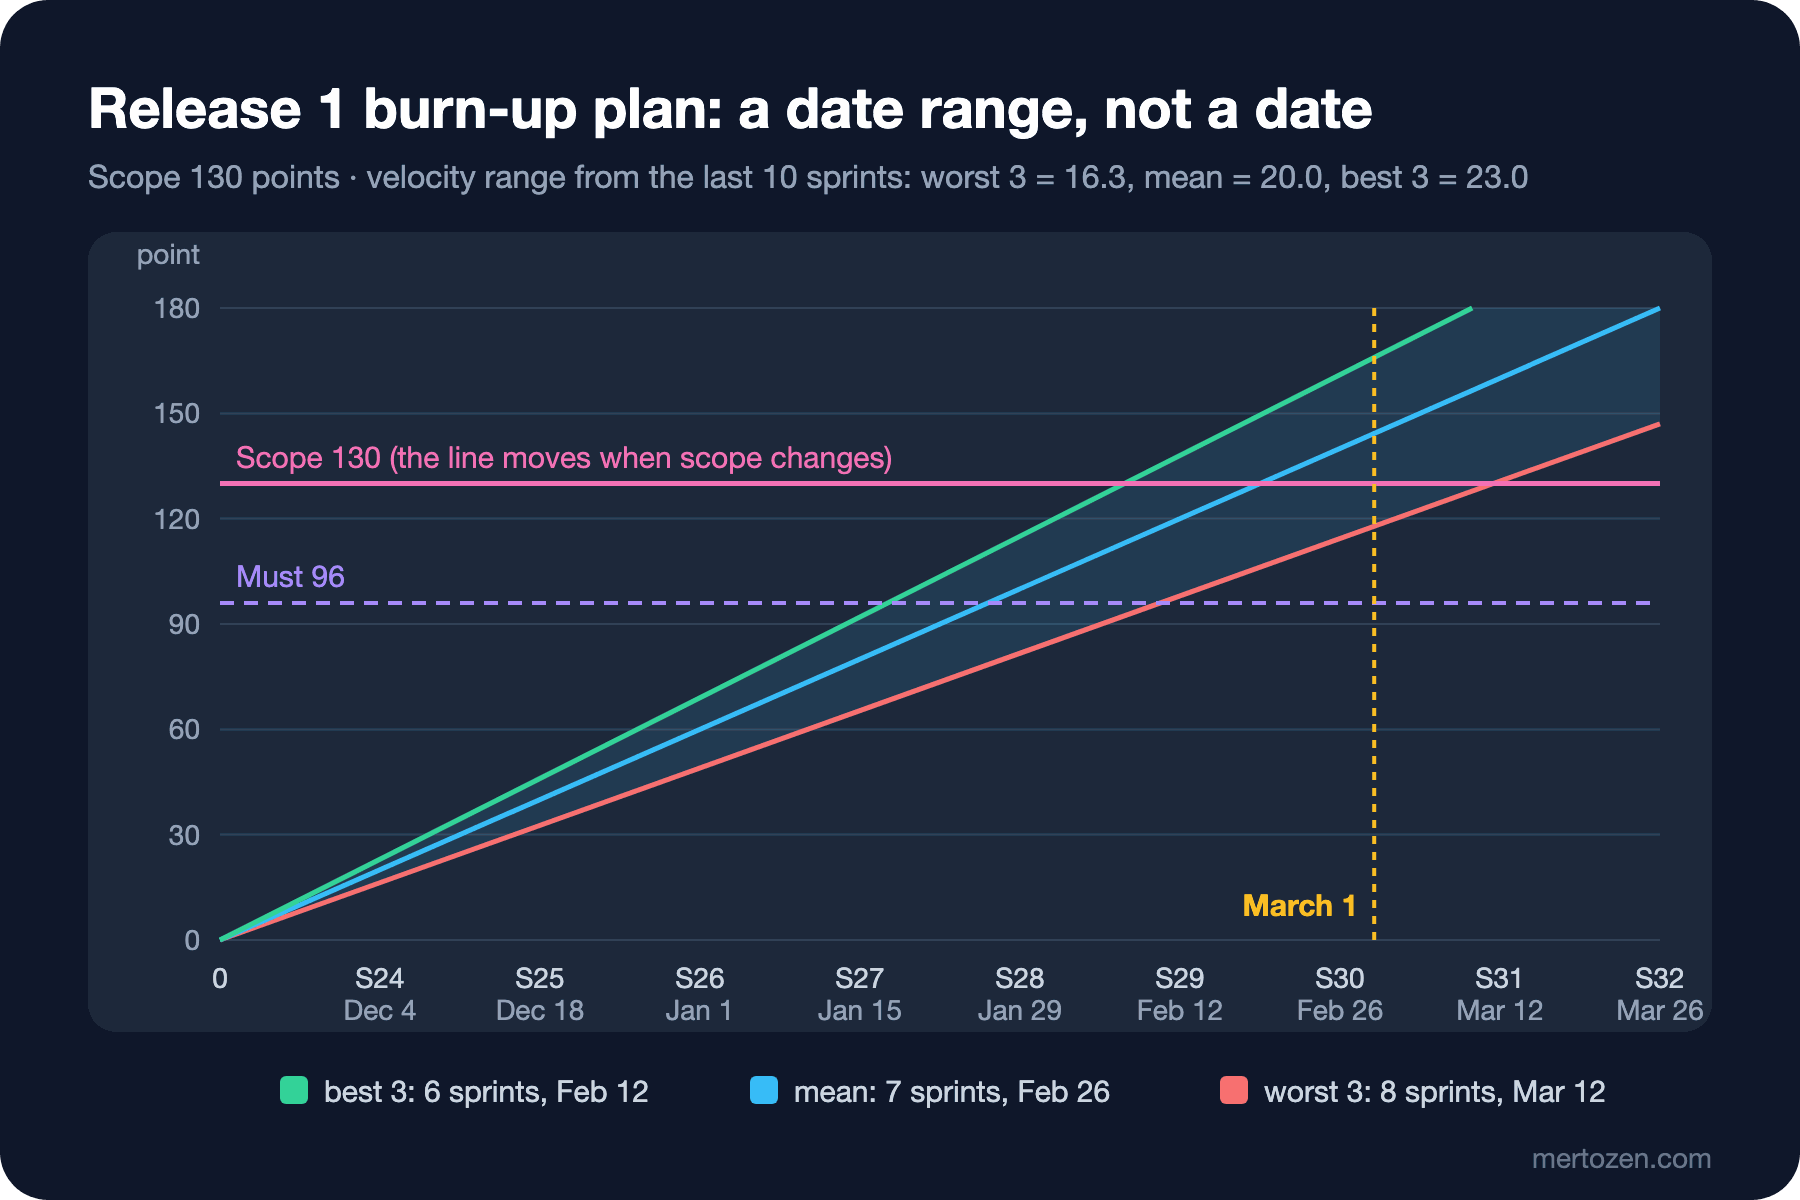
There is no single forecast line on the chart; there are three lines drawn with the velocity of the worst three, the average and the best three sprints, and a fan between them. Where the pink scope line crosses the fan is the date range. The dashed purple line is the total of the Must items; the topic of the next section. At the end of every sprint the actual work done is added to the chart as a point, and which edge of the fan the points stay close to says more about the date than any meeting.
Fixed Date or Fixed Scope?
The corners of the project triangle are scope, date and resources; some count quality as a fourth corner. In practice a release plan can fix at most one of them at a time. Agile teams usually keep resources, the team, and the date fixed and flex scope; the contract side of this debate is in the Agile Mindset series post "Agile Meets Reality: Fixed-Price Contracts, Deadlines and Architecture".
At Bookstore, March 1 comes from the school's calendar and does not move. The question then is not "when will it be done?" but "what will be done by March 1?" The second block of the code answers it: 7 sprints end before March 1. In the bad case about 114 points fit in those 7 sprints, 140 on average and 161 in the good case.
For this, Selin has classified the backlog with MoSCoW: Must have, Should have, Could have and Won't have. The Must items are 96 points: institution account, list pasting and validation, title matching, institutional discount, delivery points, ordering with a purchase order number and the daily invoice report for accounting. Should is 22 points: saving drafts, uploading an Excel file and the order confirmation email. Could is 12 points: reordering a past order and exporting the order list. Prioritization methods themselves are covered in the Introduction to Product Management series post "Prioritization Frameworks: RICE, MoSCoW, Kano and Cost of Delay".
According to the output, the Must items fit even in the bad case; Should and Could fit in the average and good cases. The commitment the team can give Hakan is no longer a date but layers of scope: "On March 1 the Must scope is certain. The Should items will most likely make it; if not, they arrive in mid-March. We are not promising the Could items." There is no hidden padding in that sentence: the Should and Could items sit in plain sight as the first things to drop if things go badly. That is a visible buffer.
For MoSCoW to work, the Must list has to stay genuinely small. DSDM, the framework that popularized MoSCoW, is maintained today by the Agile Business Consortium, which recommends that Must items usually stay under 60% of total effort; a higher share is only reasonable when estimates are known to be reliable. At Bookstore, Must is 74% of the 130 points and 84% of the 114-point capacity in the bad case. At that level the team is close to a fixed-scope commitment and flexibility shrinks. Selin would do well to ask whether one or two Must items can move down to Should.
If scope were fixed, that is, if the school would not move to the portal without the full scope, the answer would be a date range: "Between February 12 and March 12, most likely February 26." In that case the way to hit March 1 goes through risk, not scope: pulling uncertain work forward to narrow the range early. We will discuss that in the fifth post.
The Flow View: The Same Question with Monte Carlo
The last block of the code answers the same question with the method from the Kanban series post "Service Level Expectation and Monte Carlo": pick a past sprint at random, use its velocity or its number of finished stories, continue until the scope is done, and repeat that 10,000 times. By points, 7 sprints with 85% probability and 8 sprints with 95%; the probability of finishing before March 1 is 91%. By story count it is 99%.
Monte Carlo is much more optimistic than the average of the worst three sprints. The reason: the simulation draws every sprint independently, and over 7–8 sprints good and bad sprints balance each other out. Calculating with the worst-three average assumes all seven sprints go badly; with independent sprints that is very unlikely. Which is closer to reality? If sprints really are independent, Monte Carlo. But things like the New Year week, someone's long leave or growing scope affect several sprints together. Monte Carlo's 91% assumes scope stays at 130 and the coming sprints look like the last ten. Both are questionable in this plan.
The story-count simulation being even more optimistic continues the finding of the second post: Release 1's stories are bigger than the team's historical average. Counting does not see that difference.
Using both methods together is the most honest way. Monte Carlo says what the probability is if scope and team conditions resemble the past; the velocity range shows where the date can go if conditions get worse. The note to Hakan holds both: "If scope doesn't change, our probability of making March 1 is around 90%; but if scope grows or several sprints in a row go badly, it can slip to March 12. The Must scope is ready on March 1 either way."
Where a Dated Plan Meets an Outcome Roadmap
In the Introduction to Product Management series post "Building a Roadmap: Now-Next-Later and Outcome Roadmaps Instead of Feature Timelines" we discussed the problems of dated feature roadmaps. A release plan does not contradict that. On a Now-Next-Later roadmap, Institutional Orders sits in the "Now" column; it has a date range and scope layers here because there is a real external date and decisions depend on it. For the work in the "Next" and "Later" columns we give no dates: they are at the widest part of the cone from the first post.
The purpose of Release 1 is tied to the outcome on the roadmap, too: Gül in customer service should no longer need to type in the lists schools send by email. When discussing scope layers this sentence works as a filter. For every item on the Must list the question is "without this, would Gül still enter orders by hand?"; if the answer is no, the item moves down to Should.
In Production
Update the burn-up at the end of every sprint and show the same chart to everyone. A team that opens the chart only when there is bad news turns it into an alarm. Showing the fan, the actual points and the scope line together in every Sprint Review is the foundation of the no-surprise updates we will discuss in the sixth post.
Compute the velocity range over a sliding window. The last 10 sprints carry old information when the team or the kind of work changes. If someone joined the team or the technology changed, evaluate the sprints after the change separately. If a new team has no history at all, don't derive a release date before observing a few sprints; give a wide range for now and narrow it every sprint.
If points are inconsistent, the velocity range is meaningless too. The reference set and the bug rule from the second post pay off here: the 130 points have to be on the same scale as the points of the last 10 sprints. How to get these reports out of a tool like Jira is a topic for the Jira and Project Tools series.
Common Pitfalls
- Using velocity as a fixed number: "average 20, so February 26" is a promise that fails in one release out of two.
- Deriving a release date from a new team's first sprint: one sprint's velocity says almost nothing about a team.
- Hiding scope change with a burndown: when scope grows, the team looks like it slowed down.
- Inflating the Must list: when everything is Must, a fixed-date plan quietly becomes a fixed-scope plan.
- Presenting Monte Carlo's probability without conditions: the simulation assumes scope and team conditions stay the same.
- Keeping the buffer hidden: a margin nobody can see cannot be managed and is the first thing to vanish under pressure.
A Small Experiment
★☆☆ Compute VelocityRange with the worst and best two sprints instead of three. How did the date range change?
★★☆ Add scope growth to the Monte Carlo: write a line that adds a random 0 to 6 points to the scope in every simulated sprint. How far did the probability of finishing before March 1 drop from 91%?
★★★ Model New Year leave for Sprint 26: multiply the velocity drawn for that sprint by 0.6. Then write a variant that, instead of drawing sprints independently, draws three consecutive sprints together, picking a random starting point in the history and moving forward in order. How did the two changes affect the 91%?
The release plan gave a date range and scope layers, but the things that set the bad end of the range have no names yet: the accounting integration, the dependency on the warehouse team, New Year leave. In the next post we surface them with a pre-mortem, write them into a risk register and see how retiring risk early becomes part of the plan.