

What Happens When You Press Enter on a URL: End to End from DNS to Render
When you press Enter, the browser parses the URL, finds the IP with DNS, connects with TCP and TLS 1.3, sends the HTTP request and renders the response; a new connection spends at least three to four RTTs before the first byte. We read every phase line by line against our own Kestrel server with curl -v and curl -w.
Version note: The commands in this post were run with .NET 10 (ASP.NET Core 10 Kestrel), curl 8.7.1 and dig 9.10; the protocol descriptions follow RFC (Request for Comments) 9110 (HTTP Semantics) and RFC 9846 (TLS 1.3).
Guess First
You type https://bookstore.example/api/books into the browser's address bar and press Enter. You've never visited this domain before; the browser has neither an IP (Internet Protocol) address nor an open connection for it in its cache. How many round trips cross the network before the first byte of the response arrives from the server? One, two, four?
Second question: what happens to that number when you reload the same page a second later? In this post we'll map the journey of a request and open up each stop in the rest of the series. We'll measure the answer on my own machine, against my own Kestrel server, with curl.
The Whole Map
Between pressing Enter and the page being drawn on screen there are roughly five steps. The browser parses the URL (Uniform Resource Locator) and checks its own records. It uses DNS (Domain Name System) to turn the domain name into an IP address. It opens a TCP (Transmission Control Protocol) connection to that address. It builds an encrypted channel on top of the connection with TLS (Transport Layer Security). Only then does it send the actual HTTP (Hypertext Transfer Protocol) request, receive the response, parse it and render it.
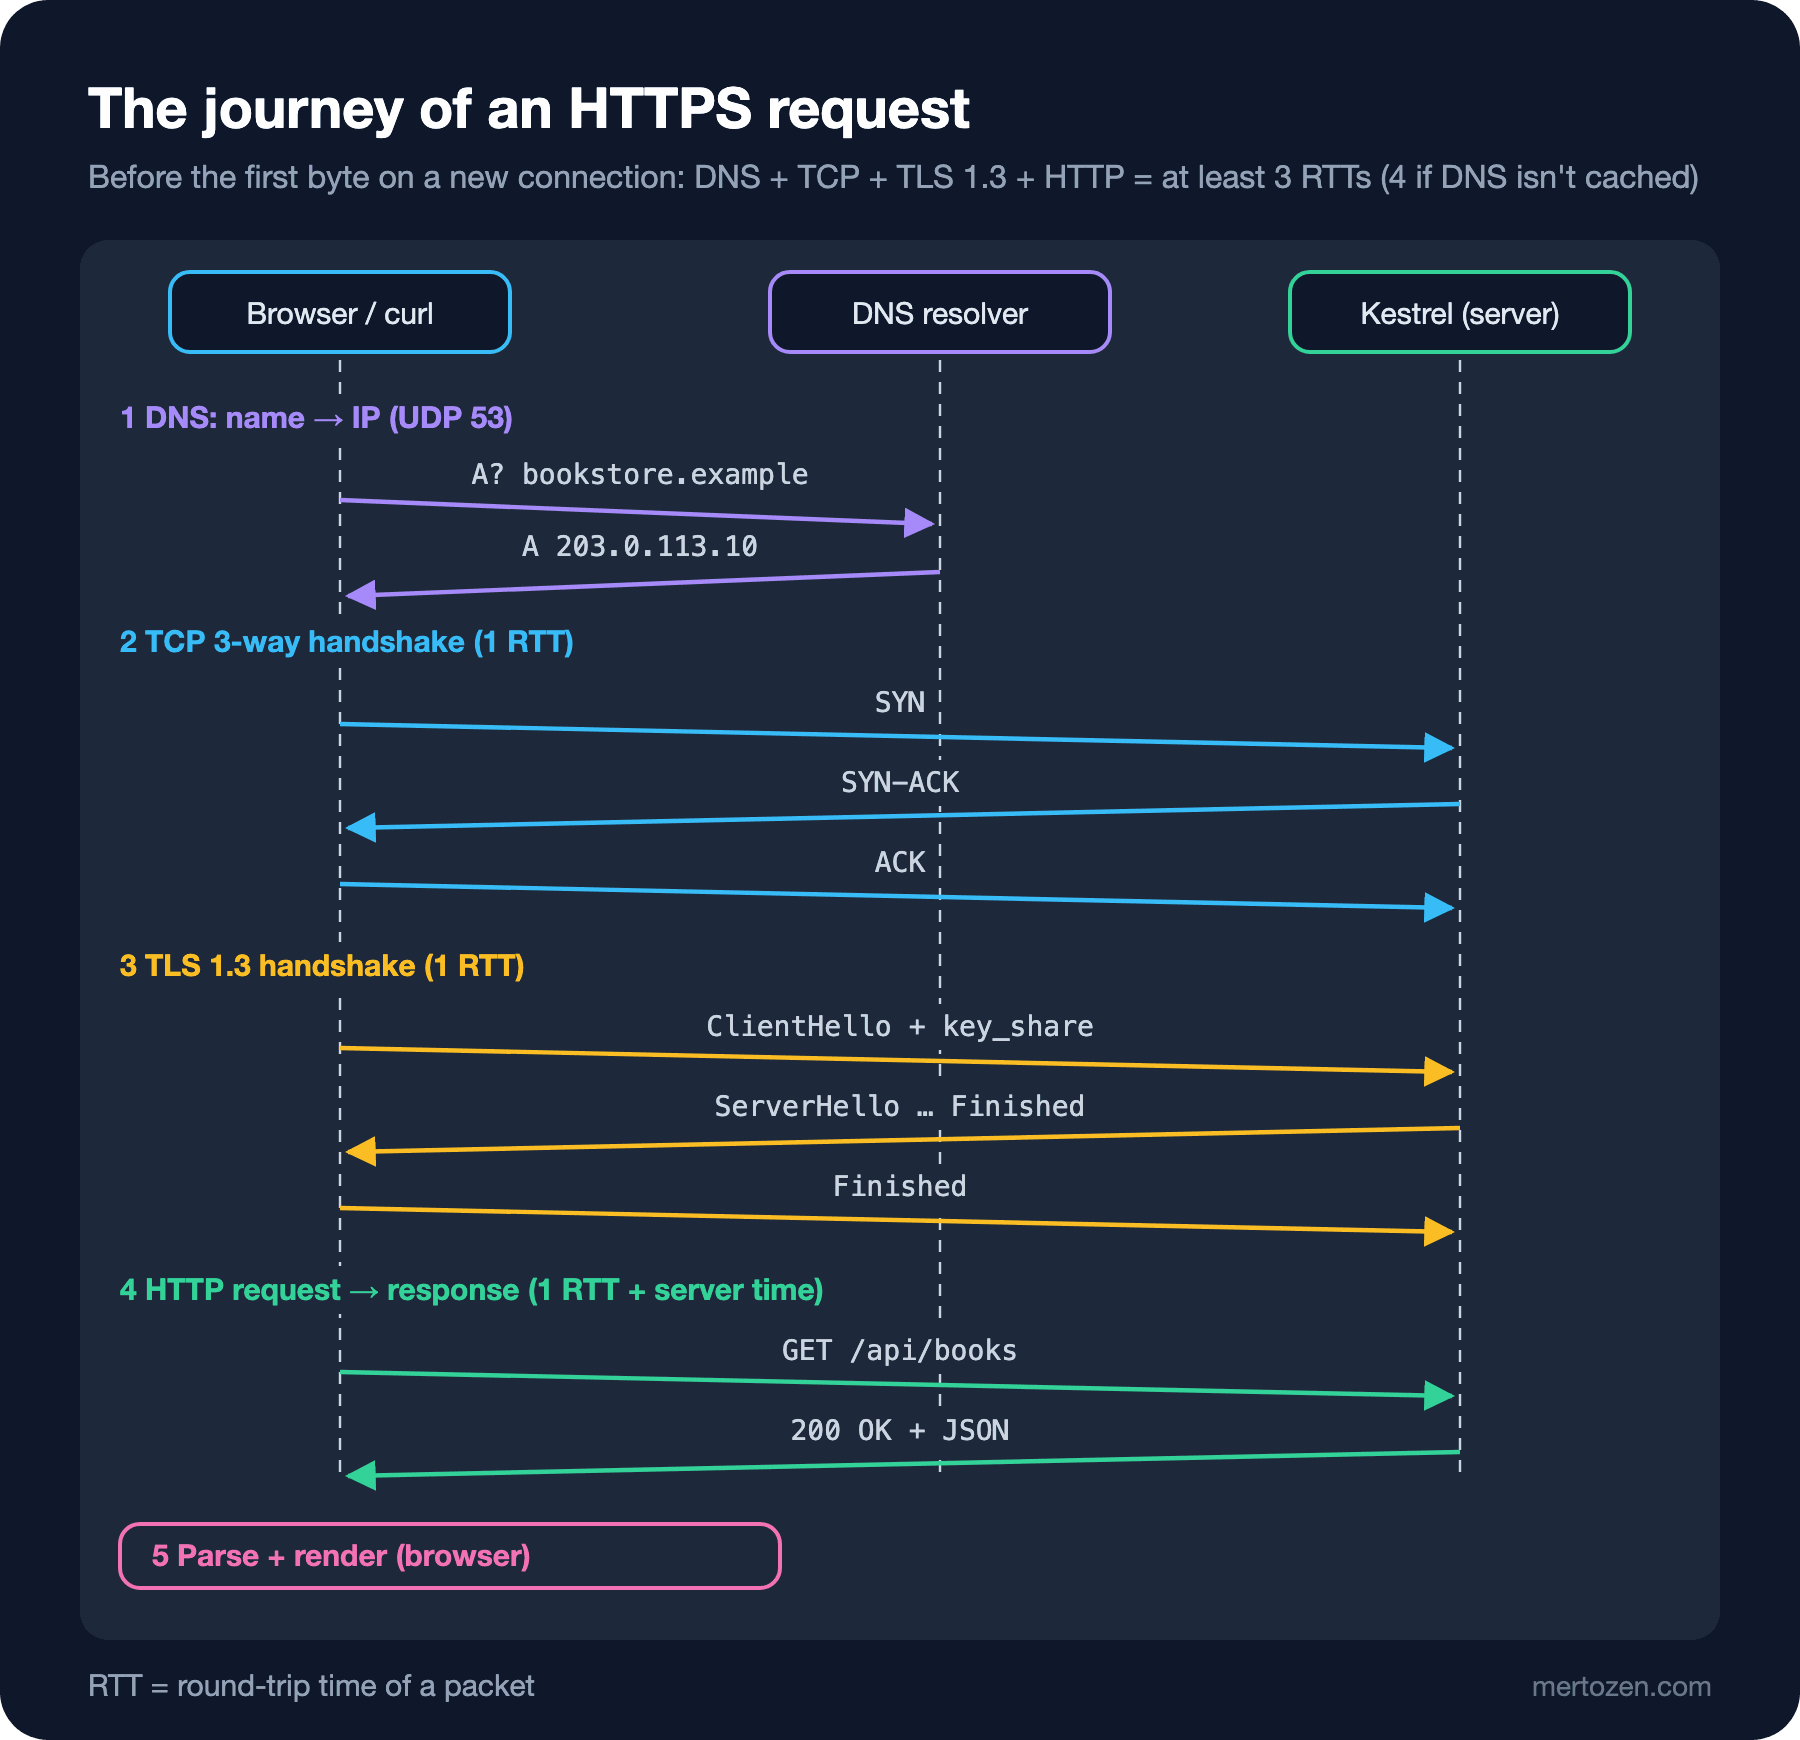
The diagram also answers the guessing question. If DNS isn't cached, one round trip (RTT, round-trip time) goes to DNS. TCP's 3-way handshake is one RTT. The TLS 1.3 handshake is one RTT. The HTTP request and response are one RTT plus the server's processing time. At least four RTTs in total; three if DNS is cached. If the server is in Frankfurt and the RTT from Istanbul is 50 milliseconds, 150–200 milliseconds are spent before the server runs a single line of code. When you reload the page and the connection stayed open (keep-alive), only the last step repeats.
The rest of the series opens the stops on this map in order: IP addresses, ports and NAT (Network Address Translation) in the second post; TCP in the third; DNS in the fourth; TLS 1.3 in the fifth. Then we move to HTTP: HTTP/1.1 on the wire in the sixth post, caching in the seventh, HTTP/2 in the eighth, HTTP/3 and QUIC (a transport protocol over UDP (User Datagram Protocol) whose name is no longer treated as an acronym) in the ninth. In the last post we bring it all together to diagnose a slow request.
From URL to IP: Local Checks and DNS
The first thing the browser does is break the URL apart: scheme (https), host (bookstore.example), port (443 for https if not written), path (/api/books) and the query string if there is one. Before going to the network it does a few local checks. If the domain is on the HSTS (HTTP Strict Transport Security) list, it turns the request straight into https:// even if http:// was typed. If a fresh response for the same resource sits in the HTTP cache, it may not go to the network at all; we cover that in the seventh post of the series. The ASP.NET Core side of HSTS, together with CORS (Cross-Origin Resource Sharing) and HTTPS (HTTP Secure) redirection, is covered in the ASP.NET Core Web API (Application Programming Interface) series, in "CORS and Security in ASP.NET Core Web API: HTTPS, HSTS, Headers and Secrets".
Then comes name resolution. The browser and the operating system first check their own caches and the /etc/hosts file. To see what the operating system's resolver returns for localhost on macOS:
$ dscacheutil -q host -a name localhost
name: localhost
ipv6_address: ::1

name: localhost
ip_address: 127.0.0.1
localhost resolves to two addresses, and the IPv6 address (::1) comes first. This detail shows up in the curl output in a moment. For a real domain, if there's nothing in the local records, the query goes to a recursive resolver on the network. A query sent to the resolver on my home network:
$ dig example.com A +noall +answer +stats
example.com.		132	IN	A	104.20.23.154
example.com.		132	IN	A	172.66.147.243
;; Query time: 16 msec
;; SERVER: 192.168.8.1#53(192.168.8.1)
Two A records, each with a TTL (Time To Live) of 132 seconds: the resolver will keep this answer cached for another 132 seconds. The query took 16 milliseconds. The chain to the root, TLD (Top-Level Domain) and authoritative servers when the resolver doesn't know the answer, the record types and the production effects of TTL are covered in detail in the fourth post of the series.
Reading curl -v Line by Line
To make the map concrete I wrote a small copy of the Bookstore API with Kestrel and ran it in a Linux container. The server uses a certificate signed by a local CA (Certificate Authority) I created; I introduce that CA to curl with --cacert. First, the start of the output when connecting via localhost:
$ curl -v --http1.1 --cacert certs/ca.crt https://localhost:5592/api/books/1
* Host localhost:5592 was resolved.
* IPv6: ::1
* IPv4: 127.0.0.1
*   Trying [::1]:5592...
* connect to ::1 port 5592 from ::1 port 62043 failed: Connection refused
*   Trying 127.0.0.1:5592...
* Connected to localhost (127.0.0.1) port 5592
The first four lines are the DNS step: localhost resolved to two addresses. curl tried IPv6 first and was refused, because the container's port is published only on 127.0.0.1. Then it fell back to IPv4 and connected. The "Connected" line is the moment TCP's 3-way handshake completed. The refusal here was instant; but if a firewall had silently dropped the packet, curl would have waited a while before moving to IPv4. We look at that trap in the second post. The rest of the output for the same request made directly to 127.0.0.1:
*   Trying 127.0.0.1:5592...
* Connected to 127.0.0.1 (127.0.0.1) port 5592
* ALPN: curl offers http/1.1
* (304) (OUT), TLS handshake, Client hello (1):
} [293 bytes data]
*  CAfile: certs/ca.crt
*  CApath: none
* (304) (IN), TLS handshake, Server hello (2):
{ [122 bytes data]
* (304) (IN), TLS handshake, Unknown (8):
{ [21 bytes data]
* (304) (IN), TLS handshake, Certificate (11):
{ [456 bytes data]
* (304) (IN), TLS handshake, CERT verify (15):
{ [78 bytes data]
* (304) (IN), TLS handshake, Finished (20):
{ [52 bytes data]
* (304) (OUT), TLS handshake, Finished (20):
} [52 bytes data]
* SSL connection using TLSv1.3 / AEAD-AES256-GCM-SHA384 / [blank] / UNDEF
* ALPN: server accepted http/1.1
* Server certificate:
*  subject: CN=bookstore.localhost
*  start date: Nov  8 09:39:16 2026 GMT
*  expire date: Dec  8 09:39:16 2026 GMT
*  subjectAltName: host "127.0.0.1" matched cert's IP address!
*  issuer: CN=Bookstore Local Root CA
*  SSL certificate verify ok.
* using HTTP/1.x
> GET /api/books/1 HTTP/1.1
> Host: 127.0.0.1:5592
> User-Agent: curl/8.7.1
> Accept: */*
>
* Request completely sent off
< HTTP/1.1 200 OK
< Content-Type: application/json; charset=utf-8
< Date: Sun, 08 Nov 2026 09:59:52 GMT
< Server: Kestrel
< Transfer-Encoding: chunked
<
{ [67 bytes data]
* Connection #0 to host 127.0.0.1 left intact
{"id":1,"isbn":"978-0000000001","title":"Title 1","price":11}
Let's go line by line. ALPN: curl offers http/1.1: ALPN (Application-Layer Protocol Negotiation) is the extension inside the TLS handshake where the client says which HTTP versions it can speak; here it only offered HTTP/1.1 because I passed --http1.1. The lines marked OUT and IN are TLS messages: the client's Client hello, the server's Server hello, then the encrypted extensions (this macOS build of curl calls them "Unknown (8)"; their TLS 1.3 name is EncryptedExtensions), the certificate, the CERT verify that proves possession of the private key, and Finished from both sides. All of the server's messages arrive in a single flight; that's TLS 1.3's 1-RTT handshake. Then curl checks the certificate's identity: is the host it connected to in the SAN (Subject Alternative Name) field, and does the signature chain lead to a CA it trusts? SSL certificate verify ok says both passed.
Lines starting with > are the outgoing HTTP request, lines starting with < the incoming response. The request is four lines: method, path and version; the Host header; the User-Agent where curl introduces itself; and the content types it accepts. The response has a status line, headers and a body. Transfer-Encoding: chunked stands out: because Kestrel doesn't know the size of the JSON (JavaScript Object Notation) in advance while writing it, it sends the body in pieces instead of using Content-Length. We'll read that framing off the wire in the sixth post. The left intact on the last line says the connection wasn't closed and is kept open for the next request.
We covered HTTP itself and reading it with curl in "The Security Lab: A Bookstore API with ASP.NET Core 10 and Reading HTTP with curl" in the Web Security series; here our focus is the layers below HTTP.
Measuring the Phases: curl -w
-v shows what happened, not how long it took. curl's -w (write-out) option prints the moment each phase finished, in seconds since the start of the request. I prepared a format file:
namelookup: %{time_namelookup}s\n connect: %{time_connect}s\n appconnect: %{time_appconnect}s\n pretransfer: %{time_pretransfer}s\nstarttransfer: %{time_starttransfer}s\n total: %{time_total}s\n version: HTTP/%{http_version} remote: %{remote_ip}:%{remote_port}\nI sent two requests back to back in the same curl command to an endpoint that waits 120 milliseconds on the server before responding. curl reuses the first connection for the second request:
$ curl -s -w "@curl-format.txt" --cacert certs/ca.crt -o /dev/null 'https://localhost:5592/slow?ms=120' -o /dev/null 'https://localhost:5592/slow?ms=120'
   namelookup: 0.000009s
      connect: 0.000276s
   appconnect: 0.005367s
  pretransfer: 0.005408s
starttransfer: 0.133954s
        total: 0.134047s
      version: HTTP/2  remote: 127.0.0.1:5592
   namelookup: 0.000014s
      connect: 0.000000s
   appconnect: 0.000000s
  pretransfer: 0.000053s
starttransfer: 0.123424s
        total: 0.123567s
      version: HTTP/2  remote: 127.0.0.1:5592
The values are cumulative; a phase's duration is the difference between two consecutive values. In the first request DNS took 9 microseconds (localhost is local), the TCP connection 0.27 milliseconds (including the IPv6 attempt), the TLS handshake appconnect − connect = 5.1 milliseconds. The server sending the first byte (starttransfer − pretransfer) took 128.5 milliseconds; 120 of that is the wait I put there on purpose. In the second request connect and appconnect are zero: no new connection was opened, no handshake was done.
This measurement is on loopback; packets never leave the machine and RTTs are microseconds. On a real network the TCP and TLS phases are at least one RTT each, and the map's arithmetic kicks in. Even here TLS's 5 milliseconds stand out: there's no network cost on loopback, so that time is almost entirely cryptography and certificate validation. We'll see how to use these phases in a real slowness diagnosis in the last post of the series.
Layers: OSI and TCP/IP
It's no accident that the DNS, TCP, TLS and HTTP lines show up separately in the curl output; network protocols are designed in layers. Every layer uses the service of the one below and adds its own header to the data it sends. This is called encapsulation:
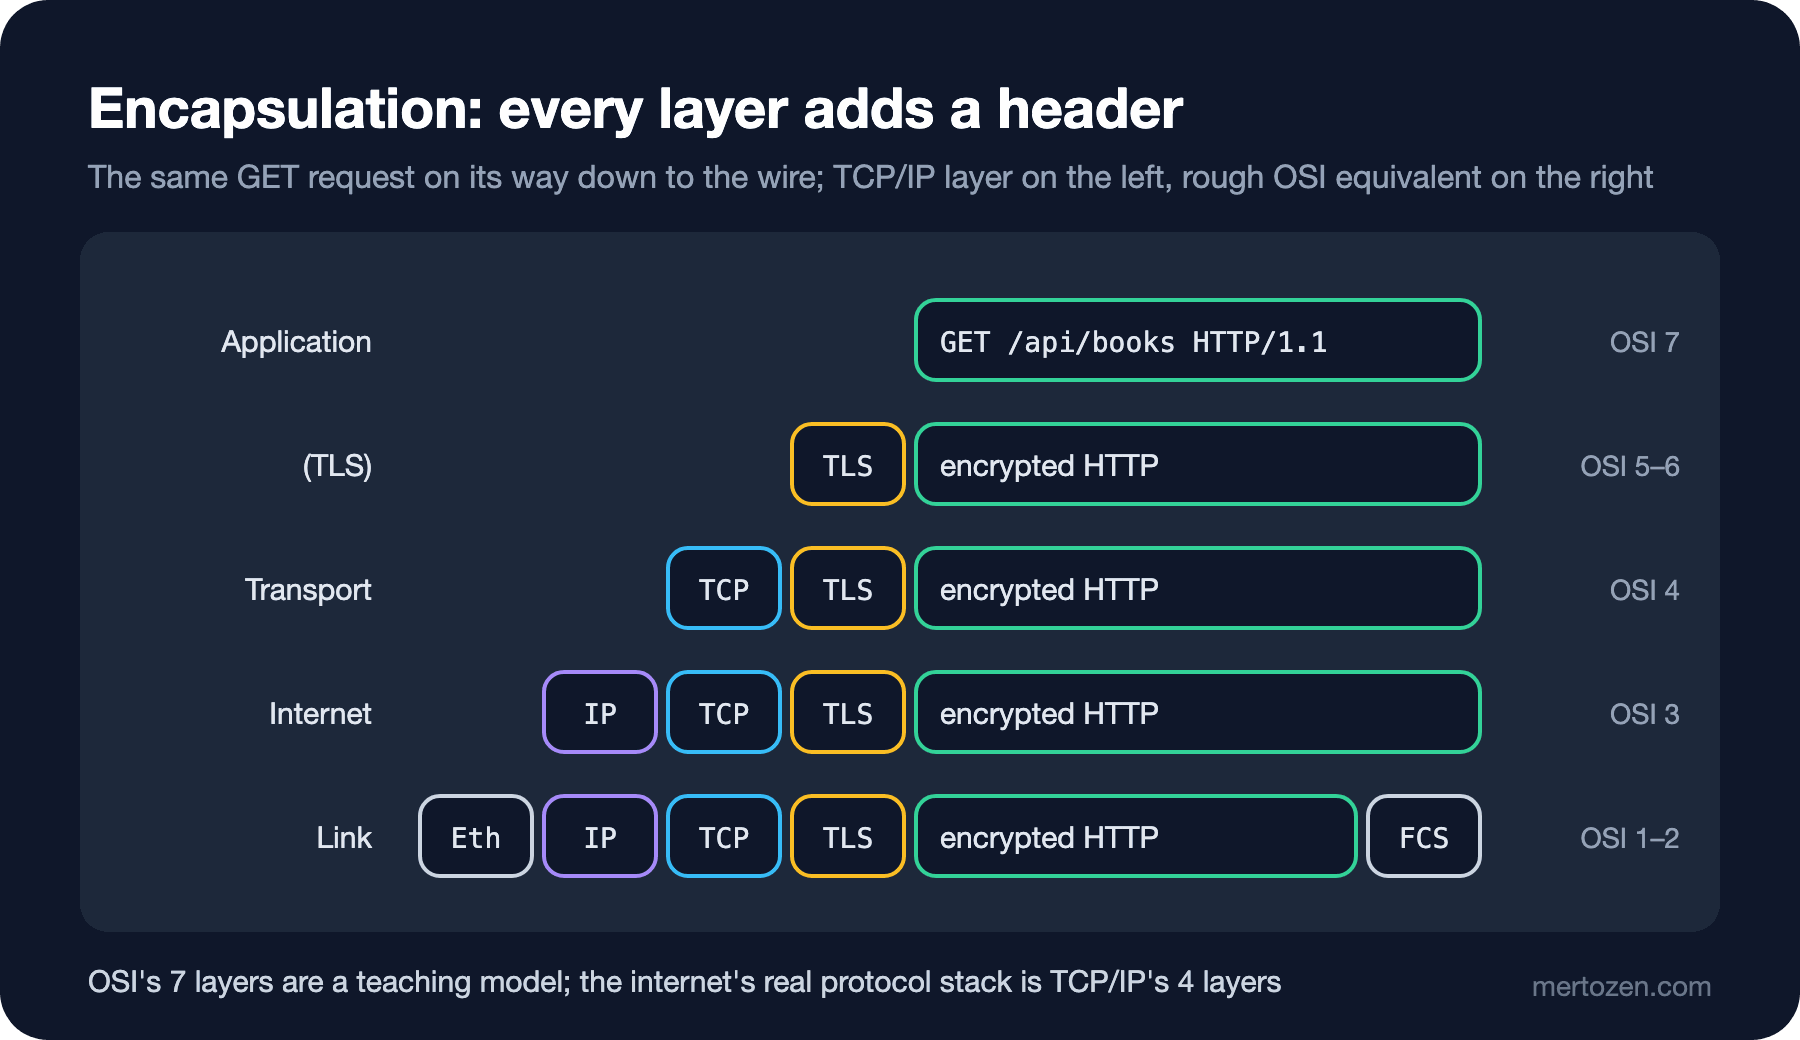
The HTTP message is encrypted inside a TLS record, the TLS record becomes the payload of a TCP segment, the TCP segment goes into an IP packet, and the IP packet goes out on the wire inside an Ethernet or Wi-Fi frame. On the other side each layer reads and strips its own header and hands the contents to the layer above.
Schools and interviews teach the seven layers of the OSI (Open Systems Interconnection) model. To be honest, OSI survived as a teaching and terminology model; the internet's real protocol stack is TCP/IP's four layers: link, internet, transport and application. You'll keep seeing OSI numbers in phrases like "Layer 4 load balancer" or "Layer 7 firewall"; they mean the transport and application layers. Which layer TLS belongs to isn't clear-cut: it sits above TCP, below HTTP, and roughly corresponds to OSI layers 5 and 6.
The Browser Side: DevTools Timing and Rendering
When you click a request in the browser DevTools' Network panel and open the Timing tab, you see the same phases under different names; TLS's old name, SSL (Secure Sockets Layer), still lives on there. Their rough equivalents:
| DevTools Timing | curl -w equivalent | Meaning |
|---|---|---|
| Queueing, Stalled | none | Waiting inside the browser: priority, per-host connection limit |
| DNS Lookup | time_namelookup | Name resolution |
| Initial connection | time_connect | TCP handshake (shown including TLS) |
| SSL | time_appconnect − time_connect | TLS handshake |
| Waiting for server response (TTFB) | time_starttransfer − time_pretransfer | Time to the first byte |
| Content Download | time_total − time_starttransfer | Downloading the body |
The TTFB (Time To First Byte) column is the most misread value: it contains both one RTT and the server's processing time. Once the browser has the response, the second half of the work begins: the HTML (HyperText Markup Language) is parsed, new requests go out for CSS (Cascading Style Sheets) and JavaScript, layout is computed and the screen is painted. The rendering pipeline and Core Web Vitals are the topic of the upcoming Web Performance series; using the DevTools panels is covered in the upcoming Browser DevTools series. In this series we stay with the network itself.
In Production
The most expensive thing on the map is setting up a connection. A new connection means at least two RTTs (TCP + TLS), and that cost climbs to hundreds of milliseconds for a server far from the client. That's why reusing connections (keep-alive, many requests over one connection in HTTP/2) and servers close to users, i.e. a CDN (Content Delivery Network), are the biggest wins in the real world. We'll see how connection reuse breaks with HttpClient in .NET in the third post.
When a slowness complaint comes in, the first job is separating the phases. "The API is slow" can mean slow DNS, slow connection setup, a slow server or a slow download, and each has a different fix. Attaching curl -w output or DevTools Timing to the ticket as numbers rather than screenshots is the fastest way to route the problem to the right team.
Measure from where the user is. The 5 milliseconds you measure with curl localhost on the server itself will never show the 600 milliseconds the user experiences on a mobile network.
Common Pitfalls
Taking TTFB for server time. TTFB includes an RTT; for a distant client, 150 of a 200-millisecond TTFB can be the network.
Generalizing loopback measurements. On the local machine TCP and TLS look almost free; on a real network each is at least one RTT.
Thinking localhost is a single address. It resolves to two and IPv6 is usually tried first; if your server only listens on IPv4, every connection makes a failed attempt first.
Reading too much into OSI layer numbers. Real protocols don't fit those boxes exactly; read L4 (Layer 4) and L7 (Layer 7) as transport and application.
Getting past a certificate error with -k. curl -k turns validation off entirely; even in local testing the right way is to introduce the CA with --cacert, as in this post.
A Small Experiment
★☆☆ Run dig on your machine for the domain of a site you use often and note the TTL. Run it again a minute later: how did the TTL change, and why?
★★☆ Send requests to any local ASP.NET Core app with this post's curl-format.txt. Measure connection reuse by passing two URLs in the same command and a new connection with two separate curl commands. How big is the appconnect difference?
★★★ Open the DevTools Network panel in a browser and make the same request twice; match the values in the Timing tab with the curl output. Which rows disappear on the second request? What does ticking "Disable cache" change?
The map's first stop is addresses. In the next post we go down to IP addresses, subnets, ports and NAT, and explain where this post's ::1 refusal, Docker's "it runs but I can't reach it" problem and the difference between localhost and 0.0.0.0 come from.