

Measuring Web Performance Correctly: Lab vs Field, CrUX, p75 and RUM in Angular with web-vitals

Web performance is measured not by a single Lighthouse score but by the 75th percentile (p75) of real users' LCP, INP and CLS, separately for mobile and desktop. The post explains why lab and field disagree, what CrUX collects and which browser can measure what in 2026; we collect RUM with web-vitals 6 in Bookstore's Angular client and compute a per-route p75 with an alarm in ASP.NET Core.
Version note: The examples in this post were run with Angular 22.2 (with TypeScript 6.0, the version Angular 22.2 supports), web-vitals 6.2.3, .NET 10 (ASP.NET Core 10), Lighthouse 13.6 and Playwright 1.65. All numbers are lab measurements taken on a single machine against a local build with headless Chromium 158; the field data parts are based on the Chrome UX Report documentation. Browser support data comes from MDN browser-compat-data 8.1.9 (2026-11-12).
Predict First
We run the home page of bookstore-web, the Angular client of Bookstore, the online bookstore used as the shared example across this site's series, through Lighthouse five times in a row: same machine, same build, not a single line of code changed in between:
node lighthouse.mjs http://127.0.0.1:5300/ --runs 5Before reading on, guess: are the five scores the same? Which one moves more from run to run, LCP or FCP? The real output:
Lighthouse 5 runs, mobile: http://127.0.0.1:5300/
run  score    FCP    LCP    TBT    CLS     SI
1       64   3016  11927    217  0.033   4173
2       63   3010  11926    207  0.033   5107
3       65   2149  11926    232  0.033   5127
4       68   2154  11926    222  0.033   3328
5       69   2153  11926    208  0.033   3328
med     65   2154  11926    217  0.033   4173
The score moved between 63 and 69. More interesting, the metric that moved most was FCP: 3.0 s in two runs, 2.15 s in three. LCP was 11.9 s in all five. By default Lighthouse loads the page without throttling and then calculates what would happen on a slow phone with a model built from that observation; a small ordering difference in the observation (such as whether the font CSS finished before or after main.js) can move the calculated value by hundreds of milliseconds. That is why looking at one run and saying "my change gained 5 points" is misleading.
This post lays the foundation of the series: which metric to look at, with which threshold and at which percentile; why a lab measurement and real user data disagree; what the Chrome UX Report (CrUX) collects; and how to collect Bookstore's own real user monitoring (RUM) data in Angular with web-vitals and turn it into a per-route p75 in ASP.NET Core. Using the DevTools Performance panel and Lighthouse is the topic of the Browser DevTools series; here we look at measurement strategy rather than tools.
The Metrics and Their Thresholds
The three metrics Google calls Core Web Vitals (CWV) measure three different things a user experiences on a page. Largest Contentful Paint, LCP, is the moment the largest image or text block in the viewport is painted and stands for loading. Interaction to Next Paint, INP, is the time from a click or key press to the next paint, taken from the worst interactions on the page, and stands for responsiveness. Cumulative Layout Shift, CLS, is the total score of unexpected shifts and stands for visual stability. Two diagnostic metrics sit next to them: Time to First Byte, TTFB, from the start of the request to the first byte of the HTML, and First Contentful Paint, FCP, the first paint of any text or image. These two are not CWV, but you need them to understand why LCP is late.
| Metric | Good | Poor | When it is final |
|---|---|---|---|
| TTFB | ≤ 800 ms | > 1,800 ms | when the first byte of the HTML arrives |
| FCP | ≤ 1.8 s | > 3.0 s | at the first paint |
| LCP | ≤ 2.5 s | > 4.0 s | at the first user input or when the page is hidden |
| INP | ≤ 200 ms | > 500 ms | when the page is hidden (whole lifetime) |
| CLS | ≤ 0.1 | > 0.25 | when the page is hidden (whole lifetime) |
The range in between is "needs improvement". The thresholds come from the metric pages on web.dev; a page is assessed not by one measurement but by the 75th percentile, p75, of all its loads, separately for mobile and desktop. A page passes only if all three CWV metrics are "good" at p75.
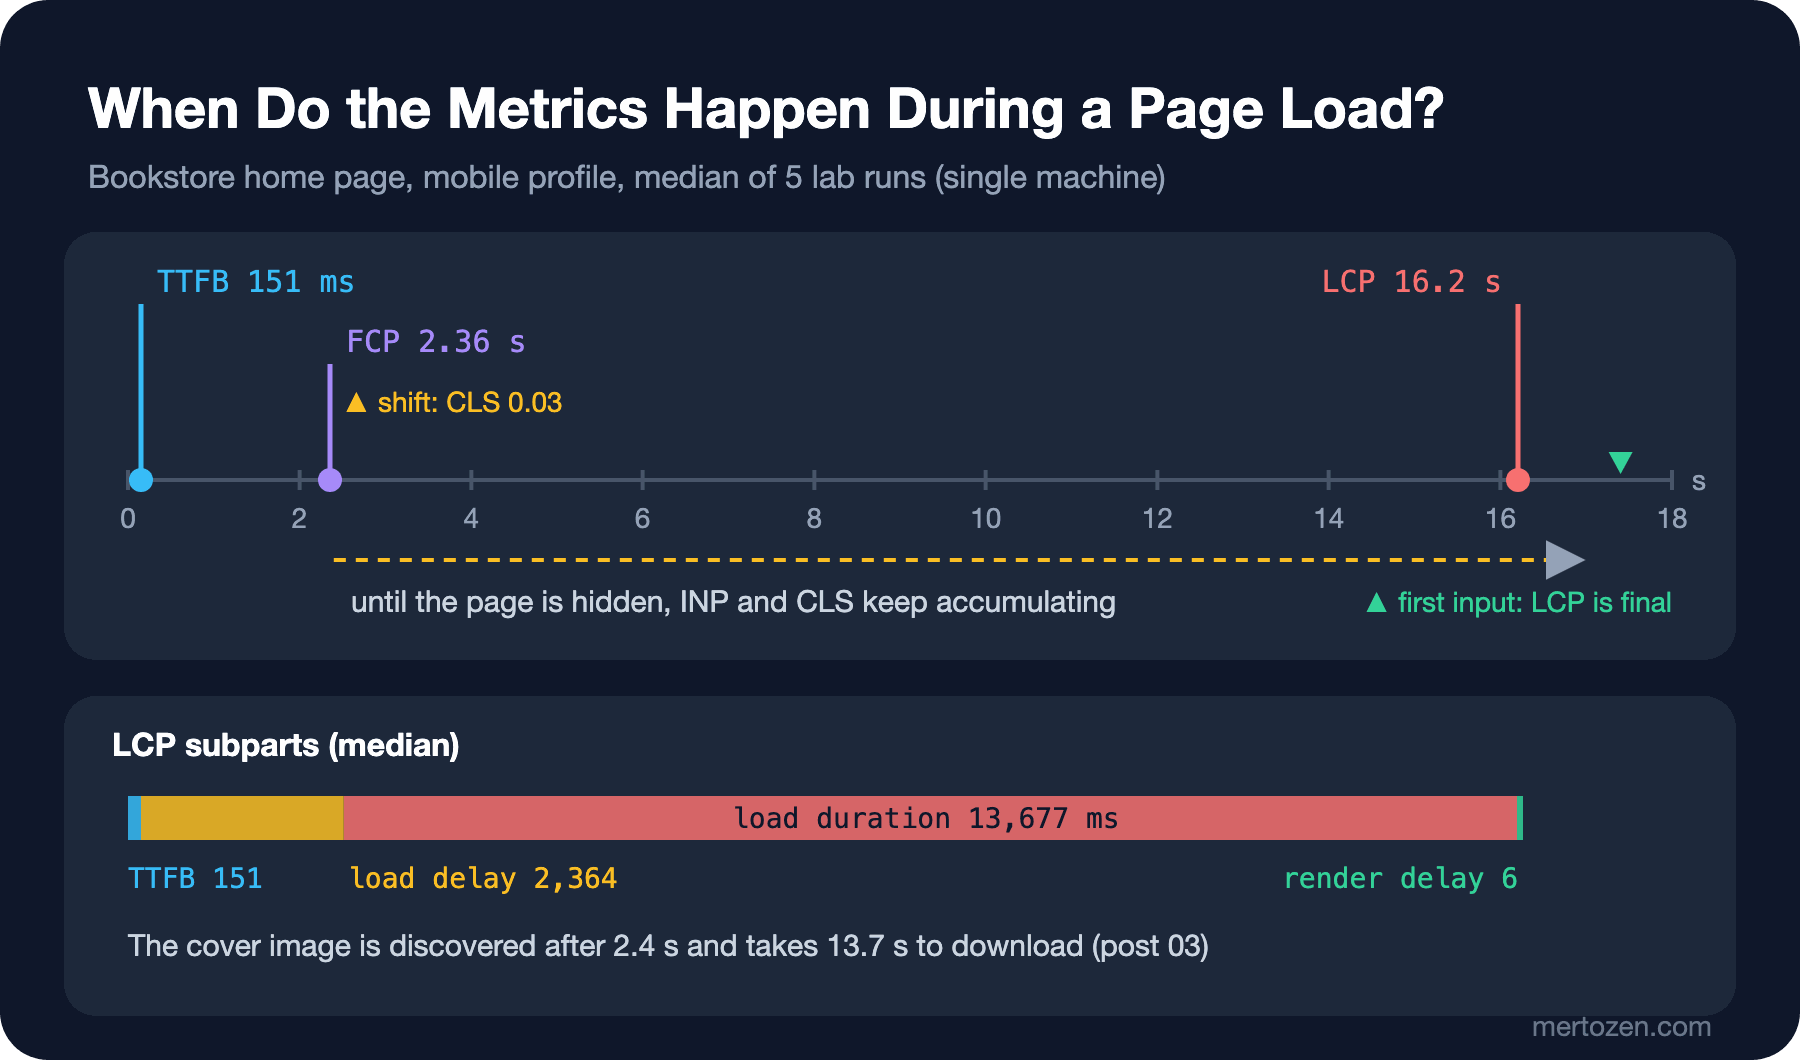
The last column of the table matters when you write RUM code. TTFB and FCP are known as soon as the page opens. LCP can keep growing until the user clicks or presses a key for the first time; after that the browser reports no new candidates. INP and CLS accumulate over the whole life of the page and reach their final value only when the user closes the tab or switches to another one. That is why measurement code cannot say "the page loaded, send it"; it has to send the data while the page is being hidden.
Why p75 and Not the Mean?
Performance data is not normally distributed: most visits are fast, a small share is very slow and forms a long tail. The mean either hides that tail or gets skewed by a few extreme values. The median, p50, describes the "typical" user but ignores half of them. p75 says "three out of four users had at least this good an experience": pessimistic enough to count slow devices, robust enough not to move with a single outlier.
Below is the LCP of Bookstore's home page from the sessions of the lab simulation we build at the end of this post, with desktop and phone sessions separated:
LCP on / (desktop, n=6): mean=2764 p50=2760 p75=2780 max=2804
LCP on / (mobile, n=9): mean=22989 p50=16216 p75=36548 max=36572
On desktop the distribution is narrow: mean, median and p75 are in the same place. The phone side consists of two groups: six mid-range phones around 16 s and three low-end phones around 36 s. The mean (23.0 s) is a value no user experienced. The median (16.2 s) does not see the low-end phones at all. p75 (36.5 s) brings the slow group, a quarter of the users, into the table. In real traffic the groups are not this sharply separated, but the logic is the same: to improve p75 you usually have to look at what the slowest devices go through.
Why Lab and Field Disagree
A lab measurement measures a single page load under fixed conditions (a given device, network speed, empty cache): repeatable and good for debugging, but one scenario. Field data comes from real users: every device, every network, warm or cold cache, the whole time spent on the page. It is normal for the two to differ. The field has low-end phones and bad connections; a returning user has a warm cache; viewport size, content for signed-in users or a cookie banner can change the LCP element. INP needs an interaction, and since Lighthouse does not touch the page it reports the related TBT, Total Blocking Time, instead: the time beyond 50 ms of the tasks that block the main thread after FCP. In the field CLS and INP cover the whole life of the page; the lab only looks at the load and does not see shifts while scrolling.
By default Lighthouse uses "simulated throttling": it loads the page fast, then calculates with a model what would happen on a slow mobile device. For our own lab measurements we wrote a small script that starts Chromium with Playwright and really applies throttling through the Chrome DevTools Protocol, CDP, the protocol DevTools uses to drive the browser. It reads the values not from Lighthouse but from the app's own RUM code, so the same code measures in the lab and in the field:
// Throttling profiles (applied with CDP, like DevTools does)
export const profiles = {
  desktop: { device: null, cpu: 1, latency: 40, downKbps: 10_000, upKbps: 5_000 },
  mobile: { device: 'Pixel 7', cpu: 4, latency: 150, downKbps: 1_600, upKbps: 750 },
  lowend: { device: 'Pixel 7', cpu: 6, latency: 300, downKbps: 700, upKbps: 400 },
};
The same home page, three profiles, five runs per profile (median on the last line):
$ node measure.mjs http://127.0.0.1:5300/ --runs 5 --profile desktop
run     TTFB    FCP    LCP    CLS
med       41    480   2756  0.023
LCP subparts (median): ttfb=41 loadDelay=481 loadDuration=2216 renderDelay=11

$ node measure.mjs http://127.0.0.1:5300/ --runs 5 --profile mobile
run     TTFB    FCP    LCP    CLS
1        151   2352  16164 0.0318
2        151   2344  16208 0.0318
3        151   2360  16224 0.0318
4        151   2356  16204 0.0318
5        151   2368  16204 0.0318
med      151   2356  16204 0.0318
LCP subparts (median): ttfb=151 loadDelay=2364 loadDuration=13677 renderDelay=6
LCP element: html>body>app-root>main>app-home-page>section.hero>div.hero-cover

$ node measure.mjs http://127.0.0.1:5300/ --runs 5 --profile lowend
run     TTFB    FCP    LCP    CLS
med      301   5220  36552 0.0318
LCP subparts (median): ttfb=301 loadDelay=5241 loadDuration=31017 renderDelay=8
The same code gives an LCP of 2.8 s on the desktop profile, 16.2 s on a mid-range phone and 36.6 s on a low-end phone. The subparts tell us why: the LCP image (the cover of the featured book) is discovered 2.4 s after the page starts and then downloads for 13.7 s, because the home page requests nine cover images of about 450 KB each at the same time. We fix this in posts 03 and 04. Note two more things. First, the five runs of our own script are within 60 ms of each other; a local server and throttling that is really applied give repeatable results. Second, two lab tools do not give the same number for the same page: Lighthouse's model calculated an LCP of 11.9 s, our profile measured 16.2 s. The device (Lighthouse emulates a Moto G Power screen, we emulate a Pixel 7) and the throttling method differ. Lab numbers are not absolute truths; they are for before/after comparisons with the same tool.
CrUX: Google's Field Data
The Chrome UX Report is a public field dataset collected from Chrome users who have opted in to sharing usage statistics. We did not send any request to CrUX in this post (the local build of Bookstore is not in CrUX anyway); the following comes from the CrUX documentation:
- The data in the CrUX API is a rolling aggregate of the last 28 days, updated daily. The BigQuery dataset is published monthly.
- A page or an origin only gets into the dataset if it is public and popular enough; a low-traffic page may have no CrUX data at all.
- Metrics come as histograms and p75 values, separately for phone, desktop and tablet. The LCP subparts (TTFB, resource load delay, load duration, render delay) are also available as separate p75 values; because each is its own percentile, they do not add up to the p75 of LCP.
- Chrome users only: the experience of Safari and Firefox users is not in CrUX.
The biggest gap in CrUX is detail: a 28-day aggregate shows the effect of yesterday's deploy weeks later and blended into the whole site; it does not tell you which route or which element is bad. For that you need your own RUM. The CWV report in Search Console and the ranking impact belong to the Analytics and Measurement series.
Late 2026: Which Browser Can Measure What?
Until a few years ago only Chromium-based browsers could measure CWV. According to MDN browser-compat-data 8.1.9 the picture is now:
| API | Chrome | Firefox | Safari |
|---|---|---|---|
LargestContentfulPaint (LCP) | 77 | 122 | 26.2 |
Event Timing interactionId (INP) | 96 | 144 | 26.2 |
LayoutShift (CLS) | 77 | no | no |
PerformanceLongAnimationFrameTiming (LoAF) | 123 | no | no |
PerformanceSoftNavigation | 151 (experimental) | no | no |
Long Animation Frames, LoAF, is the API that reports long animation frames per script; we use it in post 05 to find the cause of a slow INP.
The practical result: you now get LCP and INP from Safari and Firefox users, but no CLS. If CLS has fewer samples than LCP in your RUM table, this is why; do not read CLS against the same denominator as LCP without splitting by browser.
The second big change is for single-page applications. In an SPA like Angular no new HTML is loaded when the user goes from the catalog to a book page; classic measurement attributes the whole session to the landing page. The Soft Navigations API that shipped in Chrome 151 counts the combination "user interaction + URL change + something painted" as a navigation. According to web.dev's announcement of October 13, 2026, CrUX publishes experimental LCP, INP and CLS metrics that include soft navigations starting with the October 2026 data; the stable CWV values are unchanged and the experimental metrics are targeted to graduate in May 2027. web-vitals 6 supports this with the reportSoftNavs: true option and adds navigationURL to every metric. In this post we start with classic measurement: every metric is attributed to the route of the landing page.
Collecting Metrics in Angular with web-vitals
web-vitals is the small library from Google's Chrome team that computes the metrics with the same definitions as CrUX. It has two builds; the "attribution" build adds the cause to every metric: the element and subparts for LCP, the target and three phases of the interaction for INP, the element of the largest shift for CLS. Installation:
npm install web-vitals@6.2.3We write the RUM code as a provider, so it is switched on or off with one line in app.config.ts:
import { DOCUMENT, EnvironmentProviders, inject, makeEnvironmentProviders, provideAppInitializer } from '@angular/core';
import { NavigationEnd, Router } from '@angular/router';
import { filter, take } from 'rxjs';
import { onCLS, onFCP, onINP, onLCP, onTTFB, type MetricWithAttribution } from 'web-vitals/attribution';

export interface RumOptions {
  endpoint: string;
  sampleRate: number;
}

type Attribution = Record<string, string | number | undefined>;

interface RumReport {
  name: MetricWithAttribution['name'];
  value: number;
  rating: MetricWithAttribution['rating'];
  route: string;
  device: 'mobile' | 'desktop';
  navigationType: MetricWithAttribution['navigationType'];
  attribution: Attribution;
}

export function provideRum(options: RumOptions): EnvironmentProviders {
  return makeEnvironmentProviders([
    provideAppInitializer(() => {
      // Sample per page view: either every metric of this visit is sent or none
      if (Math.random() < options.sampleRate) {
        startRum(options, inject(Router), inject(DOCUMENT));
      }
    }),
  ]);
}

function startRum(options: RumOptions, router: Router, document: Document): void {
  const queue: Omit<RumReport, 'route'>[] = [];
  const device = /Mobi|Android/i.test(navigator.userAgent) ? 'mobile' : 'desktop';
  // Without soft navigation reporting every metric belongs to the landing page
  let landingRoute = '(unknown)';
  router.events
    .pipe(filter((e) => e instanceof NavigationEnd), take(1))
    .subscribe(() => (landingRoute = routePattern(router)));

  const add = (metric: MetricWithAttribution) =>
    queue.push({
      name: metric.name,
      value: round(metric.value, metric.name === 'CLS' ? 4 : 0),
      rating: metric.rating,
      device,
      navigationType: metric.navigationType,
      attribution: pickAttribution(metric),
    });

  onTTFB(add);
  onFCP(add);
  onLCP(add);
  onINP(add);
  onCLS(add);

  const flush = () => {
    if (queue.length === 0) return;
    const body = JSON.stringify(queue.splice(0).map((r) => ({ ...r, route: landingRoute })));
    navigator.sendBeacon(options.endpoint, new Blob([body], { type: 'application/json' }));
  };
  // "hidden" is the last moment we can rely on (tab switch, app switch, navigation away)
  document.addEventListener('visibilitychange', () => {
    if (document.visibilityState === 'hidden') flush();
  });
}
Three decisions need attention. The first is sampling: the decision is made once per page view, not per metric; otherwise the LCP of a visit could be sent while its CLS is not. The second is when to send: we collect the metrics in a queue and send them in a single beacon when visibilitychange reports the page as hidden. unload and beforeunload do not fire reliably on mobile, and unload also breaks the bfcache; navigator.sendBeacon hands the request to the browser even while the page is closing. The third is the route: we send the matched route pattern of the Angular Router instead of the URL, otherwise each of 2,000 books becomes its own row and none of them collects enough samples for a p75.
Not all attribution data is sent; performance entries are large and hold DOM references. We pick the few fields we need for diagnosis:
// '/books/:isbn' instead of '/books/9781000000371': p75 is computed per route, not per URL
function routePattern(router: Router): string {
  const parts: string[] = [];
  let node = router.routerState.snapshot.root.firstChild;
  while (node) {
    if (node.routeConfig?.path) parts.push(node.routeConfig.path);
    node = node.firstChild;
  }
  return '/' + parts.join('/');
}

function pickAttribution(metric: MetricWithAttribution): Attribution {
  switch (metric.name) {
    case 'LCP':
      return {
        target: metric.attribution.target,
        url: metric.attribution.url,
        ttfb: round(metric.attribution.timeToFirstByte),
        loadDelay: round(metric.attribution.resourceLoadDelay),
        loadDuration: round(metric.attribution.resourceLoadDuration),
        renderDelay: round(metric.attribution.elementRenderDelay),
      };
    case 'INP':
      return {
        target: metric.attribution.interactionTarget,
        type: metric.attribution.interactionType,
        inputDelay: round(metric.attribution.inputDelay),
        processing: round(metric.attribution.processingDuration),
        presentation: round(metric.attribution.presentationDelay),
        script: metric.attribution.longestScript?.entry.invoker,
      };
    case 'CLS':
      return {
        target: metric.attribution.largestShiftTarget,
        largestShift: round(metric.attribution.largestShiftValue ?? 0, 4),
      };
    default:
      return {};
  }
}

function round(value: number, digits = 0): number {
  const f = 10 ** digits;
  return Math.round(value * f) / f;
}
export const appConfig: ApplicationConfig = {
providers: [
provideBrowserGlobalErrorListeners(),
provideRouter(routes, withComponentInputBinding()),
provideHttpClient(),
// Lab: every visit is measured; in production sample (e.g. 0.1) according to traffic
provideRum({ endpoint: '/api/rum', sampleRate: 1 }),
],
};/api/rum in ASP.NET Core and p75 per Route
Bookstore's API also serves the Angular build output, so the beacon goes to the same origin and needs no CORS. The endpoint validates the reports and puts them in an in-memory queue:
namespace Bookstore.Api.Rum;

public static class RumEndpoints
{
    private const int MaxReportsPerBeacon = 20;

    public static IEndpointRouteBuilder MapRumEndpoints(this IEndpointRouteBuilder app)
    {
        app.MapPost("/api/rum", Results<NoContent, BadRequest> (RumReport[] reports, RumStore store) =>
        {
            if (reports.Length is 0 or > MaxReportsPerBeacon)
            {
                return TypedResults.BadRequest();
            }
            foreach (RumReport report in reports)
            {
                // Ignore unknown metrics and absurd values instead of storing them
                if (RumThresholds.IsKnown(report.Name) && report.Value is >= 0 and < 120_000 && report.Route.Length <= 100)
                {
                    store.Add(report);
                }
            }
            return TypedResults.NoContent();
        });

        app.MapGet("/api/rum/p75", (RumStore store, int? minutes, int? minSamples) =>
            TypedResults.Ok(store.P75(TimeSpan.FromMinutes(minutes ?? 60), minSamples ?? 20)));

        return app;
    }
}
namespace Bookstore.Api.Rum;
// "good" and "poor" boundaries from web.dev; a value is rated at the 75th percentile
public static class RumThresholds
{
private static readonly Dictionary<string, (double Good, double Poor)> Limits = new()
{
["TTFB"] = (800, 1800),
["FCP"] = (1800, 3000),
["LCP"] = (2500, 4000),
["INP"] = (200, 500),
["CLS"] = (0.1, 0.25),
};
public static bool IsKnown(string metric) => Limits.ContainsKey(metric);
public static string Rate(string metric, double value)
{
(double good, double poor) = Limits[metric];
return value <= good ? "good" : value <= poor ? "needs-improvement" : "poor";
}
}using System.Collections.Concurrent;
namespace Bookstore.Api.Rum;
public sealed class RumStore(TimeProvider clock)
{
private const int MaxSamples = 100_000;
private readonly ConcurrentQueue<RumSample> _samples = new();
public void Add(RumReport report)
{
_samples.Enqueue(new RumSample(report, clock.GetUtcNow()));
// Keep memory bounded: drop the oldest samples instead of growing forever
while (_samples.Count > MaxSamples && _samples.TryDequeue(out _))
{
}
}
public IReadOnlyList<RumRow> P75(TimeSpan window, int minSamples)
{
DateTimeOffset since = clock.GetUtcNow() - window;
return _samples
.Where(s => s.ReceivedAt >= since)
.GroupBy(s => (s.Report.Route, s.Report.Name, s.Report.Device))
.Select(g =>
{
double[] values = g.Select(s => s.Report.Value).Order().ToArray();
double p75 = Percentile(values, 0.75);
string rating = RumThresholds.Rate(g.Key.Name, p75);
bool alarm = values.Length >= minSamples && rating != "good";
return new RumRow(g.Key.Route, g.Key.Name, g.Key.Device, values.Length, Math.Round(p75, 3), rating, alarm);
})
.OrderBy(r => r.Route).ThenBy(r => r.Metric).ThenBy(r => r.Device)
.ToList();
}
// Nearest-rank percentile on a sorted array
private static double Percentile(double[] sorted, double p)
{
int rank = (int)Math.Ceiling(p * sorted.Length);
return sorted[Math.Clamp(rank - 1, 0, sorted.Length - 1)];
}
}When computing p75 we group by route, metric and device class; the same idea as CrUX splitting phone and desktop. The alarm only fires when there are enough samples: you do not want to wake anyone at night because of the p75 of a route with three visits.
Without data the table stays empty. Since we have no real users, we simulated a small mix of visitors in the lab: 6 desktop, 6 mid-range phone and 3 low-end phone sessions per route. Catalog sessions type "war" into the search box, the others open the page and leave. Keep in mind that this is not real user data; it is generated only to feed the RUM pipeline:
const routes = [
  { path: '/', act: async () => {} },
  { path: '/books', act: async (page) => page.locator('input[type=search]').pressSequentially('war', { delay: 120 }) },
  { path: '/books/9781000000009', act: async () => {} },
];
// Visitor mix: 6 desktop, 6 mid-range phone, 3 low-end phone sessions per route
const mix = [['desktop', 6], ['mobile', 6], ['lowend', 3]];
$ node field-sim.mjs
.............................................
225 metric reports sent to http://127.0.0.1:5300/api/rumThe result, from the API's p75 endpoint:
$ curl -s "http://127.0.0.1:5300/api/rum/p75?minSamples=5" | jq -r '.[] | select(.metric != "TTFB" and .metric != "FCP") | [.route, .metric, .device, .samples, .p75, .rating, .alarm] | @tsv'
/	CLS	desktop	6	0.021	good	false
/	CLS	mobile	9	0.032	good	false
/	INP	desktop	6	0	good	false
/	INP	mobile	9	8	good	false
/	LCP	desktop	6	2780	needs-improvement	true
/	LCP	mobile	9	36548	poor	true
/books	CLS	desktop	6	0	good	false
/books	CLS	mobile	9	0	good	false
/books	INP	desktop	6	48	good	false
/books	INP	mobile	9	232	needs-improvement	true
/books	LCP	desktop	6	780	good	false
/books	LCP	mobile	9	5228	poor	true
/books/:isbn	CLS	desktop	6	0	good	false
/books/:isbn	CLS	mobile	9	0.32	poor	true
/books/:isbn	INP	desktop	6	0	good	false
/books/:isbn	INP	mobile	9	0	good	false
/books/:isbn	LCP	desktop	6	976	good	false
/books/:isbn	LCP	mobile	9	10992	poor	true
The table shows what we expected from the lab profiles, but per route: the home page's LCP is in alarm for both device classes; on the catalog (/books) the phones' INP is "needs improvement" at 232 ms (typing into the search box of a 2,000-book list is slow; we fix that in post 05); and on the book page the phone CLS is poor at 0.32. We never saw the last one in the lab runs, because we only measured the home page: the unsized cover image pushes the text below it when it loads. Values such as 0 and 8 ms in the INP rows come from the simulation; the only interaction in those sessions is the Shift key pressed to end the visit. That is the value of RUM: it shows the problem on the page nobody thought of measuring.
In Production
Choose the sampling rate by traffic. A site with a few thousand page views a day can measure every visit; with hundreds of thousands of views, a 5-10% sample produces enough data to keep p75 meaningful without loading the API. When you change the rate, make sure old and new data do not mix.
The beacon endpoint is a public write door. Limit the body size, the number of reports and the value range, drop unknown metrics and, if needed, add a per-IP limit with ASP.NET Core's rate limiting middleware. Do not send personal data: one reason we send the route pattern instead of the URL is the e-mail addresses, tokens or search terms in query strings. CSS selectors in the attribution can contain user names or IDs as well; shorten them on the server.
The in-memory queue is a starting point: the data is lost when the app restarts, and with several instances each sees only its own share. In real use, write the reports to a time-series database or a log/metrics pipeline and compute p75 there; the tools in the Observability series fit this. Finally, keep navigationType too: pages restored from the bfcache or prerendered have very different values from normal loads, and mixing them in one distribution makes the table misleading.
Common Pitfalls
- Deciding on a single Lighthouse run. Even on the same build the score moves by a few points; look at the median of at least 3-5 runs and measure before and after under the same conditions.
- Treating the lab score as the goal. A page with a Lighthouse score of 100 can have a bad field p75; the goal is the field p75, the lab is for finding its cause.
- Opening RUM to all traffic without sampling and sending a separate request per metric. Five requests per page view hurt the very performance you want to measure and load the API.
- Sending the metrics on the
loadevent. INP and CLS have barely started at that point; send while the page is hidden, onvisibilitychange. - Computing p75 per URL. Every ISBN of the book page becomes its own row and none of them yields a meaningful percentile.
- Collecting mobile and desktop in one distribution. Good desktop values hide the phone problem.
- Reading the missing CLS from Safari and Firefox as "no CLS problem".
A Small Experiment
★☆☆ Run lighthouse.mjs with --runs 10 and note the difference between the best and the worst score. Then run measure.mjs for the same page with --runs 10 --profile mobile; which one's LCP moves less from run to run?
★★☆ Add a browser dimension to RumStore: let the client send a rough browser name (chromium, firefox, safari) derived from navigator.userAgent and let the p75 endpoint group by it. Open a few sessions with Playwright's Firefox and WebKit browsers and see which metrics never arrive.
★★★ Add a reportSoftNavs option to provideRum and attribute metrics to a route derived from metric.navigationURL instead of the landing route. Write a lab session that clicks from the home page to a book page and verify that a separate LCP row appears for the book page.
We now have a p75 table per route, and the home page's LCP is red. In the next post we look at how the HTML, CSS and JavaScript of this page reach the screen, the critical rendering path: we will read in a waterfall what the browser is waiting for and find and fix the two resources that delay the first paint, the third-party font CSS and the analytics script.