

The Critical Rendering Path: How HTML, CSS and JavaScript Reach the Screen and What Blocks Rendering

The critical rendering path is the longest chain the browser waits on before the first paint; stylesheets in head block rendering and scripts without async/defer block the parser, but not every blocking resource is on the critical path. In the waterfall of Bookstore's home page we measure that fixing the font CSS and analytics does not change FCP because the real chain is main.js, then cut FCP from 2.35 s to 1.10 s with response compression and analytics after load.
Version note: The examples in this post were run with Angular 22.2 (with TypeScript 6.0, the version Angular 22.2 supports), .NET 10 (ASP.NET Core 10), Lighthouse 13.6 and Playwright 1.65. All numbers are lab measurements taken on a single machine against a local build with headless Chromium 158. Browser support data comes from MDN browser-compat-data 8.1.9 (2026-11-12).
Predict First
This is the source index.html of bookstore-web, the Angular client of Bookstore, the online bookstore used as the shared example across this site's series. In the measurements of the first post, the home page's FCP on a phone was 2.35 s:
<!doctype html>
<html lang="en">
<head>
  <meta charset="utf-8">
  <title>Bookstore</title>
  <base href="/en/">
  <meta name="viewport" content="width=device-width, initial-scale=1">
  <link rel="icon" type="image/x-icon" href="favicon.ico">
  <link rel="stylesheet" href="http://fonts.thirdparty.test:5302/css2?family=Inter:wght@400;700">
  <script src="http://analytics.thirdparty.test:5302/analytics.js"></script>
</head>
<body>
  <app-root></app-root>
</body>
</html>
Before reading on, guess: if we fix the two third-party lines in <head> (the CSS of a font service and an analytics script), how much does FCP drop? Half a second, a second, not at all?
The setup is the same as in the first post: the ASP.NET Core API serves the Angular build; Chromium started by Playwright opens the page five times with the "mobile" profile (4x CPU slowdown, 150 ms latency, 1.6 Mbps) and reads the values from the app's own RUM code. The font service and the analytics vendor are not real: Chromium's --host-resolver-rules option maps the *.thirdparty.test names to a local Node server, which adds 250 ms to every response to imitate the response time of a distant server. We did not send any request to a real third party.
From HTML to Pixels: DOM, CSSOM, Render Tree
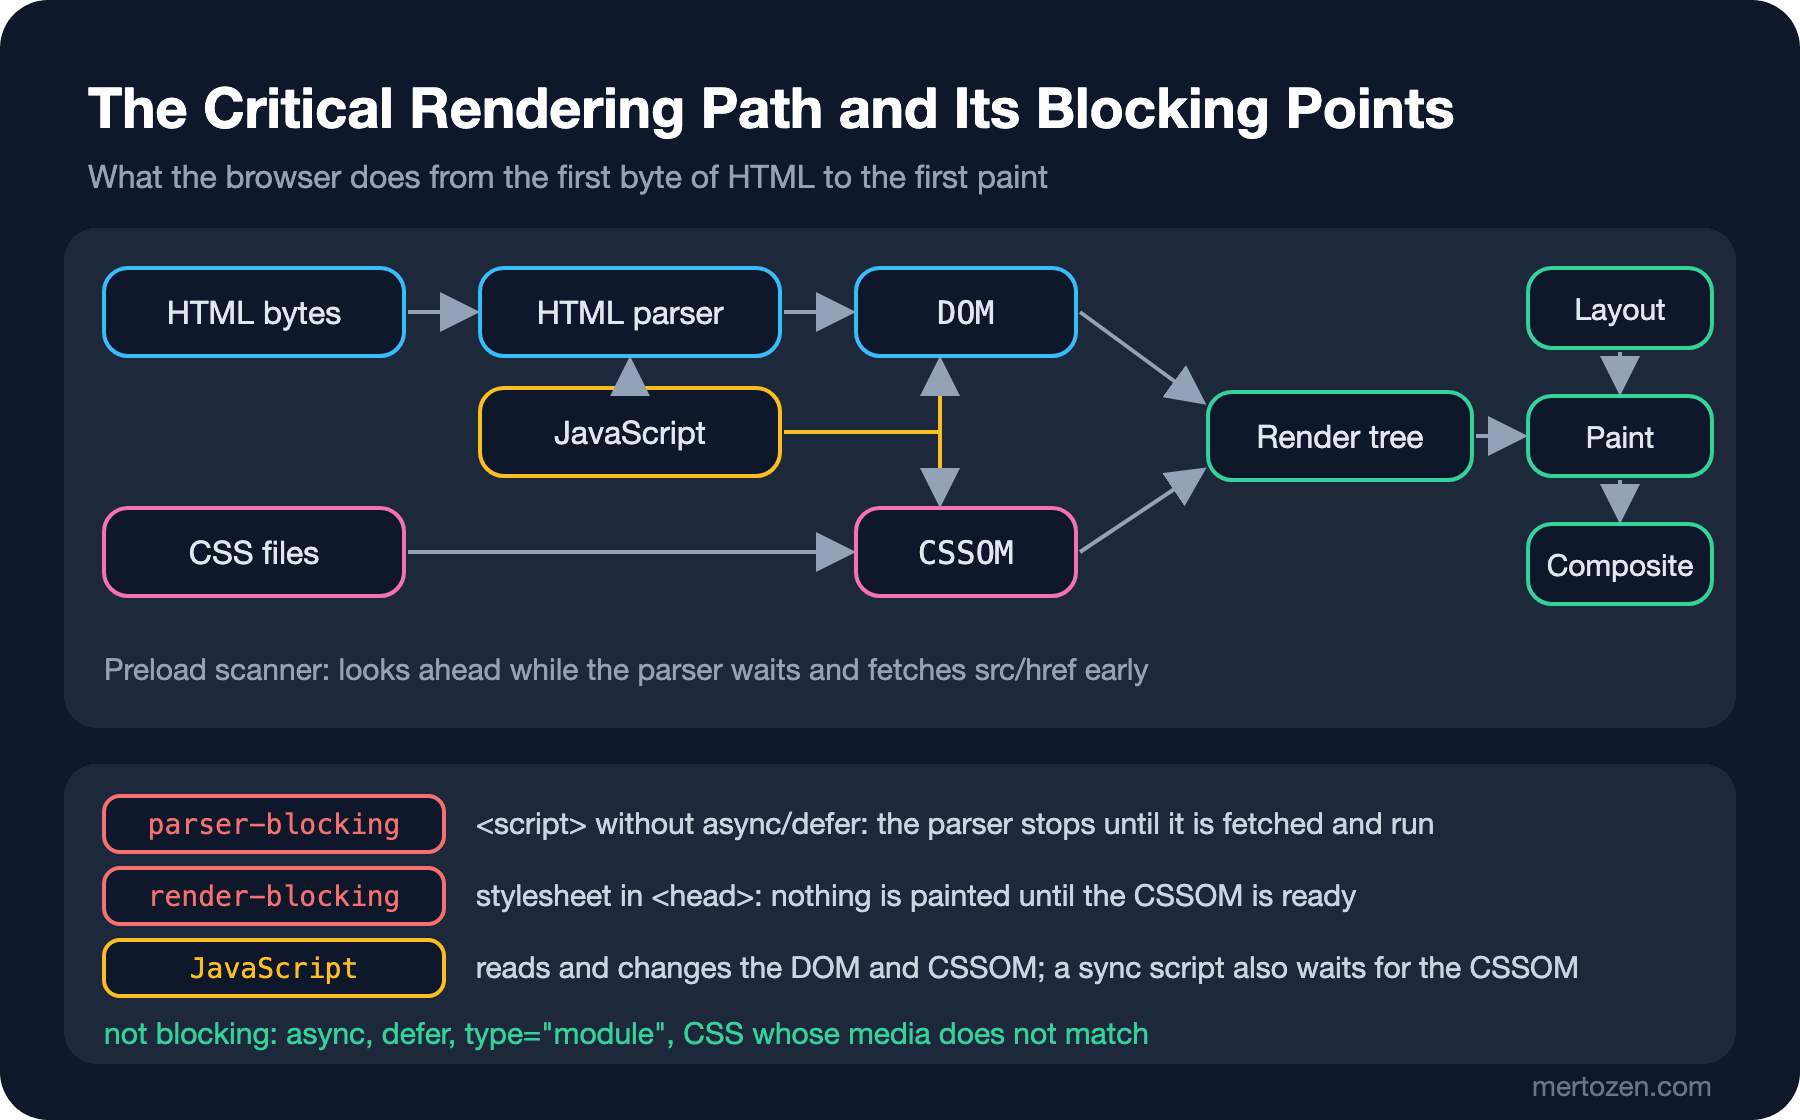
The browser parses the HTML as it arrives and builds the DOM. It downloads every stylesheet it finds and turns it into the CSSOM, the tree of style rules. Together they produce the render tree: the nodes that will really be visible and their computed styles. Then layout computes the position and size of every box, paint produces drawing commands and composite combines the layers and puts them on screen. The critical rendering path is the chain of all the work and resources on this pipeline up to the first paint.
The pipeline has two stopping points. The first is CSS: because the browser does not want to show unstyled content for a moment and then redraw it, it paints nothing until the stylesheets in <head> have arrived. That is render-blocking. The second is JavaScript: a <script> without async or defer may change the DOM, so the parser stops until it has been downloaded and run. That is parser-blocking. Since a script can also read the CSSOM, it does not run before the stylesheet in front of it has arrived; a sync script inherits the delay of the CSS before it.
There is a helper that does not sit idle while the parser waits: the preload scanner. It scans the raw HTML ahead, finds src and href values and starts downloading them before the parser gets there. That is why an <img> or <script src> written in the HTML is discovered early, while a resource added to the DOM later by JavaScript or sitting in CSS as a background-image is only discovered when the code that adds it runs. That is exactly the LCP problem of the next post.
defer, async and type="module"
| Tag | Stops the parser? | When does it run? | Order kept? |
|---|---|---|---|
<script src> | Yes, until fetched and run | Immediately | Yes |
<script async> | No (only while running) | As soon as it arrives | No |
<script defer> | No | After parsing, before DOMContentLoaded | Yes |
<script type="module"> | No (deferred by default) | After parsing | Yes |
The details are in the "Your First JavaScript Script: The script Tag, defer, async and DevTools" post of the JavaScript Basics series; what matters here is the difference between a script not stopping the parser and a script not being on the critical path. We will see that difference in measurements shortly.
The index.html Produced by the Angular Build
The index.html produced by the production build differs from the source:
<!doctype html>
<html lang="en" data-beasties-container>
<head>
  <meta charset="utf-8">
  <title>Bookstore</title>
  <base href="/en/">
  <meta name="viewport" content="width=device-width, initial-scale=1">
  <link rel="icon" type="image/x-icon" href="favicon.ico">
  <link rel="stylesheet" href="http://fonts.thirdparty.test:5302/css2?family=Inter:wght@400;700">
  <script src="http://analytics.thirdparty.test:5302/analytics.js"></script>
<style>*{box-sizing:border-box}body{margin:0;font-family:Inter,system-ui,sans-serif;color:#0f172a;background:#f8fafc;line-height:1.5}</style><link rel="stylesheet" href="styles-SR7LJ3IE.css" media="print" data-beasties-media="all"><noscript><link rel="stylesheet" href="styles-SR7LJ3IE.css"></noscript></head>
<body>
  <app-root></app-root>
<script src="main-EWTR2XZC.js" type="module"></script><script>document.querySelectorAll('link[data-beasties-media]').forEach(function(l){l.media=l.getAttribute('data-beasties-media');l.removeAttribute('data-beasties-media')})</script></body>
</html>
Three things stand out. First, the part of styles.css needed for the first view (here the body rules) has been inlined as a <style> by beasties; the real file is requested with media="print". A media query that does not match the screen does not block rendering, and the small inline script at the end of the body switches media to all. Angular's inlineCritical optimization is on by default in production builds. Second, main.js comes with type="module", so it does not block the parser. Third, the two lines we added by hand stay at the top of <head>: Angular does not touch them. The budgets in angular.json only count the files Angular produces; the bytes these two lines bring in are not in any budget.
The Waterfall of Bookstore's Home Page
The Network panel of DevTools shows the waterfall too (the Network panel post of the Browser DevTools series); to keep it repeatable we use a small script that reads the Resource Timing API. Since Chromium 107 every resource entry has a renderBlockingStatus field that says whether it blocked rendering (in Firefox only in preview, not in Safari):
await page.goto(positionals[0] ?? 'http://127.0.0.1:5300/', { waitUntil: 'networkidle', timeout: 120_000 });
const data = await page.evaluate(async () => {
  // LCP entries are only available through a buffered PerformanceObserver
  const lcp = await new Promise((resolve) =>
    new PerformanceObserver((list) => resolve(list.getEntries().at(-1))).observe({ type: 'largest-contentful-paint', buffered: true }));
  const fcp = performance.getEntriesByName('first-contentful-paint')[0];
  const nav = performance.getEntriesByType('navigation')[0];
  const rows = [nav, ...performance.getEntriesByType('resource')].map((e) => ({
    name: e.name.replace(location.origin, '').replace('http://', '').slice(0, 56),
    start: Math.round(e.startTime),
    end: Math.round(e.responseEnd),
    blocking: e.renderBlockingStatus,
  }));
  return { rows, fcp: Math.round(fcp?.startTime), lcp: Math.round(lcp?.startTime) };
});
resource start end render-blocking
/ 0 164 non-blocking
fonts.thirdparty.test:5302/css2?family=Inter:wght@400;70 201 485 blocking
analytics.thirdparty.test:5302/analytics.js 202 1235 blocking
/main-EWTR2XZC.js 203 2308 non-blocking
analytics.thirdparty.test:5302/collect 1310 1573 non-blocking
/styles-SR7LJ3IE.css 1310 1475 non-blocking
/api/books/featured 2396 2555 non-blocking
/api/books/new 2396 2569 non-blocking
/covers/dune.jpg 2571 16265 non-blocking
/covers/emma.jpg 2591 16654 non-blocking
/covers/the-hobbit.jpg 2591 16227 non-blocking
/covers/pride-and-prejudice.jpg 2591 17571 non-blocking
/covers/middlemarch.jpg 2591 17653 non-blocking
/covers/frankenstein.jpg 2591 18396 non-blocking
/covers/jane-eyre.jpg 2591 24381 non-blocking
/covers/moby-dick.jpg 2591 24575 non-blocking
/covers/war-and-peace.jpg 2591 24687 non-blocking
FCP 2420 ms, LCP 16272 msThe font CSS and the analytics script are marked blocking. Analytics finishes at 1.2 s; the parser waits until then. The font files missing from the list are worth a note too: Chromium downloaded them (when we follow the same load through the DevTools protocol, two woff2 requests show up), but these requests started by CSS from another origin did not make it into the page's Resource Timing list. Keep this blind spot in mind when you watch third-party resources with RUM. Lighthouse finds the same two resources and estimates a saving of 900 ms:
Render-blocking requests: Est savings of 900 ms
  analytics.thirdparty.test:5302/analytics.js totalBytes=76286 wastedMs=1603
  fonts.thirdparty.test:5302/css2?family=Inter:wght@400;700 totalBytes=1806 wastedMs=854
First, Two Obvious Fixes
The analytics script has nothing to do with the page content; there is no reason for it to hold the parser. One word is enough:
--- index.html
+++ index.html
@@ -7,7 +7,7 @@
   <meta name="viewport" content="width=device-width, initial-scale=1">
   <link rel="icon" type="image/x-icon" href="favicon.ico">
   <link rel="stylesheet" href="http://fonts.thirdparty.test:5302/css2?family=Inter:wght@400;700">
-  <script src="http://analytics.thirdparty.test:5302/analytics.js"></script>
+  <script async src="http://analytics.thirdparty.test:5302/analytics.js"></script>
 </head>
 <body>
   <app-root></app-root>
The preload scanner still downloads an async script early, but the parser does not wait for it. For the font CSS there are two ways. The first is to stay with the third party, open the connection in advance and request the font with display=swap:
--- index.html
+++ index.html
@@ -6,7 +6,8 @@
   <base href="/en/">
   <meta name="viewport" content="width=device-width, initial-scale=1">
   <link rel="icon" type="image/x-icon" href="favicon.ico">
-  <link rel="stylesheet" href="http://fonts.thirdparty.test:5302/css2?family=Inter:wght@400;700">
+  <link rel="preconnect" href="http://fonts.thirdparty.test:5302" crossorigin>
+  <link rel="stylesheet" href="http://fonts.thirdparty.test:5302/css2?family=Inter:wght@400;700&display=swap">
   <script async src="http://analytics.thirdparty.test:5302/analytics.js"></script>
 </head>
 <body>
The second is to serve the font from our own origin. The font files (Inter, distributed under the Open Font License) are copied to public/fonts/, the @font-face rules go into styles.css and the font line disappears from index.html:
/* Self-hosted Inter (SIL Open Font License, public/fonts/OFL.txt): latin + latin-ext, 400 and 700 */
@font-face {
  font-family: 'Inter';
  font-style: normal;
  font-weight: 400;
  font-display: swap;
  src: url('/fonts/inter-latin-ext-400-normal.woff2') format('woff2');
  unicode-range: U+0100-02BA, U+02BD-02C5, U+02C7-02CC, U+02CE-02D7, U+02DD-02FF, U+0304, U+0308, U+0329, U+1D00-1DBF, U+1E00-1E9F, U+1EF2-1EFF, U+2020, U+20A0-20AB, U+20AD-20C0, U+2113, U+2C60-2C7F, U+A720-A7FF;
}
@font-face {
  font-family: 'Inter';
  font-style: normal;
  font-weight: 400;
  font-display: swap;
  src: url('/fonts/inter-latin-400-normal.woff2') format('woff2');
  unicode-range: U+0000-00FF, U+0131, U+0152-0153, U+02BB-02BC, U+02C6, U+02DA, U+02DC, U+0304, U+0308, U+0329, U+2000-206F, U+20AC, U+2122, U+2191, U+2193, U+2212, U+2215, U+FEFF, U+FFFD;
}
Beasties moves these @font-face rules into the inline CSS as well; the browser requests the font without waiting for a separate CSS request and a separate connection. The measurements of the three changes (median of five runs, ms):
| State | FCP | LCP |
|---|---|---|
| A: start | 2,348 | 16,196 |
B: analytics async | 2,348 | 16,196 |
C: B + preconnect + display=swap | 2,352 | 16,208 |
| D: B + font from our own origin | 2,344 | 16,016 |
| E: D + response compression | 1,496 | 15,256 |
F: E + analytics after load | 1,104 | 14,852 |
The first three rows are a surprise: we removed the two render-blocking resources and FCP did not move. Lighthouse says something else for D:
Lighthouse 5 runs, mobile: http://127.0.0.1:5300/
run  score    FCP    LCP    TBT    CLS     SI
1       71    606  12227    222  0.000    865
2       67   2111  12001    209  0.034   4367
3       72    610  12001    210  0.037   2438
4       72    610  12001    205  0.034   2457
5       67   2112  12001    206  0.034   4354
med     71    610  12001    209  0.034   2457
Lighthouse's model calculated an FCP of 0.6 s in three of the five runs; the measurement that really applies throttling says 2.34 s. By default Lighthouse loads the page fast and estimates the timing on a slow device with a model, and on this page the estimate misses reality. The insight's "900 ms saving" came from the same model.
The Real Critical Path: main.js
Look at the waterfall again: because <app-root> arrives empty, the first content to paint is created when Angular runs. The longest chain in front of FCP is HTML → main.js (282 KB) → Angular's first render. The CSS and the analytics script were not on that chain; main.js finished at 2.3 s anyway and did not wait for them. Shortening the critical rendering path means shortening the longest chain.
The biggest part of the chain was the bytes of main.js, and the API sent them uncompressed. In ASP.NET Core, response compression is two lines:
builder.Services.AddSingleton(TimeProvider.System);
builder.Services.AddSingleton<BookCatalog>();
builder.Services.AddSingleton<RumStore>();
// Compress text responses (HTML, JS, CSS, JSON); the Brotli/zstd details are in the navigation post
builder.Services.AddResponseCompression();

WebApplication app = builder.Build();

app.UseResponseCompression();
app.UseStaticFiles();
With the default settings Brotli and gzip are enabled, chosen by the client's Accept-Encoding, and Vary: Accept-Encoding is added to the response. main.js went from 282 KB to 114 KB and FCP dropped from 2.34 s to 1.50 s (E in the table). The default Brotli level is the fastest one; serving files precompressed at build time, compression levels and zstd are the topic of the post on speeding up navigations.
The last step is about bandwidth: the async analytics script did not block the parser, but its 76 KB downloaded at the same time as main.js and shared the line. Analytics does not need the first paint; it is loaded after the load event:
--- index.html
+++ index.html
@@ -6,8 +6,14 @@
   <base href="/en/">
   <meta name="viewport" content="width=device-width, initial-scale=1">
   <link rel="icon" type="image/x-icon" href="favicon.ico">
-  <link rel="stylesheet" href="http://fonts.thirdparty.test:5302/css2?family=Inter:wght@400;700">
-  <script async src="http://analytics.thirdparty.test:5302/analytics.js"></script>
+  <script>
+    // Analytics after the load event: it no longer competes with main.js for bandwidth
+    addEventListener('load', () => {
+      const script = document.createElement('script');
+      script.src = 'http://analytics.thirdparty.test:5302/analytics.js';
+      document.head.append(script);
+    });
+  </script>
 </head>
 <body>
   <app-root></app-root>
FCP dropped to 1.10 s. The waterfall after compression:
resource                                                  start    end  render-blocking
/                                                             0    157  non-blocking
analytics.thirdparty.test:5302/analytics.js                 168   1260  non-blocking
/main-EWTR2XZC.js                                           168   1410  non-blocking
/styles-EHOBXKHN.css                                        170    329  non-blocking
/fonts/inter-latin-400-normal.woff2                         181    638  non-blocking
analytics.thirdparty.test:5302/collect                     1326   1582  non-blocking
/fonts/inter-latin-700-normal.woff2                        1472   1770  non-blocking
/api/books/featured                                        1477   1634  non-blocking
/api/books/new                                             1478   1642  non-blocking
/covers/dune.jpg                                           1641  15233  non-blocking
/covers/the-hobbit.jpg                                     1655  15210  non-blocking
/covers/emma.jpg                                           1655  15629  non-blocking
/covers/middlemarch.jpg                                    1655  16649  non-blocking
/covers/pride-and-prejudice.jpg                            1655  16664  non-blocking
/covers/frankenstein.jpg                                   1655  17376  non-blocking
/covers/moby-dick.jpg                                      1655  23572  non-blocking
/covers/jane-eyre.jpg                                      1655  23370  non-blocking
/covers/war-and-peace.jpg                                  1655  23684  non-blocking
FCP 1492 ms, LCP 15252 ms
This waterfall is from state E; in F the analytics rows move after load. LCP is still around 15 s: the cover images are requested at 1.6 s and then download for tens of seconds. We deal with them in the next two posts.
Resource Hints: Telling the Browser in Advance
Resource hints tell the browser about something it has not discovered yet. They all have a cost: telling the browser something it already knows is wasted, and requesting something early without need steals bandwidth from the critical resource, as we saw in step F.
preconnect: sets up the DNS, TCP and TLS connection to an origin in advance. For one or two third-party origins whose critical resources will certainly be requested. According to web.dev the browser closes a connection that is not used within 10 seconds; resources fetched in anonymous mode, such as fonts, also needcrossorigin, otherwise only DNS is resolved.dns-prefetch: DNS resolution only; cheaper, for less certain connections.preload: downloads a given resource (a font, the LCP image, a late-discovered CSS) now. Without the rightasthe resource cannot get the right priority and scripts may be downloaded twice; a font preload needscrossorigin.modulepreload: downloads and parses an ES module; for lazy chunks.fetchpriority: corrects the browser's priority guess withhighorlow; it does not speed up discovery, it only changes the order.
There is also 103 Early Hints: while the server prepares the real response, it first sends an interim response with Link: <...>; rel=preload headers and the browser starts requesting critical resources without waiting for the HTML (Chrome 103, Firefox 120, Safari 17 according to browser-compat-data). It helps pages with a long TTFB. The public API of ASP.NET Core 10 has no method for sending 1xx interim responses (its reference assemblies only contain the HttpStatusCode.EarlyHints constant), so 103 is usually produced by the CDN or reverse proxy in front of it. That topic is in the Domain, DNS and CDN series.
In Production
Third-party scripts pile up over time. The marketing team adds a pixel through the tag manager, the support team adds a chat widget, and none of them goes through code review. Mark the FCP and LCP in RUM with tag manager changes as well as deploys; a jump can come without any code change. Also think about the cache lifetime of the font we moved to our own origin: its file name has no hash, so if you give it a long max-age, the old file stays when the font is updated. Angular's own output does not have this problem, those file names carry a hash; the HTTP caching details are in the Caching series.
Weigh response compression against its CPU cost: dynamic responses are compressed again on every request. For static files, producing compressed copies at build time and serving them gives both a better ratio and zero cost at request time. On HTTPS the EnableForHttps option is off by default; before turning it on, assess the BREACH-style attack risk of compressing user-specific data together with secrets in the same response.
Common Pitfalls
- Thinking "no render-blocking resources" means "short critical path". On this page removing two blocking resources did not change FCP at all; the critical path was
main.js. - Accepting the estimated savings of Lighthouse insights without measuring. Measure the change before and after with real throttling.
- Preloading everything. Every preloaded resource shares the line with the critical one; Chrome writes a console warning for unused preloads about 3 seconds after load.
- Unused
preconnects, and font preconnects withoutcrossorigin. - Thinking
asyncis free. A script that does not block the parser still costs bandwidth and main thread time. - Making a critical script "async" by adding it to the DOM with JavaScript. The preload scanner cannot see it;
<script async src>arrives earlier. For non-critical scripts such as analytics, being discovered late is exactly what we want.
A Small Experiment
★☆☆ Restart third-party.mjs with DELAY_MS=1000 and run the original index.html and its final version through waterfall.mjs. Which version's FCP is affected by the slower third party?
★★☆ Add <link rel="preload" as="font" type="font/woff2" crossorigin> to index.html for the font served from our own origin and measure with measure.mjs. Then remove crossorigin and check in the DevTools Network panel how many times the font is downloaded.
★★★ Change the analytics script in third-party.mjs to keep the main thread busy for 300 ms instead of 60 ms. FCP will not change in state F; but which metric on which route of the first post's RUM table is affected? Guess, then verify with field-sim.mjs.
FCP went from 2.35 s to 1.10 s, but LCP is still 15 s: the cover image is not discovered until JavaScript runs and the API returns data, and it shares bandwidth with eight other large images. In the next post we split LCP into its four subparts (TTFB, resource load delay, load duration, render delay) and reduce each one separately: we make the cover a real <img>, prioritize it with NgOptimizedImage priority and prerender the home page.