

Configuring the Playwright Test Runner: playwright.config, Projects, Writing Fixtures (test.extend), test.step, Tags/Annotations and Reporters
In an Angular application, an auto fixture that catches uncaught errors through pageerror sees nothing, because Angular's global error listeners turn the error into a console.error. With real runs on Bookstore we cover playwright.config, timeout layers, projects, a webServer driven by environment variables, writing test- and worker-scoped fixtures, test.step, tags and annotations, merging shards with blob reports, and PageTest on .NET.
Version note: The code in this post was built and run with .NET 10, Angular 22.2, Playwright 1.65 (@playwright/test), Microsoft.Playwright and Microsoft.Playwright.Xunit.v3 1.64.1, and xUnit.net v3 4.0.3.
Guess First
The E2E suite of Bookstore, the online bookstore used as the shared example across this site's series, got a fixture that runs in every test on its own. Its purpose is to fail the test if there is an uncaught JavaScript error on the page:
pageErrors: [
  async ({ page }, use) => {
    const errors: Error[] = [];
    page.on('pageerror', (error) => errors.push(error));
    await use();
    expect(errors.map((e) => e.message), 'uncaught errors in the page').toEqual([]);
  },
  { auto: true },
],
To try the fixture I wrote a test that runs throw new Error('price is undefined') from inside a setTimeout on the catalog page. The application is Angular 22; app.config.ts contains the provideBrowserGlobalErrorListeners() that the CLI added. Does the test fail?
The Answer: Angular Caught the Error, No pageerror Arrived
The test passed. Listening to two events on the same page showed why:
console.error: ERROR Error: price is undefined
console.error: ERROR Error: coupon lookup failed
Neither the thrown error nor the rejected promise arrived as pageerror. provideBrowserGlobalErrorListeners catches uncaught errors and promise rejections on the window and hands them to Angular's ErrorHandler, which writes them to console.error with an ERROR prefix. As far as the browser is concerned, the error has been handled. For the fixture to work in an Angular application, it has to listen to both sources:
// Runs in every test on its own: an uncaught JavaScript error on the page fails the test
pageErrors: [
  async ({ page }, use) => {
    const errors: string[] = [];
    page.on('pageerror', (error) => errors.push(error.message));
    // Angular's global error listeners hand the error to ErrorHandler: you get an "ERROR ..." console.error, not pageerror
    page.on('console', (message) => {
      if (message.type() === 'error' && message.text().startsWith('ERROR')) {
        errors.push(message.text().split('\n')[0]);
      }
    });
    await use();
    expect(errors, 'uncaught errors in the page').toEqual([]);
  },
  { auto: true },
],
Error: uncaught errors in the page
expect(received).toEqual(expected) // deep equality
- Expected - 1
+ Received + 3
- Array []
+ Array [
+ "ERROR Error: price is undefined",
+ ]The filter looks at the ERROR prefix on purpose: the payment outage test from post 8 produces the browser's own "Failed to load resource" message because of a request that returns 503, and that is expected. This post goes through playwright.config.ts and the fixture file, which have grown piece by piece since post 7, from top to bottom.
playwright.config.ts and the Timeout Layers
import { defineConfig, devices } from '@playwright/test';
import { apiPort, apiURL, customerStorageState, timezoneId, webPort, webURL } from './e2e/support/config';

const ci = !!process.env.CI;

export default defineConfig({
  testDir: './e2e',
  // Visual tests depend on the platform; they run in a container with playwright.visual.config.ts
  testIgnore: /visual\.spec\.ts/,
  fullyParallel: true,
  forbidOnly: ci,
  retries: ci ? 2 : 0,
  // Timeout layers: test 30 s, assertion 5 s; on CI the whole run takes at most 20 min
  timeout: 30_000,
  expect: { timeout: 5_000 },
  globalTimeout: ci ? 20 * 60_000 : undefined,
  reporter: ci
    ? [['blob'], ['junit', { outputFile: 'test-results/junit.xml' }], ['list']]
    : [['list'], ['html', { open: 'never' }]],
  use: {
    baseURL: webURL,
    locale: 'en-US',
    timezoneId,
    actionTimeout: 10_000,
    navigationTimeout: 15_000,
    trace: 'retain-on-failure',
    screenshot: 'only-on-failure',
    video: 'retain-on-failure',
  },
  projects: [
    { name: 'setup', testMatch: /.*\.setup\.ts/ },
    {
      name: 'chromium',
      use: { ...devices['Desktop Chrome'], storageState: customerStorageState },
      dependencies: ['setup'],
    },
    {
      name: 'webkit',
      use: { ...devices['Desktop Safari'], storageState: customerStorageState },
      dependencies: ['setup'],
      grep: /@smoke/,
    },
    {
      name: 'mobile',
      use: { ...devices['Pixel 7'], storageState: customerStorageState },
      dependencies: ['setup'],
      grep: /@mobile/,
    },
  ],
  webServer: [
    {
      name: 'api',
      command: 'dotnet run --project ../tests/Bookstore.E2E.Host',
      url: `${apiURL}/api/books`,
      env: { BOOKSTORE_API_PORT: String(apiPort) },
      reuseExistingServer: !ci,
      timeout: 180_000,
      gracefulShutdown: { signal: 'SIGTERM', timeout: 10_000 },
    },
    {
      name: 'web',
      command: `npm start -- --port ${webPort}`,
      url: webURL,
      env: { BOOKSTORE_API_URL: apiURL },
      reuseExistingServer: !ci,
    },
  ],
});
The use block holds the options that go to every test's browser context: baseURL, locale and timezoneId (added in post 8 for the time zone bug), and trace, screenshot and video, which leave evidence behind when a test fails. The same keys can be given in a project or in a single file's test.use(...); test.use({ storageState: buyerStorageState }) in post 10 was an example.
Timeouts are nested layers. The test timeout (30 seconds by default) covers the test function, the beforeEach hooks and fixture setup; teardowns get a separate period of the same length. The expect timeout (5 seconds) is for a single assertion. actionTimeout and navigationTimeout have no default: if you do not set them, a stuck click waits until the test timeout expires. The first version of the test from post 10's guessing section ended exactly like that: the output only said "Test timeout of 8000ms exceeded.", with nothing about which action was waiting for what. With a separate timeout on the click, the same failure came with its call log. globalTimeout is the upper limit for the whole run; I enabled it only on CI. test.slow() triples a test's timeout: test.info().timeout printed 90000.
Projects and webServer
A project runs the same tests with different settings. Bookstore has four projects: all tests in Chromium, the three tagged @smoke in WebKit, the search test tagged @mobile in Pixel 7 emulation; setup performs the login from post 7 and comes before the others as a dependency. Firefox is added the same way, as a project with devices['Desktop Firefox']. Running only the smoke tests:
$ npx playwright test --grep @smoke
Running 9 tests using 5 workers
  ✓  2 [setup] › e2e/auth.setup.ts:18:1 › sign in as Nevin (institution buyer) (326ms)
  ✓  1 [setup] › e2e/auth.setup.ts:14:1 › sign in as Ada (359ms)
  ✓  4 [chromium] › e2e/catalog.spec.ts:3:1 › search finds a book with a lowercase term @smoke @mobile (848ms)
  ✓  7 [webkit] › e2e/catalog.spec.ts:3:1 › search finds a book with a lowercase term @smoke @mobile (957ms)
  ✓  5 [webkit] › e2e/checkout.spec.ts:3:1 › a customer orders a book with a coupon @smoke (1.2s)
  ✓  6 [chromium] › e2e/checkout.spec.ts:3:1 › a customer orders a book with a coupon @smoke (1.7s)
  ✓  3 [chromium] › e2e/orders.spec.ts:3:1 › the order page shows a seeded order @smoke (1.8s)
  ✓  8 [webkit] › e2e/orders.spec.ts:3:1 › the order page shows a seeded order @smoke (791ms)
  ✓  9 [mobile] › e2e/catalog.spec.ts:3:1 › search finds a book with a lowercase term @smoke @mobile (590ms)
  9 passed (7.2s)
The setup tests ran even though they carry no @smoke tag: --grep is not applied to dependency projects. The whole suite is 21 tests and took 9.7 seconds. The entries in devices set values such as the viewport, user agent, deviceScaleFactor, isMobile and hasTouch together; Pixel 7 runs on the Chromium engine and the iPhone entries on WebKit.
The addresses now come from environment variables. Since post 6, 4200 and 5280 had been written into the config; for a second copy on the same machine, or a CI runner whose port is taken, they must be changeable:
// Default ports locally; CI or a second copy on the same machine changes them with environment variables
export const apiPort = Number(process.env.BOOKSTORE_API_PORT ?? 5280);
export const webPort = Number(process.env.BOOKSTORE_WEB_PORT ?? 4200);
export const apiURL = process.env.BOOKSTORE_API_URL ?? `http://127.0.0.1:${apiPort}`;
export const webURL = process.env.BOOKSTORE_WEB_URL ?? `http://localhost:${webPort}`;
The env option of webServer passes variables to the process it starts. The E2E host reads its port from BOOKSTORE_API_PORT; Angular's proxy setting became a proxy.conf.mjs instead of JSON and takes its target from process.env.BOOKSTORE_API_URL. proxyConfig in angular.json points to this file.
Writing Fixtures: test.extend
A fixture is a function that prepares something the test needs, hands it to the test and cleans it up afterwards: the code before use(...) is setup, the code after it is teardown. This post adds three fixtures to Bookstore's fixture file:
// Gets a token from the E2E host's token endpoint and opens an API context that carries it
async function signedInApi(playwright: PlaywrightWorkerArgs['playwright'], body: object): Promise<APIRequestContext> {
  const anonymous = await playwright.request.newContext({ baseURL: apiURL });
  const { accessToken } = await (await anonymous.post('/e2e/token', { data: body })).json();
  await anonymous.dispose();
  return playwright.request.newContext({ baseURL: apiURL, extraHTTPHeaders: { Authorization: `Bearer ${accessToken}` } });
}

export const test = base.extend<TestFixtures, WorkerFixtures>({
  // Once per worker: the admin token is only for preparing data
  adminApi: [
    async ({ playwright }, use) => {
      const api = await signedInApi(playwright, { customerId: 0, roles: ['admin'] });
      await use(api);
      await api.dispose();
    },
    { scope: 'worker' },
  ],
  // API calls on behalf of Ada; the same customer as the token in storageState
  customerApi: async ({ playwright }, use) => {
    const api = await signedInApi(playwright, { customerId: 1 });
    await use(api);
    await api.dispose();
  },
  // A new order per test; it is cancelled when the test ends
  placedOrder: async ({ data, customerApi }, use) => {
    const book = await data.book('Middlemarch', 48.75);
    const response = await customerApi.post('/api/orders', {
      data: { items: [{ bookId: book.id, quantity: 1 }], shippingCity: 'Izmir' },
    });
    expect(response.status(), await response.text()).toBe(201);
    const order: OrderDto = await response.json();

    await use(order);

    const cancelled = await customerApi.post(`/api/orders/${order.id}/cancel`);
    expect(cancelled.status(), 'teardown: cancel the seeded order').toBe(200);
  },
  // data, catalog, cart and pageErrors as before
});
Fixtures are lazy: a test sets up only the fixtures named in its parameters and their dependencies. For a test that asks for placedOrder, the chain is adminApi → data → customerApi → placedOrder. Test scope is the default; every test gets its own copy. Worker scope is set up once per worker process, and all tests of that worker share the same object: the right choice for adminApi, because it only carries a token and holds no state. { auto: true } is set up in every test even when its name is not mentioned; pageErrors above is one.
Worker scope is also easy to misuse. I created a "shared book" with a stock of 1 in a worker fixture and had two tests buy it. With a single worker:
  ✓  3 [chromium] › experiments/demo12.spec.ts:18:3 › first customer buys the shared book (549ms)
  ✘  4 [chromium] › experiments/demo12.spec.ts:18:3 › second customer buys the shared book (141ms)

    Error: {"type":"https://tools.ietf.org/html/rfc9110#section-15.5.10","title":"Insufficient stock","status":409,"detail":"Book 5 does not have 1 copies in stock.", ...}

    expect(received).toBe(expected) // Object.is equality

    Expected: 201
    Received: 409
With two workers both passed, because each worker created its own book. The outcome depends on how the tests are distributed across workers; this is the kind of flaky test we discussed in post 8. Test data that carries state should stay in test scope.
test.step, Tags and Annotations
test('the order page shows a seeded order', { tag: '@smoke' }, async ({ placedOrder, page }) => {
  await test.step('open the order page', async () => {
    await page.goto(`/orders/${placedOrder.id}`);
    await expect(page.getByRole('heading', { name: 'Order placed' })).toBeVisible();
  });

  await test.step('check the summary', async () => {
    await expect(page.getByText(placedOrder.reference)).toBeVisible();
    await expect(page.getByRole('definition').nth(1)).toShowPrice(48.75);
    await expect(page.getByRole('definition').nth(2)).toHaveText('TRK-E2E-1');
  });
});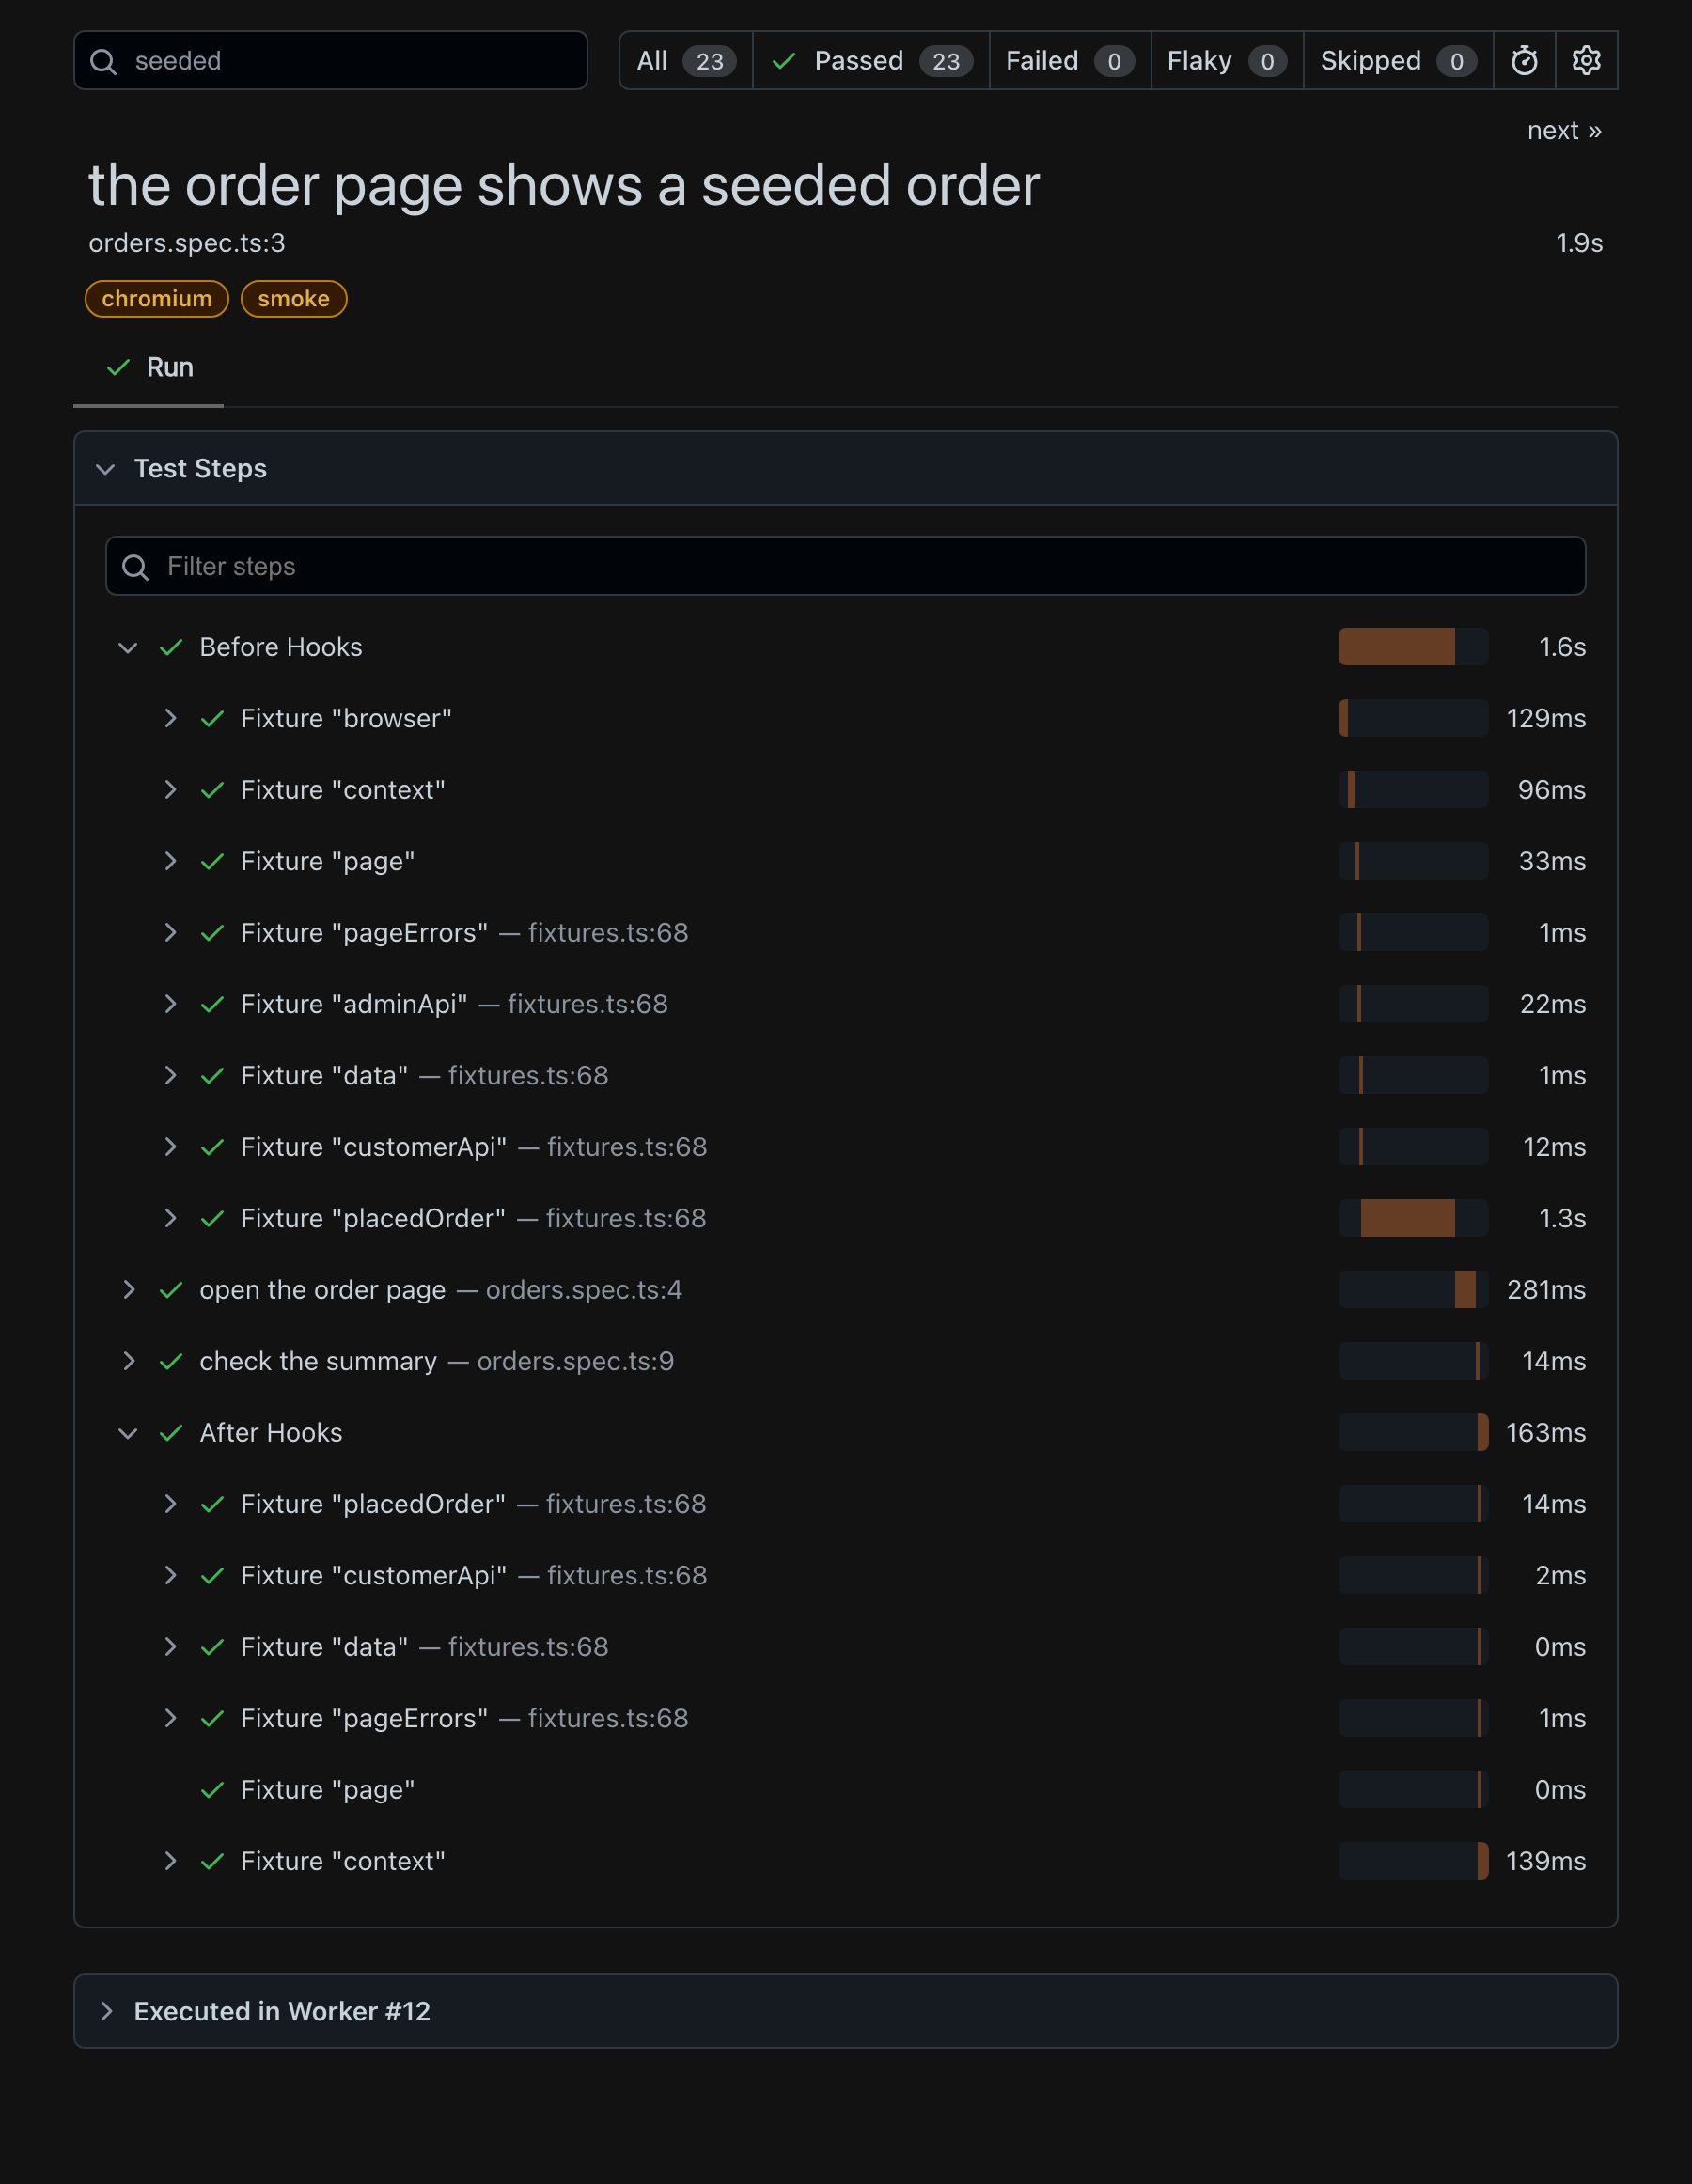
In the HTML report the steps become headings that tell the test's business flow. The report in the image was produced from the shards I merge below. "Before Hooks" shows the order in which fixtures were set up and "After Hooks" their teardown in reverse order: placedOrder took 1.3 seconds to set up (creating a book and placing an order) and its cancel request took 14 milliseconds at teardown. The steps also show up with the same names in the trace viewer. test.step(..., { box: true }) makes a failure point to the place where the step is called rather than to a line inside it; useful for wrapping page object methods.
A tag is given in the test's second argument as { tag: '@smoke' } or as an array, and filtered with --grep, --grep-invert or a project's grep. Annotations change how a test runs: test.skip(condition, reason) skips it, test.fixme() skips it entirely because of a known bug, test.slow() triples its timeout. { annotation: { type: 'issue', description: 'BOOK-142' } } adds information such as an issue number to the report:
  -  1 [chromium] › experiments/demo12c.spec.ts:3:1 › coupon codes are case-insensitive
  -  3 [chromium] › experiments/demo12c.spec.ts:8:1 › the catalog renders on a narrow screen
  ✓  2 [chromium] › experiments/demo12c.spec.ts:14:1 › a slow report export (514ms)

  2 skipped
  1 passed (4.8s)
Reporters and Merging Shards
Locally list and html run, on CI blob, junit and list. The junit file is for the CI system's test tab; blob is a zip that carries all results of a shard and is later merged into a single report. I split the suite into two shards, ran them one after the other and merged the blobs:
$ CI=1 npx playwright test --shard=1/2
Running 12 tests using 5 workers, shard 1 of 2
  12 passed (7.1s)
$ CI=1 npx playwright test --shard=2/2
Running 11 tests using 5 workers, shard 2 of 2
  11 passed (7.9s)
$ npx playwright merge-reports --reporter list ./all-blob-reports
...
  23 passed (15.4s)
The 21-test suite became 23 tests across two shards: the setup project ran in both shards, because each shard needs its own login. --reporter html produces a single HTML report from the same blobs; the image above comes from that report. On CI each shard is a separate job and the blobs are collected in one job as artifacts; the setup is in the Playwright post of the GitHub Actions series.
The .NET Side: PageTest and Settings
Microsoft.Playwright has base class packages for test frameworks: Microsoft.Playwright.NUnit, .MSTest, .Xunit and .Xunit.v3. PageTest does what the BrowserFixture from post 6 did by hand:
// PageTest opens a new BrowserContext and Page for every test; the browser comes from the BROWSER environment variable (chromium by default)
public sealed class CatalogPageTests : PageTest
{
    public override BrowserNewContextOptions ContextOptions() => new()
    {
        BaseURL = Environment.GetEnvironmentVariable("BOOKSTORE_WEB_URL") ?? "http://localhost:4200",
        Locale = "en-US",
        TimezoneId = "Europe/Istanbul",
    };

    [Fact]
    public async Task Out_of_stock_book_cannot_be_added()
    {
        await Page.GotoAsync("/");

        ILocator hobbit = Page.GetByRole(AriaRole.Listitem).Filter(new() { HasText = "The Hobbit" });
        await Expect(hobbit.GetByText("Out of stock")).ToBeVisibleAsync();
        await Expect(hobbit.GetByRole(AriaRole.Button, new() { Name = "Add to cart" })).ToBeDisabledAsync();
    }
}
Playwright's .NET documentation shows a .runsettings file for browser and launch options. Bookstore's E2E test project has run on Microsoft Testing Platform (MTP) since post 1, and dotnet test --settings answered:
Unknown option '--settings'In this project I selected the browser with the BROWSER environment variable; a BROWSER=webkit attempt failed with "Executable doesn't exist" because the WebKit build for 1.64.1 had not been downloaded, which means the variable was read. With Chromium the two .NET tests passed in 794 milliseconds.
| Playwright Test | .NET (Microsoft.Playwright.Xunit.v3) |
|---|---|
use: { baseURL, locale, timezoneId } | override of ContextOptions() |
projects | separate runs with the BROWSER variable |
test.extend fixtures | xUnit fixtures, constructor injection |
webServer | none; the services have to be started separately |
retries, --shard, blob report | the tools of the test runner and CI |
In Production
Separate the config by environment, but do not split it in two. A few lines that change with the ci variable (retries, reporter, forbidOnly, reuseExistingServer, globalTimeout) stay readable in one file; a separate CI config drifts away from the main one over time.
Think about the number of projects together with the duration. Every browser project runs the whole suite once more; in Bookstore, limiting WebKit and mobile to the smoke tests kept the suite at 21 tests. Leaving all tests in all browsers to a nightly run is a common compromise.
Fixture teardowns can fail too, and they break the result even if the test passed. Cancelling placedOrder depends on the 30-minute cancellation window; if the test ever takes longer, the teardown will get a 409. Write teardowns as carefully as tests.
Common Pitfalls
Sharing test data that carries state in a worker-scoped fixture. The stock example above failed with one worker and passed with two; the outcome depends on timing.
Hiding slowness by raising the global timeout. Raising the test timeout from 30 to 120 seconds reports a stuck test four times later. Set actionTimeout and navigationTimeout so that the stuck step itself shows up in the error message, and mark a test that is really slow with test.slow().
Relying only on pageerror in an Angular application. With the global error listeners on, uncaught errors arrive as console.error; the fixture from the guessing section caught nothing.
Using the HTML reporter directly in a sharded run. Every shard produces its own report and no single picture comes out; on CI use blob and merge-reports.
A Small Experiment
★☆☆ Remove the actionTimeout line from playwright.config.ts and run the first() test from post 10 without click({ timeout }). How did the error message and its duration change?
★★☆ Write a test fixture called buyerPage for Nevin Hanım: it opens a new browser context with buyerStorageState, hands over the page and closes the context when the test ends. Remove the test.use line from the bulk order test.
★★★ Make the teardown of placedOrder independent of the 30-minute window: what should it do if the cancel returns 409? Change the teardown so that it leaves a note in the report through test.info().annotations.
The fixtures in this post used the API only to prepare data. In the next and final post of the series we treat APIRequestContext as a test tool in its own right: API tests, hybrid scenarios that combine the UI and the API, and using the planner, generator and healer of Playwright Test Agents safely.