

The Node.js Event Loop on the Server: libuv Phases, process.nextTick, setImmediate and Blocking the Loop
The Node.js event loop passes through the libuv phases (pending, poll, check, close, timers) on every turn and drains the nextTick queue, then the promise queue, after every callback; that is why setImmediate runs before setTimeout(0) inside an I/O callback. With real measurements: a full thread pool holding a file read for 371 ms, blocking with JSON.parse and ReDoS, monitorEventLoopDelay, and the Bookstore price report holding /health for 481, 13 and 1 ms inline, chunked and in a worker.
Version note: The examples in this post were run with Node.js 26.13.1 (LTS, libuv 1.52.1) and TypeScript 7.0.2.
Guess First
In the API of Bookstore, the online bookstore used as the shared example across this site's series, a file is read, and when the read completes, the callback queues four separate pieces of work: a 0 ms timer, a setImmediate, the then of a resolved promise and a process.nextTick. At the end there is a synchronous console.log.
import { readFile } from "node:fs";

readFile(import.meta.filename, () => {
    setTimeout(() => console.log("setTimeout 0"), 0);
    setImmediate(() => console.log("setImmediate"));
    Promise.resolve().then(() => console.log("promise.then"));
    process.nextTick(() => console.log("process.nextTick"));
    console.log("readFile callback");
});
In which order are the five lines printed? If you know the browser's event loop you might expect setTimeout 0 before setImmediate; both seem to say "right away".
node labs/06/guess.tsreadFile callback
process.nextTick
promise.then
setImmediate
setTimeout 0Synchronous code first, then nextTick, then the promise, then setImmediate and the timer last. The order is not random; it comes from libuv's phases and from two queues that are drained between them. The JavaScript Advanced series post on the event loop in depth covered the browser's event loop. In this post we look at the server-side model, which work goes to the thread pool, how the event loop gets blocked and how to measure it, and finally we move Bookstore's price report to a worker thread.
The libuv Phases and the Queues in Between
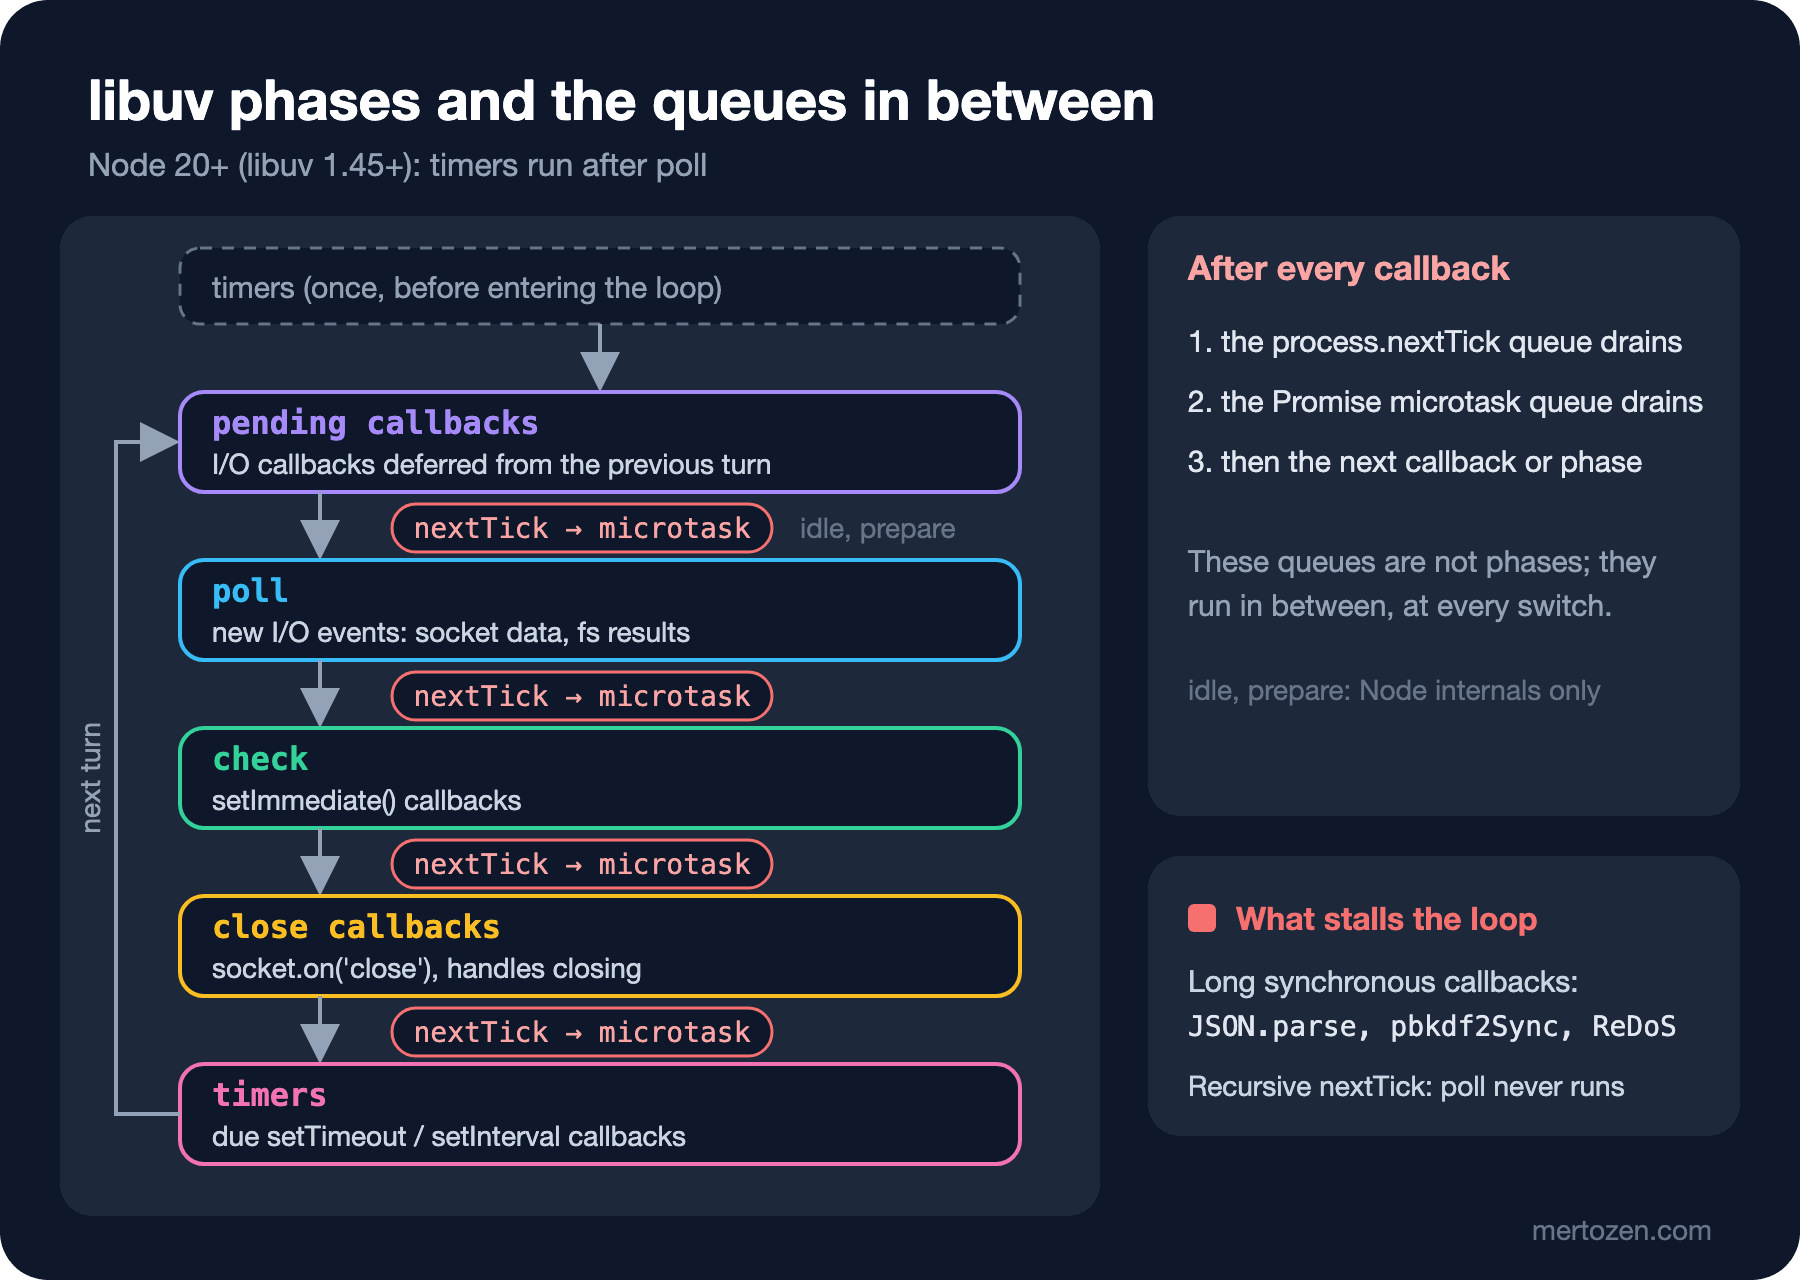
Node's event loop is libuv's loop, and on every turn it goes through the phases in a fixed order. Each phase has its own callback queue:
- pending callbacks: some I/O callbacks deferred from the previous turn, such as certain TCP errors.
- poll: collects new I/O events and runs their callbacks; data arriving on a socket, a file read that finished. If there is nothing else to wait for, the loop stops here and waits for I/O.
- check:
setImmediate()callbacks. - close callbacks: closing callbacks such as
socket.on('close'). - timers: due
setTimeoutandsetIntervalcallbacks.
There is a detail in the order: since libuv 1.45, that is since Node 20, timers run after poll on every turn; before that they ran at the start of the turn. For backward compatibility libuv runs timers once before entering the loop. The diagram in the Node documentation shows this as well. There are also idle and prepare phases, but they are only for Node's internal work.
process.nextTick and promise callbacks are in none of these phases. Every time Node calls into JavaScript to run a callback, once that callback finishes it fully drains the nextTick queue first and then V8's microtask queue, that is the promise callbacks; only then does it move on to the next callback or phase. The order in Guess First now reads naturally. The readFile callback ran in the poll phase. When it finished, the nextTick queue and then the promise queue drained. The loop moved from poll to check and setImmediate ran. The timer ran last, in the timers phase.
setTimeout(0) or setImmediate?
When called from inside an I/O callback the order is always as above: setImmediate first. When called from the main module the order is not deterministic, because the result depends on the timing at the moment the process enters the loop:
// From the main module (not inside an I/O callback): who runs first?
setTimeout(() => console.log("timeout"), 0);
setImmediate(() => console.log("immediate"));
for i in $(seq 1 40); do node labs/06/main-race.ts | head -1; done | sort | uniq -c 38 immediate
2 timeoutIn 2 of 40 runs the timer came first. Do not put an assumption that relies on this order into your code.
nextTick and Promises: The Order Changes in ESM
Promise.resolve().then(() => console.log("promise.then"));
process.nextTick(() => console.log("process.nextTick"));
echo "ESM:"; node labs/06/tick-vs-promise.mjs; echo "CJS:"; node labs/06/tick-vs-promise.cjsESM:
promise.then
process.nextTick
CJS:
process.nextTick
promise.thenThe same two lines print the promise first in an .mjs file and nextTick first in a .cjs file. In ESM the module itself is evaluated inside a promise chain, so the microtask queue drains before Node gets back to the nextTick queue. The practical lesson: do not write code that depends on the order between the two queues.
Which Work Goes to the Thread Pool?
In post 01 we saw libuv's 4-thread pool with pbkdf2. The more important question is who waits when the pool is full. Let's fill the pool with four slow pbkdf2 calls and at the same time read a file, do a DNS lookup and send a request to an HTTP server in our own process:
// 4 slow pbkdf2 calls fill the thread pool; what happens to fs, dns and the network?
import { pbkdf2 } from "node:crypto";
import { readFile } from "node:fs/promises";
import { lookup } from "node:dns/promises";
import { createServer } from "node:http";

const server = createServer((req, res) => res.end("ok"));
await new Promise<void>((resolve) => server.listen(0, "127.0.0.1", resolve));
const { port } = server.address() as { port: number };

const started = performance.now();
const at = (label: string) => console.log(`${label.padEnd(26)} ${Math.round(performance.now() - started)} ms`);

for (let i = 1; i <= 4; i++) {
    pbkdf2("correct horse", "bookstore-salt", 3_000_000, 32, "sha256", () => at(`pbkdf2 #${i}`));
}

await Promise.all([
    readFile(import.meta.filename).then(() => at("fs.readFile (thread pool)")),
    lookup("localhost").then(() => at("dns.lookup (thread pool)")),
    fetch(`http://127.0.0.1:${port}/`).then((r) => r.text()).then(() => at("HTTP request (OS async)")),
]);
server.close();
node labs/06/pool-queue.ts
UV_THREADPOOL_SIZE=8 node labs/06/pool-queue.tsHTTP request (OS async) 19 ms
pbkdf2 #2 371 ms
fs.readFile (thread pool) 371 ms
dns.lookup (thread pool) 374 ms
pbkdf2 #1 380 ms
pbkdf2 #4 404 ms
pbkdf2 #3 444 ms
---
fs.readFile (thread pool) 4 ms
dns.lookup (thread pool) 6 ms
HTTP request (OS async) 14 ms
pbkdf2 #1 300 ms
pbkdf2 #2 309 ms
pbkdf2 #4 382 ms
pbkdf2 #3 391 msA file read that takes a few milliseconds and a lookup of localhost waited 371 ms, because their turn only came when a pbkdf2 finished. The HTTP request finished in 19 ms: network I/O does not use the pool, it runs on the operating system's async mechanism. With the pool at 8, the file and DNS work dropped to 4–6 ms. The production equivalent: when password verification with scrypt or pbkdf2 gets busy, seemingly unrelated file reads and the resolution of the database host name slow down. dns.lookup uses the pool; functions such as dns.resolve4 query over the network directly and do not enter it.
Blocking the Event Loop and Measuring It
A full pool slows things down; a busy main thread stops everything. perf_hooks.monitorEventLoopDelay sets a timer at regular intervals and keeps a histogram of how late the timer runs. Let's measure two common blockers with it:
// Two common ways to block the event loop without noticing
import { monitorEventLoopDelay } from "node:perf_hooks";
import { pbkdf2Sync } from "node:crypto";
import { setTimeout as delay } from "node:timers/promises";

const histogram = monitorEventLoopDelay({ resolution: 10 });
histogram.enable();

async function measure(label: string, work: () => void): Promise<void> {
    await delay(50);
    histogram.reset();
    await delay(50);
    const started = performance.now();
    work();
    const took = performance.now() - started;
    await delay(50);
    console.log(`${label.padEnd(34)} ${took.toFixed(0).padStart(5)} ms on the main thread, loop delay max ${(histogram.max / 1e6).toFixed(0)} ms`);
}

// 1) A big JSON payload: 1,000,000 order lines
const lines = Array.from({ length: 1_000_000 }, (_, i) => ({ orderId: i, isbn: "9780441172719", quantity: 2, unitPrice: 349.9, status: "Paid" }));
const payload = JSON.stringify(lines);
console.log(`payload size: ${(payload.length / 1024 / 1024).toFixed(1)} MB`);
await measure("JSON.parse(payload)", () => JSON.parse(payload));

// 2) Synchronous password hashing in a request handler
await measure("pbkdf2Sync, 600,000 iterations", () => pbkdf2Sync("correct horse", "bookstore-salt", 600_000, 32, "sha256"));
payload size: 84.8 MB
JSON.parse(payload) 149 ms on the main thread, loop delay max 153 ms
pbkdf2Sync, 600,000 iterations 57 ms on the main thread, loop delay max 68 msParsing an 85 MB JSON means no other request is handled for 149 ms; we process large bodies such as the order export as streams in post 09. Synchronous hashing looks small one call at a time, but at 50 login requests a second it eats almost the whole main thread. Async pbkdf2 does the same work in the pool.
A bad regular expression: ReDoS
The third blocker is the sneakiest. This pattern that validates coupon codes looks innocent, but because of the nested + the amount of backtracking multiplies with every character on an input that does not match. When user input triggers this, it is called ReDoS:
// Each extra character roughly doubles the work of the vulnerable pattern
const vulnerable = /^([A-Z0-9]+-?)+$/;
const safe = /^[A-Z0-9]+(-[A-Z0-9]+)*$/;

// Warm-up: V8 compiles a regular expression to machine code after a few runs
for (let i = 0; i < 20; i++) {
    vulnerable.test("SUMMER-2026!");
    safe.test("SUMMER-2026!");
}

for (const length of [20, 22, 24, 26, 28]) {
    const input = "BOOKSTORE2026BOOKSTORE2026BOOK".slice(0, length - 1) + "!";
    let started = performance.now();
    vulnerable.test(input);
    const slow = performance.now() - started;
    started = performance.now();
    safe.test(input);
    const fast = performance.now() - started;
    console.log(`${String(length).padStart(2)} chars: vulnerable ${slow.toFixed(1).padStart(7)} ms, safe ${fast.toFixed(3)} ms`);
}
console.log(safe.test("SUMMER-2026-BOOKS"), safe.test("SUMMER--2026"));
20 chars: vulnerable 2.3 ms, safe 0.001 ms
22 chars: vulnerable 9.0 ms, safe 0.001 ms
24 chars: vulnerable 35.9 ms, safe 0.002 ms
26 chars: vulnerable 140.6 ms, safe 0.002 ms
28 chars: vulnerable 568.0 ms, safe 0.002 ms
true falseEvery two characters multiply the time by four; at the same rate 34 characters would take more than half a minute (I did not measure that, I computed it from the rate). The fixed pattern accepts the same language, but because it makes the dash a mandatory separator there is no ambiguity left. For every regular expression applied to user input, watch out for nested repetition and limit the input length before the regular expression runs.
The Price Report in Bookstore: Inline, Chunked and Worker
We now actually add the price report from post 01 to the API. The report computes revenue including VAT and the average unit price over synthetic order lines; 20 million lines. We can run the same calculation three ways:
// Runs in one go: the event loop is blocked until it returns
export function buildPriceReport(rows: number): PriceReport {
    const acc = { revenue: 0, units: 0 };
    addRows(acc, 0, rows);
    return toReport(rows, acc);
}

// Same work in slices; between slices the event loop gets a turn (check phase)
export async function buildPriceReportChunked(rows: number, chunkSize = 250_000): Promise<PriceReport> {
    const acc = { revenue: 0, units: 0 };
    for (let from = 0; from < rows; from += chunkSize) {
        addRows(acc, from, Math.min(from + chunkSize, rows));
        await yieldToLoop();
    }
    return toReport(rows, acc);
}
yieldToLoop is setImmediate from node:timers/promises. By awaiting it every 250,000 lines, the report gives the loop's poll phase, that is the waiting requests, a turn. The third way is to move the work to a separate thread. Every worker opened with worker_threads has its own V8 instance and its own event loop; it talks to the main thread through messages:
// Runs on a separate thread with its own V8 isolate and event loop
import { parentPort, workerData } from "node:worker_threads";
import { buildPriceReport } from "#services/priceReport";

const { rows } = workerData as { rows: number };
parentPort!.postMessage(buildPriceReport(rows));
import { Worker } from "node:worker_threads";
import { once } from "node:events";
import type { PriceReport } from "#services/priceReport";
const workerUrl = new URL("../workers/priceReportWorker.ts", import.meta.url);
// Offloads the report to a worker thread; the main event loop stays free
export async function buildPriceReportInWorker(rows: number): Promise<PriceReport> {
const worker = new Worker(workerUrl, { workerData: { rows } });
const [report] = (await once(worker, "message")) as [PriceReport];
return report;
}The worker file is .ts too; type stripping works in workers as well, and the #services alias resolves from the same package.json. The route picks one based on the mode query parameter: GET /api/reports/prices?mode=inline|chunked|worker. I also added a diagnostic endpoint to the API that returns the event loop delay:
import { monitorEventLoopDelay } from "node:perf_hooks";

// Samples event loop delay every 10 ms; values are in nanoseconds
const histogram = monitorEventLoopDelay({ resolution: 10 });
histogram.enable();

const toMs = (ns: number): number => Math.round(ns / 1e5) / 10;

// Returns the delay since the last call and starts a new measurement window
export function takeEventLoopDelay(): { p50Ms: number; p99Ms: number; maxMs: number } {
    const stats = { p50Ms: toMs(histogram.percentile(50)), p99Ms: toMs(histogram.percentile(99)), maxMs: toMs(histogram.max) };
    histogram.reset();
    return stats;
}
labs/06/probe-report.ts resets the histogram for each mode, starts the report, calls /health every 20 ms while the report runs and records the slowest answer, and finally reads the delay histogram:
node src/server.ts
node labs/06/probe-report.ts
inline report 479 ms | slowest /health 481 ms | loop delay p99 488.6 ms, max 488.6 ms | revenue 19707600000.05
chunked report 472 ms | slowest /health 13 ms | loop delay p99 22.7 ms, max 22.7 ms | revenue 19707600000.05
worker report 503 ms | slowest /health 1 ms | loop delay p99 11 ms, max 11 ms | revenue 19707600000.05All three modes computed the same revenue in about the same time. The difference is in what other requests went through during that time. Inline, /health waited 481 ms and the event loop delay equals the report's duration. Chunked, /health waited 13 ms at worst, because each slice takes 10–20 ms. With the worker the main thread was never busy; /health answered in 1 ms. The 11 ms you see even in an idle process comes from the measurement resolution: the histogram measures 10 ms intervals. One more note: in my runs a block that came right after reset() was sometimes not reflected in the histogram, so the probe waits 50 ms before each measurement.
Which one to choose? Chunking needs no extra infrastructure, but it can lengthen the total time and requires splitting the code into slices. A worker truly runs the work in parallel, but opening a worker and copying data between threads have a cost; for frequent jobs you use a worker pool instead of opening a new worker every time. If the work takes seconds or needs retries, the best option is to put it on a queue and process it in a separate process; the Message Queues and Background Jobs series covered that on the .NET side.
In Production
Collect event loop delay as a metric. If the p99 delay goes above a few tens of milliseconds, there is synchronous work somewhere; it should be the first graph you look at when latency complaints arrive. Exporting this metric with OpenTelemetry is a topic for the Observability series.
Do not use synchronous APIs on the request path. readFileSync, pbkdf2Sync, zlib.gzipSync and execSync are acceptable while the application starts, not in a request handler.
Limit large JSON. Put a size limit on request bodies; stream large responses instead of producing them with a single JSON.stringify.
Watch the work that uses the thread pool. In a service that uses fs, crypto or zlib heavily, tune UV_THREADPOOL_SIZE by measuring; work that fills the pool also delays the dns.lookup done while opening a database connection.
Common Pitfalls
Starving I/O with recursive process.nextTick. The loop does not move to the next phase until the nextTick queue is empty. I compared a callback that reschedules itself 100,000 times with a timer that should run after 1 ms:
nextTick      done in 12 ms, the 1 ms timer ran after 100,000 calls
setImmediate  done in 1237 ms, the 1 ms timer ran after 45 calls
With nextTick the timer could not run at all until every call had finished; in an endless chain it would never run. setImmediate leaves every call to the next turn, so the timer got in at the 45th call. The price is visible too: because every turn goes through poll, 100,000 calls took 1.2 seconds. Use setImmediate for work that reschedules itself.
The "an async function runs on another thread" misconception. In C# you send CPU work to the ThreadPool with Task.Run; the async keyword in JavaScript has no such effect:
// An async function still runs on the same thread until its first await
import { pbkdf2Sync } from "node:crypto";

let ticks = 0;
const interval = setInterval(() => ticks++, 10);

async function hashPasswords(count: number): Promise<number> {
    for (let i = 0; i < count; i++) {
        pbkdf2Sync(`password-${i}`, "bookstore-salt", 600_000, 32, "sha256");
    }
    return count;
}

const started = performance.now();
const pending = hashPasswords(10);
console.log(`hashPasswords() returned a promise after ${Math.round(performance.now() - started)} ms, interval ticks so far: ${ticks}`);
await pending;
clearInterval(interval);
hashPasswords() returned a promise after 421 ms, interval ticks so far: 0The function could only return its promise after 421 ms, and the 10 ms interval did not run even once in that time.
Taking setTimeout(fn, 0) to mean "right away". It waits until the timers phase, and in the main module its order relative to setImmediate is not deterministic.
Opening a worker on every request. For short jobs, starting a worker can cost more than the job itself; measure, and use a pool if needed.
A Small Experiment
★☆☆ Inside the callback in labs/06/guess.ts, add a second process.nextTick inside a setTimeout. Write down the order of the output before you run it.
★★☆ Run buildPriceReportChunked with a chunkSize of 50,000 and of 2,000,000. How do the report's total time and the slowest /health change? What is the trade-off between them?
★★★ Rewrite buildPriceReportInWorker to use a fixed pool of two workers instead of opening a new worker on every call. Run the probe with five report requests at once and compare the two approaches.
We have seen the order of the event loop; in the next post we move on to the async patterns built on it: moving from callbacks to promises, EventEmitter, cancellation with AbortSignal, and AsyncLocalStorage for carrying per-request context.