

Amortized Analysis: Why List<T>.Add Counts as O(1)
List<T>.Add sometimes copies the whole list, but because capacity doubles, the total cost of n Adds never exceeds 3n; that's why it counts as amortized O(1). The aggregate, accounting and potential methods, 50 billion copies with +10 growth, Dictionary's prime sizes and a 38 ms resize spike, with real measurements.
Version note: The code in this post was built and run with .NET 10 (C# 14); measurements were taken with BenchmarkDotNet 0.15.8 and tests with xUnit v3 4.0.2.
Guess First
The Remarks section of the Microsoft Learn page for List<T>.Add says: if Count is less than Capacity, this method is O(1); if the capacity needs to be increased, it's O(n), where n is Count. So some Add calls copy the whole list into a new array.
You add a million elements to an empty List<int>. Across all those Adds, how many elements get copied in total? Around a million, twenty million (half the list on average per resize, log₂ n times), or hundreds of billions? And one more: what would the number be if the list grew by 10 elements each time instead of doubling?
What Amortized Analysis Measures
So far we've looked at the cost of each operation one at a time. For Add that view gives two different answers: O(1) most of the time, O(n) once in a while. If we go by the worst case we'd say "n Adds are O(n²)" and be wrong, because the expensive Adds are very rare.
Amortized analysis looks at the total cost of a sequence of operations and divides it by the number of operations. "Add is amortized O(1)" means "the total cost of n Adds is O(n)." This is not an average case: there's no probability and no assumption about random input. It's an upper bound guaranteed for every possible sequence of Adds, including the worst one. CLRS (Introduction to Algorithms by Cormen, Leiserson, Rivest and Stein) defines it as analysis that guarantees the average performance of each operation in the worst case.
Counting Copies: Our Own Dynamic Array
Before the theory, let's count. I wrote a small class that mimics the internal logic of List<T>, lets you choose a growth policy and counts how many elements its resizes copy:
public enum GrowthPolicy { Doubling, PlusTen }

// A minimal dynamic array that counts how many element copies its resizes cost.
public sealed class GrowableArray<T>(GrowthPolicy policy, int initialCapacity = 4)
{
    private T[] _items = new T[initialCapacity];

    public int Count { get; private set; }
    public int Capacity => _items.Length;
    public long CopiedElements { get; private set; }
    public int Resizes { get; private set; }

    public void Add(T item)
    {
        if (Count == _items.Length)
        {
            var newCapacity = policy == GrowthPolicy.Doubling ? _items.Length * 2 : _items.Length + 10;
            var bigger = new T[newCapacity];
            Array.Copy(_items, bigger, Count);
            CopiedElements += Count;
            Resizes++;
            _items = bigger;
        }
        _items[Count++] = item;
    }

    public T this[int index] => index < Count ? _items[index] : throw new ArgumentOutOfRangeException(nameof(index));
}
Real numbers after adding 1,000 to 1,000,000 elements with both policies:
         n  doubling copies  per add       +10 copies    per add
     1,000            1,020     1.02           49,900       49.9
    10,000           16,380     1.64        4,999,000      499.9
   100,000          131,068     1.31      499,990,000     4999.9
 1,000,000        1,048,572     1.05   49,999,900,000    49999.9
Over a million Adds the doubling array copied 1,048,572 elements in total: a little over one copy per Add. The array growing by a fixed +10 copied 49.9 billion elements; about n/20 per Add. The answer to the guessing question: about a million with doubling, fifty billion with +10.
You may have noticed the "per add" column bouncing between 1.02 and 1.64. The reason is where n stops relative to the last resize. At n = 10,000 the last resize went from 8,192 to 16,384 and copied 8,192 elements; n is right at the start of the new capacity. But the ratio never goes above 2. We'll see why now.
Three Proof Methods
There are three classic ways to prove an amortized cost. All three reach the same result; they differ in which intuition they put first.
The aggregate method: compute the total, divide
The most direct way is to compute the total cost. Capacity starts at 4 and doubles every time it fills up. Over n Adds the resizes happen at 4, 8, 16, … , 2ᵏ elements, with 2ᵏ < n. Total copies:
4 + 8 + 16 + ... + 2^k  =  2^(k+1) - 4  <  2 * 2^k  <  2n

cost(n Add)  =  n + copies  <  n + 2n  =  3n     // total cost: n writes + copies
amortized    =  3n / n  =  3  ->  O(1)
The sum of a geometric series can't exceed twice its last term. That one sentence is the heart of the whole analysis. The chart below plots the cost of the first 33 Adds:
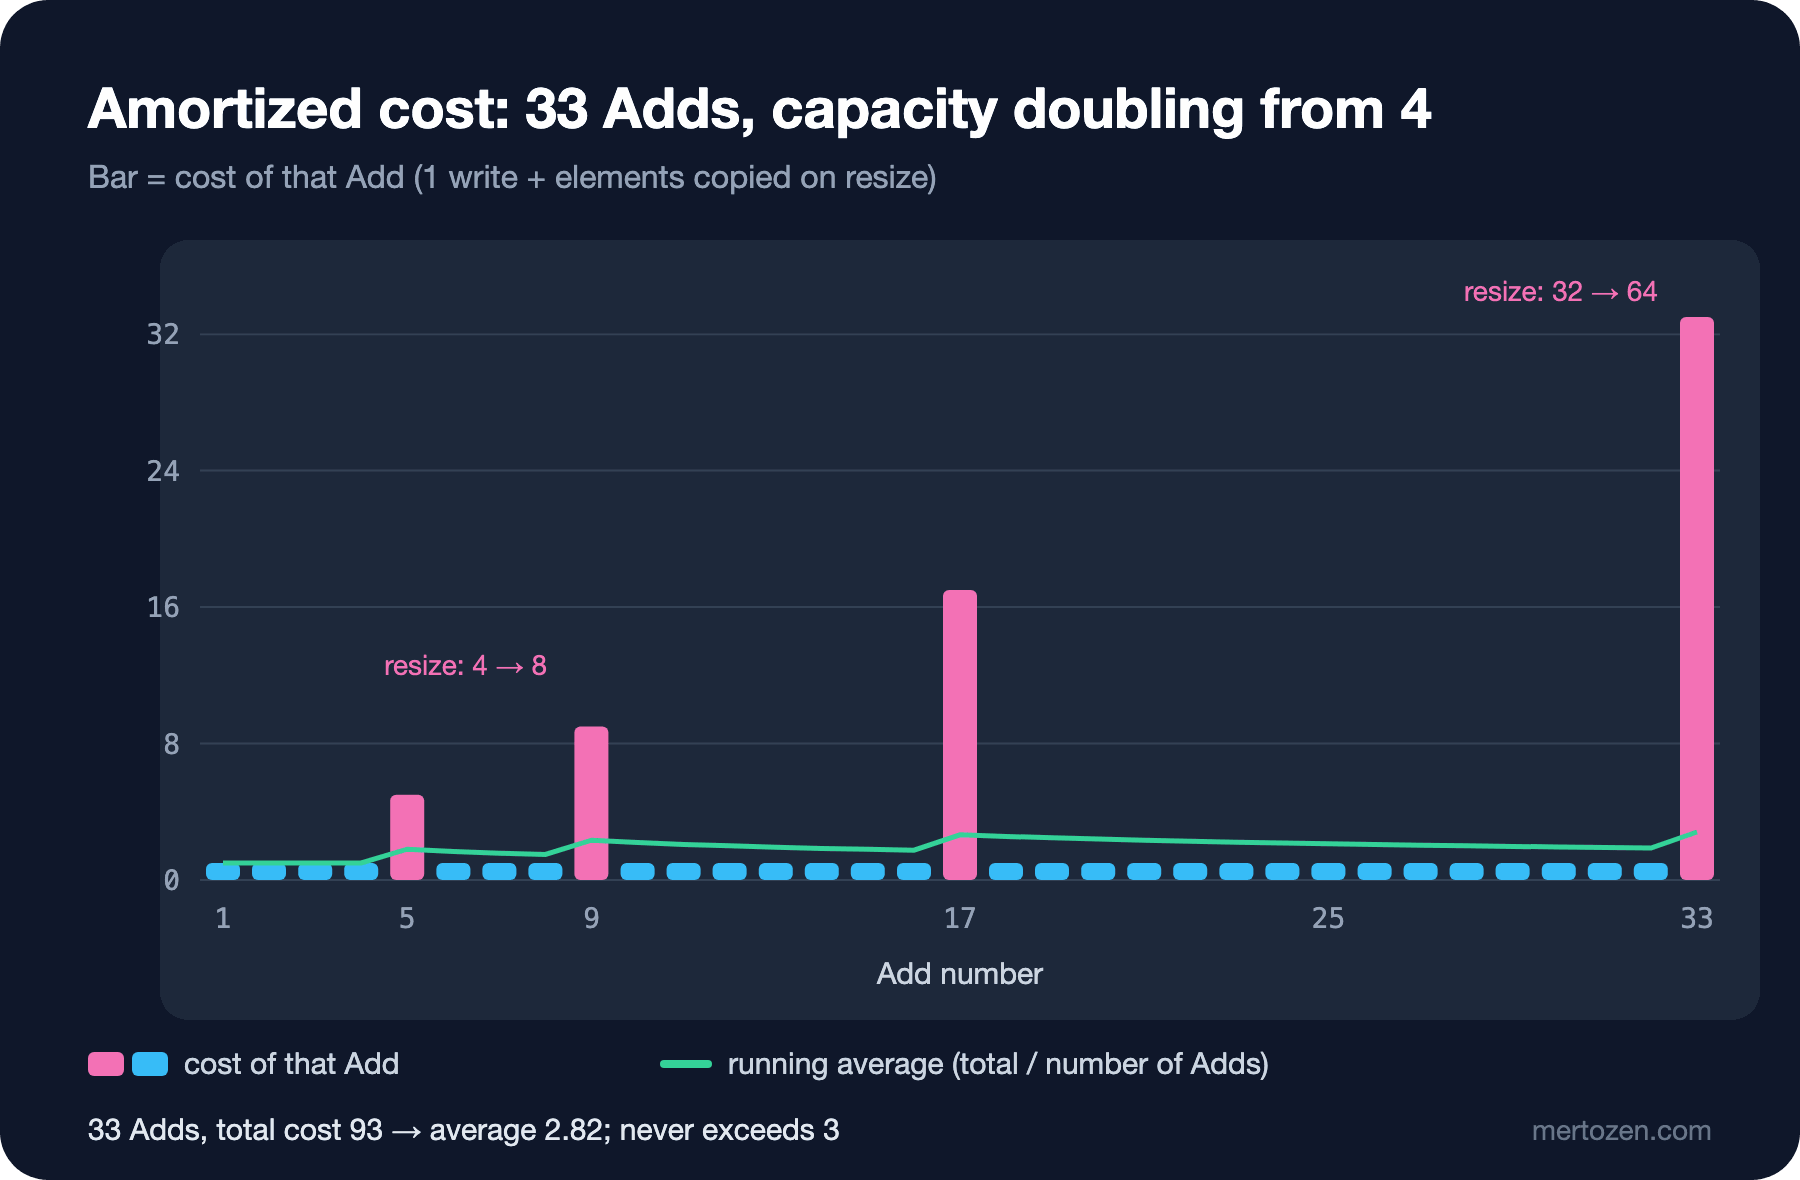
The pink bars are the resize moments: the 5th, 9th, 17th and 33rd Adds copy 4, 8, 16 and 32 elements respectively. The bars grow, but the gaps between them grow at the same rate; the green line, the average so far, never goes above 3. The 33 Adds cost 93 in total, an average of 2.82.
The accounting (banker's) method: every Add pays 3 tokens
The second method is a bookkeeping story. We charge every Add a fixed price of 3 tokens, more than its real cost. 1 token pays for writing the element. The remaining 2 tokens are left on that element as "credit."
When capacity goes from C to 2C, C elements must be copied. The number of elements added since the last resize is C/2, and each of them carries 2 tokens: C tokens in total. Those tokens pay for the copy exactly. As long as the bank account never goes negative, the total paid (3n) is an upper bound on the real total cost. The beauty of this method is that it gives you the intuition "the cheap operations paid for the expensive one in advance" directly.
The potential method: energy stored in the structure
The third method attaches the tokens not to individual elements but to the whole data structure. We define a potential function: Φ = 2·Count − Capacity. Right after a resize the array is half full, Φ ≈ 0. Every cheap Add raises Φ by 2. When the array fills up Φ = Capacity, and the copy cost of the resize is paid from that stored potential. Amortized cost = real cost + ΔΦ; for a cheap Add that's 1 + 2 = 3. For an Add with a resize the real cost is C + 1, while Φ drops from C to 2 (ΔΦ = 2 − C); the total is 3 again. The potential method is the standard tool for analyzing more complex structures such as splay trees and Fibonacci heaps; for everyday intuition the first two are enough.
Why ×2: The Cost of Growing by a Fixed +10
Let's do the same aggregate calculation for +10 growth. Over n Adds there are about n/10 resizes, and the i-th resize copies 10·i elements:
10 + 20 + 30 + ... + n  =  10 * (1 + 2 + ... + n/10)  ~  n^2 / 20

amortized  ~  n / 20  ->  O(n)     // per-Add cost grows with n
The 49,999,900,000 in the table is exactly this: 1,000,000² / 20. Arithmetic growth means steps that stay the same size as n grows; geometric growth means the step grows in proportion to the list. Amortized O(1) doesn't require a growth factor of exactly 2; any constant multiplier greater than 1 (such as 1.5) is enough. A smaller factor leaves less idle memory but means more resizes and more total copies. .NET chose 2 for List<T>. With BenchmarkDotNet, 100,000 Adds:
| Method              | N      | Mean         | Ratio  | Allocated     |
|-------------------- |------- |-------------:|-------:|--------------:|
| ListAdd             | 100000 |    128.44 us |   1.00 |    1024.58 KB |
| ListAddWithCapacity | 100000 |     84.13 us |   0.66 |     390.76 KB |
| GrowableDoubling    | 100000 |    137.05 us |   1.07 |    1024.55 KB |
| GrowablePlusTen     | 100000 | 86,243.56 us | 673.58 | 1954092.54 KB |
Our doubling array runs at the same speed and with the same allocations as List<T> (1,024 KB: the sum of all the intermediate arrays from 4 to 131,072). The +10 array is 673 times slower and allocates 1.9 GB: because every resize allocates a new array, the same n²/20 calculation applies to memory too. The List<T> given its capacity up front never resizes, so it's 34 percent faster and allocates a single 390 KB array. Those 34 percent are the difference between amortized O(1) and real O(1).
List<T>, Dictionary and Others in .NET
Let's observe the theory in real collections. The values taken by List<int>.Capacity and Dictionary<int, int>.EnsureCapacity(0) (which returns the current capacity) while adding 1,000 elements:
List<int>       : 0 -> 4 -> 8 -> 16 -> 32 -> 64 -> 128 -> 256 -> 512 -> 1024
Dictionary<,>   : 0 -> 3 -> 7 -> 17 -> 37 -> 89 -> 197 -> 431 -> 919 -> 1931
List<T> starts empty, goes to 4 on the first Add and then doubles every time. Dictionary grows through HashHelpers.ExpandPrime in the dotnet/runtime source: it takes twice the old size and picks the first prime above it (7 → 14 → 17, 17 → 34 → 37). A prime size helps hashes spread more evenly across buckets. Growth is still geometric, so Add is still amortized O(1). Because the dictionary redistributes every entry into new buckets during a resize, that single operation is O(n), just like in the list. API (Application Programming Interface) details are in "A Guide to C# List<T>: Adding, Removing, Capacity, Sorting and Searching" and "C# Dictionary and HashSet: TryGetValue, Key Equality and Comparers" in the C# Collections series.
The same idea shows up elsewhere. Queue<T> is a circular buffer; when it fills up it doubles via GrowFactor = 2 in the source (growing by at least 4 elements) and copies the elements in order to the start of the new array. StringBuilder takes a different route: when it fills up it doesn't copy the existing characters, it appends a new chunk. The new chunk is as large as the length so far, capped at 8,000 characters (MaxChunkSize). Because there's no copying at all, Append is amortized O(1); the price is ToString() stitching the chunks together. In the Union-Find post of the Algorithms and Data Structures series we'll see path compression come down to nearly constant time through an amortized argument as well.
Amortized Doesn't Mean Every Operation Is Fast
Amortized O(1) is a guarantee about the total. It promises nothing about a single operation. I timed every Add with a Stopwatch while adding 40 million longs to an empty list and printed the ones above 1 millisecond:
presize=False n=40,000,000 total=1,165 ms adds over 1 ms: 5
  Add #  2,097,152 (Count 2,097,152 -> capacity 4,194,304) took    1.34 ms
  Add #  4,194,304 (Count 4,194,304 -> capacity 8,388,608) took    3.06 ms
  Add #  8,388,608 (Count 8,388,608 -> capacity 16,777,216) took    6.12 ms
  Add # 16,777,216 (Count 16,777,216 -> capacity 33,554,432) took   14.35 ms
  Add # 33,554,432 (Count 33,554,432 -> capacity 67,108,864) took   38.48 ms
presize=True n=40,000,000 total=1,100 ms adds over 1 ms: 0
The 40 million Adds took 1.1 seconds in total; under 30 nanoseconds on average. But the 33,554,433rd Add alone took 38 milliseconds: it copied a 256 MB array into a new 512 MB one. The time roughly doubles with every resize, because the copied data doubles. That's exactly what amortized analysis says: the cost doesn't disappear, it piles up in rare moments.
With the list presized via new List<long>(n), not a single Add went above 1 millisecond. If you don't know the capacity up front but have a rough estimate, EnsureCapacity does the same job later. Careful: large resizes aren't only copying; for arrays over 85,000 bytes they mean an LOH (Large Object Heap) allocation and the old array becoming garbage, both extra pressure on the GC (Garbage Collector).
In Production
In throughput-oriented code (batch jobs, report generation, ETL (Extract, Transform, Load) pipelines), amortized O(1) is a sufficient guarantee. The total time matters and resize spikes melt into the total.
Latency-oriented code is different. In an API with a p99 target (the time 99 percent of requests stay under), growing a large in-memory collection during a request can add 40 milliseconds to that request. On real-time paths such as game loops, audio processing or trading, a single spike is unacceptable. On those paths do three things: preallocate capacity, reuse collections across requests (Clear() keeps the capacity) and measure with high percentiles, not averages.
There's a flip side: a growing collection never shrinks. List<T>.Clear() and RemoveAt don't lower the capacity; a cache list that once reached 10 million elements keeps its 10-million array even when it's empty. If you really want to shrink it, call TrimExcess(); but do that in a loop and you can lose the amortized guarantee through grow-shrink oscillation.
Common Pitfalls
Taking amortized for average case. There's no probability in amortized analysis; there's a total guarantee that holds for every input. The average case depends on the distribution of the input.
Reading amortized O(1) as "every call is fast." The total is cheap; a single call can be expensive. If you have a latency target, measure the spike.
Growing your own buffer by a fixed step. Code like new byte[old.Length + 4096] produces O(n²) total copies on large inputs. Grow geometrically.
Not passing the capacity when you know it. new List<T>(source.Count) or new Dictionary<TKey, TValue>(count) eliminates every resize; Select(...).ToList() already does this itself when it knows the source size.
Forgetting the memory peak of a resize. During the copy the old and new arrays are in memory at the same time: growing a 256 MB list means 768 MB for a moment.
A Small Experiment
★☆☆ Add a GrowthPolicy with a factor of 1.5 to GrowableArray. What are the total copy count and the final capacity for 1,000,000 Adds? Compare with doubling.
★★☆ Picture a Stack implementation that doubles when full and halves when Count drops below half the capacity. Why is a sequence of Push, Pop, Push, Pop right at the capacity boundary O(n²)? How does moving the shrink threshold to a quarter fix it?
★★★ Measure the 5 slowest operations while adding 10 million keys to a Dictionary<int, int> (like the spike code above). Confirm the resize moments with EnsureCapacity(0) and repeat the experiment with a capacity passed to the constructor.
So far in this series we've always worked with counts and bounds. But as you've seen, whenever real time drifted from what theory said (149 times instead of 100, 18 times instead of 10), the reason was always something outside the theory: the cache, the GC, allocations. In the last post of the series we look at the things Big-O doesn't tell you and learn to estimate complexity by measuring it with BenchmarkDotNet.