

Scrum Metrics: What Velocity, Burndown and Sprint Goal Success Do and Don't Tell You

The Scrum Guide defines no metrics; velocity, burndown and Sprint Goal success help the team's own forecasting but do not show value. In a real C# run, the burndown of a Sprint whose scope grew by 3 items mid-Sprint sits at 12 on day four, the same as at the start, while the burnup shows progress and the scope change separately. The post also covers comparing velocity across teams and Goodhart's law.
Version note: This post is based on the Scrum Guide 2020 (November 2020, Ken Schwaber and Jeff Sutherland). The C# code in this post was run as a file-based app (dotnet run SprintCharts.cs) with .NET 10 SDK (Software Development Kit) 10.0.402; the output shown is from a real run.
Guess First
A year ago Bookstore had two teams and both used story points: the team building the return flow finished an average of 34 story points per Sprint, the payments team 52. The engineering director set two targets for the next quarter: the returns team should "get closer to the payments team's level", and both teams should increase their velocity by 10 percent.
Six months later both teams' velocity had indeed risen by more than 10 percent. Did the product evolve faster? Did support emails drop, did release frequency rise? Write down your guess; most of the answer is in Goodhart's law at the end of this post, but first let us look at what the metrics are.
The Guide Defines No Metrics
The word velocity does not appear in the Scrum Guide 2020, story points do not appear, and there is no mandatory chart. The only paragraph about metrics is in the Sprint section: practices such as burn-downs, burn-ups and cumulative flows exist to forecast progress and have proven useful, but they do not replace the importance of empiricism. In complex environments, what will happen is unknown; only what has already happened may be used for forward-looking decisions.
History points the same way. The 2010 Guide required a burndown chart; the 2011 revision removed that and only asked that the remaining work in a Sprint be summed and known every day and that the trend toward completion be tracked. The 2020 version dropped that too. The Guide's stance on metrics today: the team decides what to measure; but measurement cannot replace looking at the Increment and at what actually happened.
This post focuses on what metrics mean and how they are misused. How story points are assigned and the mechanics of forecasting with velocity belong to the upcoming Estimation and Planning series; calculating flow metrics such as cycle time, throughput and WIP (Work in Progress) is in the Kanban series post "Flow Metrics: WIP, Throughput, Work Item Age and Cycle Time".
Burndown and Burnup: Same Sprint, Two Stories
In Sprint 23 the Bookstore team kept a daily snapshot of the board. They used item counts instead of story points; the team had switched to them by a Retrospective decision (the reason is in the Goodhart section below). The Sprint started with 12 items; on day four Selin added three urgent items because of a change at the payment provider, and on day seven one item was removed. The code below processes both this daily data and a summary of the last six Sprints:
using System.Globalization;

CultureInfo.CurrentCulture = CultureInfo.GetCultureInfo("en-US");

// Sprint 23: daily snapshot of the Sprint Backlog (item counts, not points)
DaySnapshot[] days =
[
    new(0, 12, 0), new(1, 12, 0), new(2, 12, 1), new(3, 12, 2),
    new(4, 15, 3), new(5, 15, 4), new(6, 15, 5), new(7, 14, 6),
    new(8, 14, 8), new(9, 14, 10), new(10, 14, 11)
];

Console.WriteLine("day  scope  done  remaining");
foreach (DaySnapshot d in days)
{
    Console.WriteLine($"{d.Day,3}  {d.Scope,5}  {d.Done,4}  {d.Remaining,9}");
}

// last six Sprints: number, planned, done, goal met, escaped defects
SprintResult[] history =
[
    new(18, 10, 9, true, 1), new(19, 11, 11, true, 0), new(20, 12, 7, false, 3),
    new(21, 12, 12, true, 0), new(22, 13, 10, false, 2), new(23, 12, 11, true, 1)
];

double goalRate = history.Count(s => s.GoalMet) / (double)history.Length;
double avgDone = history.Average(s => s.Done);
Console.WriteLine();
Console.WriteLine($"Sprints: {history.Length}, goal met: {goalRate:P0}");
Console.WriteLine($"Done per Sprint: avg {avgDone:F1}, min {history.Min(s => s.Done)}, max {history.Max(s => s.Done)}");
Console.WriteLine($"Escaped defects: {history.Sum(s => s.EscapedDefects)} total, " +
                  $"{history.Where(s => !s.GoalMet).Sum(s => s.EscapedDefects)} in missed-goal Sprints");

record DaySnapshot(int Day, int Scope, int Done)
{
    public int Remaining => Scope - Done;
}

record SprintResult(int Sprint, int Planned, int Done, bool GoalMet, int EscapedDefects);
Output:
day  scope  done  remaining
  0     12     0         12
  1     12     0         12
  2     12     1         11
  3     12     2         10
  4     15     3         12
  5     15     4         11
  6     15     5         10
  7     14     6          8
  8     14     8          6
  9     14    10          4
 10     14    11          3

Sprints: 6, goal met: 67%
Done per Sprint: avg 10.0, min 7, max 12
Escaped defects: 7 total, 5 in missed-goal Sprints
A burndown chart plots only the remaining column. On day four the remaining work is 12, the same as at the start of the Sprint. Someone looking at the burndown concludes "no progress in four days"; in fact the team finished three items and the scope grew by three items on the same day. A burnup chart draws two lines: total scope (scope) and finished work (done). Because they appear separately, the team's progress and the scope change do not hide each other.
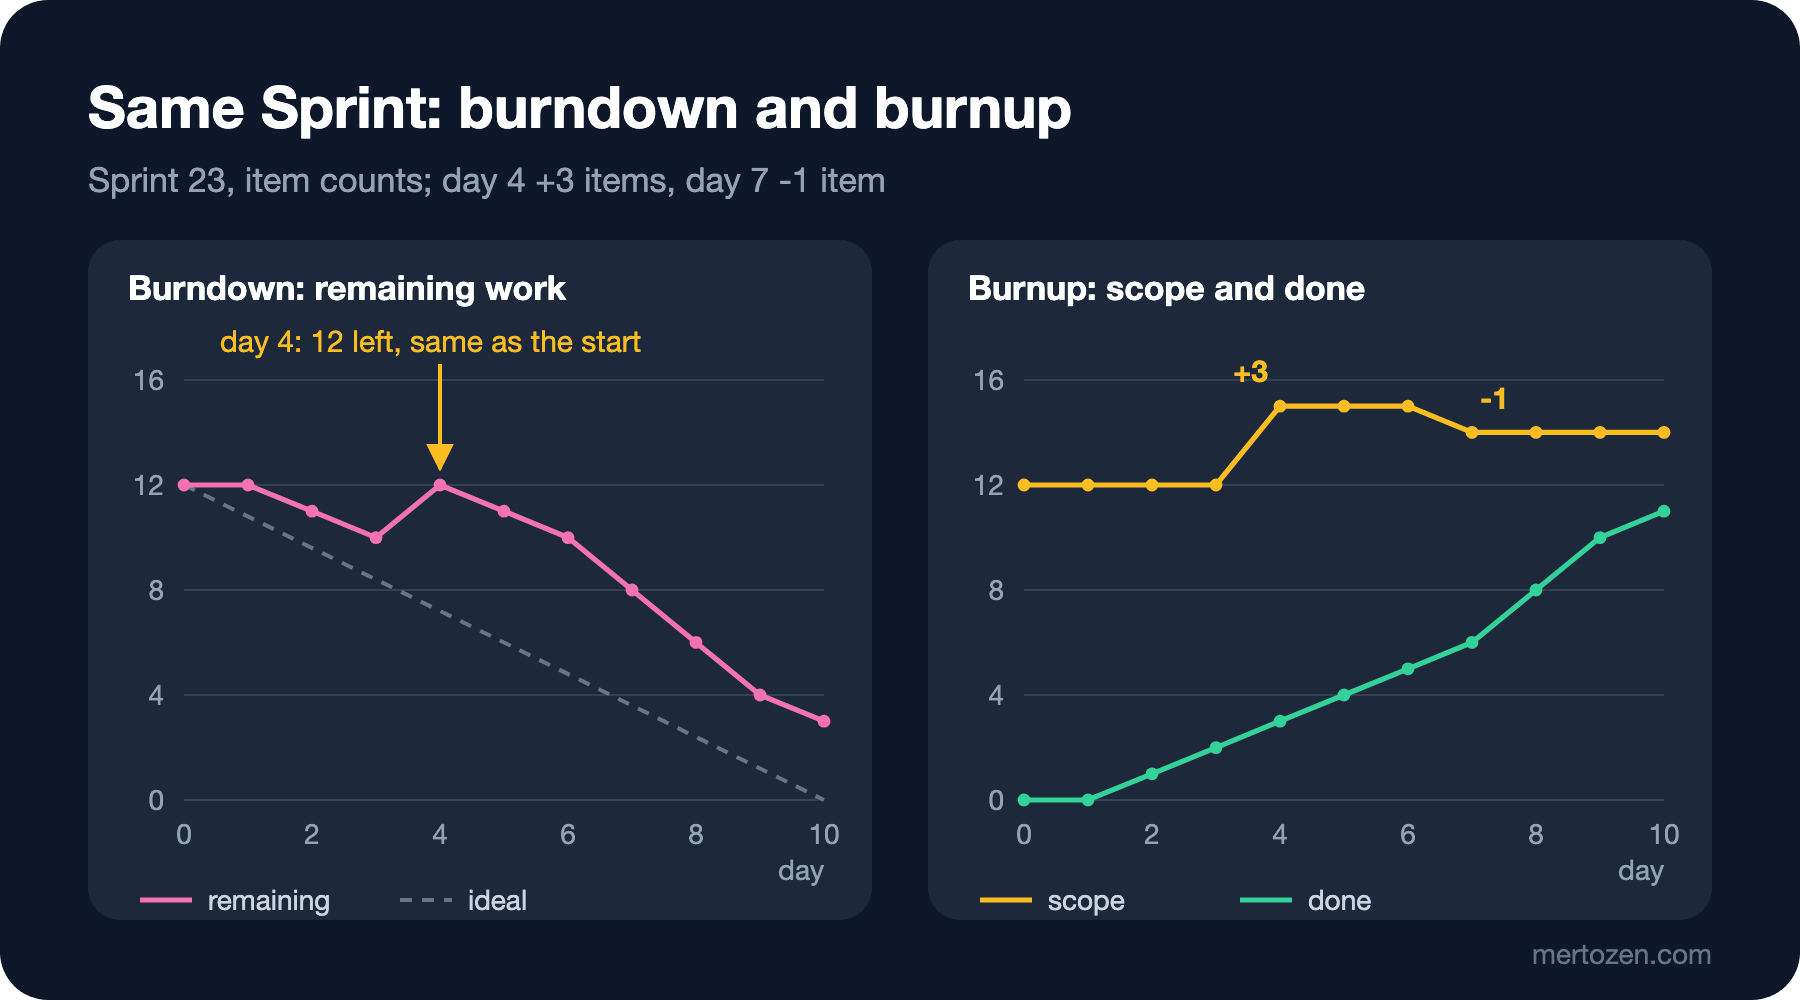
This difference is not just a visual preference; it is a matter of transparency. A scope change is a decision, and it belongs to the Product Owner; the burndown makes it look like the team being slow. At Bookstore, the sales manager who saw the burndown messaged Kerem on day four: "is the team stuck?". The burnup shows two things on the same day: the team is moving, and the target line moved up.
What Velocity Shows and What It Doesn't
Velocity is the sum of work a team got Done in a Sprint, in its own unit. Over Bookstore's last six Sprints the number averaged 10 items, with a low of 7 and a high of 12. The most honest use of this data is the team's own forecast: saying in Sprint Planning "we have finished between 7 and 12 in the past, and our capacity is a bit lower this Sprint". The range matters more than the average; a single average hides that the next Sprint could drop to 7.
The list of what velocity does not show is longer. It does not show value: all ten items may have gone into a screen nobody uses. It does not show productivity: the team can raise the number by slicing items smaller. It does not allow comparison across teams: story points and items are each team's own scale; the returns team's 34 and the payments team's 52 were two lengths measured with different rulers. The director's target "get closer to the payments team's level" was really asking the returns team to change its ruler.
Sprint Goal Success and Escaped Defects
The two numbers Bookstore trusts most are not velocity. The first is the rate of reaching the Sprint Goal: four out of six Sprints, 67 percent. It shows how reliably the team keeps its Sprint Goal commitment; it means more than the percentage of selected items finished, because according to the Guide the commitment is to the goal, not to the item list.
The second is escaped defects: bugs found in production in work counted as Done. Seven in total over six Sprints; five of them came from the two Sprints in which the Sprint Goal was missed (20 and 22). Reading this as a law from six Sprints of data would be wrong; but it is a question to take to the Retrospective: when the goal slipped, did the team cut quality in the last days? Sprint 20's timeline answered yes; in the last two days integration tests had been skipped "to be fixed later". That finding was the reason the "no skipped tests" line entered the Definition of Done in the previous post.
The two numbers should be read together. If Sprint Goal success alone becomes the target, the team shrinks its goals; if escaped defects alone become the target, bugs get relabeled as "feature requests". Looked at together, each makes the misuse of the other visible.
Outcomes, Not Output
Velocity, Sprint Goal success and escaped defects are about the team's output. How close the team is to the Product Goal is told by the product's own data. Bookstore's Product Goal was to bring support emails about returns down from 120 to under 20 a week; at the end of Sprint 23 the number was 85. That is the most important metric discussed at the Review: if 12 items get done in a Sprint and the number does not move, the team is fast but going the wrong way.
Scrum.org's Evidence-Based Management (EBM) framework draws this distinction with four areas: Current Value (the value the product delivers today), Unrealized Value (potential value not yet captured), Time-to-Market (how fast you can deliver something new) and Ability to Innovate (your capacity to create new value). EBM is not part of the official Scrum Guide; but it is a good map for looking at "what should we measure?" from output toward outcome. The product metrics themselves, North Star, HEART (Happiness, Engagement, Adoption, Retention, Task success) and AARRR (Acquisition, Activation, Retention, Referral, Revenue), are in the Introduction to Product Management series post "Product Metrics: North Star, HEART and AARRR".
Goodhart's Law
Writing about monetary policy in 1975, the British economist Charles Goodhart noted that an observed statistical regularity tends to collapse once pressure is placed on it for control purposes. In 1997 the anthropologist Marilyn Strathern generalized it into the form known today: when a measure becomes a target, it ceases to be a good measure.
Back to the opening question. When velocity becomes a target, the cheapest path is inflating points: yesterday's 3-point item becomes a 5 today. That is what happened at Bookstore a year ago: both teams' velocity rose by more than 10 percent in six months, while release frequency and the return email metric stood still. The number grew, the product stayed at the same speed; on top of that, the teams' forecasting data was damaged, because old and new points were no longer measured with the same ruler. After that experience the returns team dropped story points and moved to counting Done items; the number is still used only for the team's own planning.
| Metric | What it shows | What it doesn't show | If it becomes a target |
|---|---|---|---|
| Velocity | The team's past delivery rate in its own unit | Value, productivity, differences between teams | Point inflation, needlessly split items |
| Burndown | Work remaining in the Sprint | Scope changes, finished work | Scope is hidden, new work done outside the backlog |
| Sprint Goal success | Reliability of the commitment | How ambitious and valuable the goal is | Small, risk-free goals |
| Escaped defects | Effectiveness of the Definition of Done | Bugs not yet found | Bugs recorded under another label |
| Outcome (support emails) | Progress toward the Product Goal | Which item contributed | Apparent improvement by changing the measurement |
In Production: What to Watch
Who owns a metric determines how it gets used. Bookstore's rule: velocity and the burnup are the team's own planning tools and are not reported outside the team; the numbers reported outside are outcomes and Sprint Goal success. That way the data the team uses for its own forecasts is not corrupted into a performance target.
Trends and ranges instead of single numbers: a one-Sprint drop says nothing; a four-Sprint trend does. Even six Sprints of data is a small sample; Bookstore's escaped defect finding was a hypothesis and was confirmed with a timeline in the Retrospective. This arrangement, where the metric produces a question and the team's conversation produces the answer, fits the priority the Guide gives to empiricism.
As scale grows, the urge to compare grows. Several teams looking at a shared product metric (an outcome) is healthy; putting the same teams' velocities side by side is not.
Common Pitfalls
Comparing velocity across teams or making it a performance target. The best-known software example of Goodhart's law; the result is point inflation and broken forecasts.
Losing scope changes in the burndown. A burndown that stays flat when scope grows makes the team look unfairly slow; it also hides the scope growing quietly. The burnup separates these two pieces of information.
Measuring only output. If velocity rises while no number related to the Product Goal changes, the team may be busy but ineffective.
Putting the metric in place of the conversation. A falling number shows that a problem exists, not its cause. The cause is found by talking to people in the Retrospective, the Review or the Daily Scrum.
A Small Experiment
★☆☆ Extract the daily scope and finished-work counts for your last Sprint and draw them both as a burndown and as a burnup. Mark the days the scope changed; how do those days look on the burndown?
★★☆ Enter your last six Sprints into the program above and compute the range of Done counts. In the next Sprint Planning, try discussing the forecast with that range instead of the average.
★★★ For every metric your team reports, answer "if this number became a target, what would be the cheapest way to improve it?". Mark the metrics whose cheapest path does nothing for the product, and propose an outcome to replace them.
Metrics show that a problem exists; many of those problems sit in engineering practices. In the next post we move to the practices that make the Definition of Done possible every Sprint: short-lived branches, CI (Continuous Integration), merging unfinished work into main behind a feature flag, and making technical debt visible.