

Product Metrics: North Star, HEART and AARRR

A good product metric drives decisions: the North Star summarizes delivered value in one number, input metrics are levers teams can move weekly, guardrails catch the side effects of optimization. We build a metric tree for Bookstore, measure guest checkout with HEART and Goals-Signals-Metrics and the customer lifecycle with AARRR, and discuss leading versus lagging and vanity metrics.
Version note: This post is conceptual; the North Star follows Amplitude's "The North Star Playbook," and HEART (Happiness, Engagement, Adoption, Retention, Task success) follows the CHI (Conference on Human Factors in Computing Systems) 2010 paper by Rodden, Hutchinson and Fu at Google.
Guess First
The first slide at Bookstore's monthly management meeting is always the same: "48,000 registered users, up 6% from last month." The chart goes up and everyone is happy. In the same month, according to the funnel we will compute with SQL (Structured Query Language) in post 07, cart abandonment is 66.7% and only 37–43% of new sign-ups come back to the site the following week.
Is the 6% growth in registered users good news? Does this number tell you whether the team's work last month was good? And consider this: can this number ever go down? What does a metric that can't go down tell you?
The North Star Metric
A product team can have dozens of metrics, but for teams to pull in the same direction one of them needs to matter more than the rest. The North Star metric proposed in Amplitude's "The North Star Playbook" is the single metric that best captures the core value the product delivers to customers. The playbook asks for this metric both to reflect the value customers get and to be a leading indicator of sustainable business results; the North Star doesn't stand alone but forms a framework together with a few input metrics that move it.
Registered users can't be a North Star, because it doesn't say anyone got value: a person can sign up and never buy anything. A better candidate for Bookstore is "customers placing at least one order a month." A reader actually buying a book is the most direct evidence of the value Bookstore gives them; growth in this number also grows revenue, but unlike revenue it doesn't get inflated by a single large order.
Input Metrics and the Metric Tree
The problem with a North Star is that the team can't move it directly; "customers ordering per month" changes slowly over weeks and is affected by many factors. So input metrics that teams can move with their weekly work are placed under the North Star:
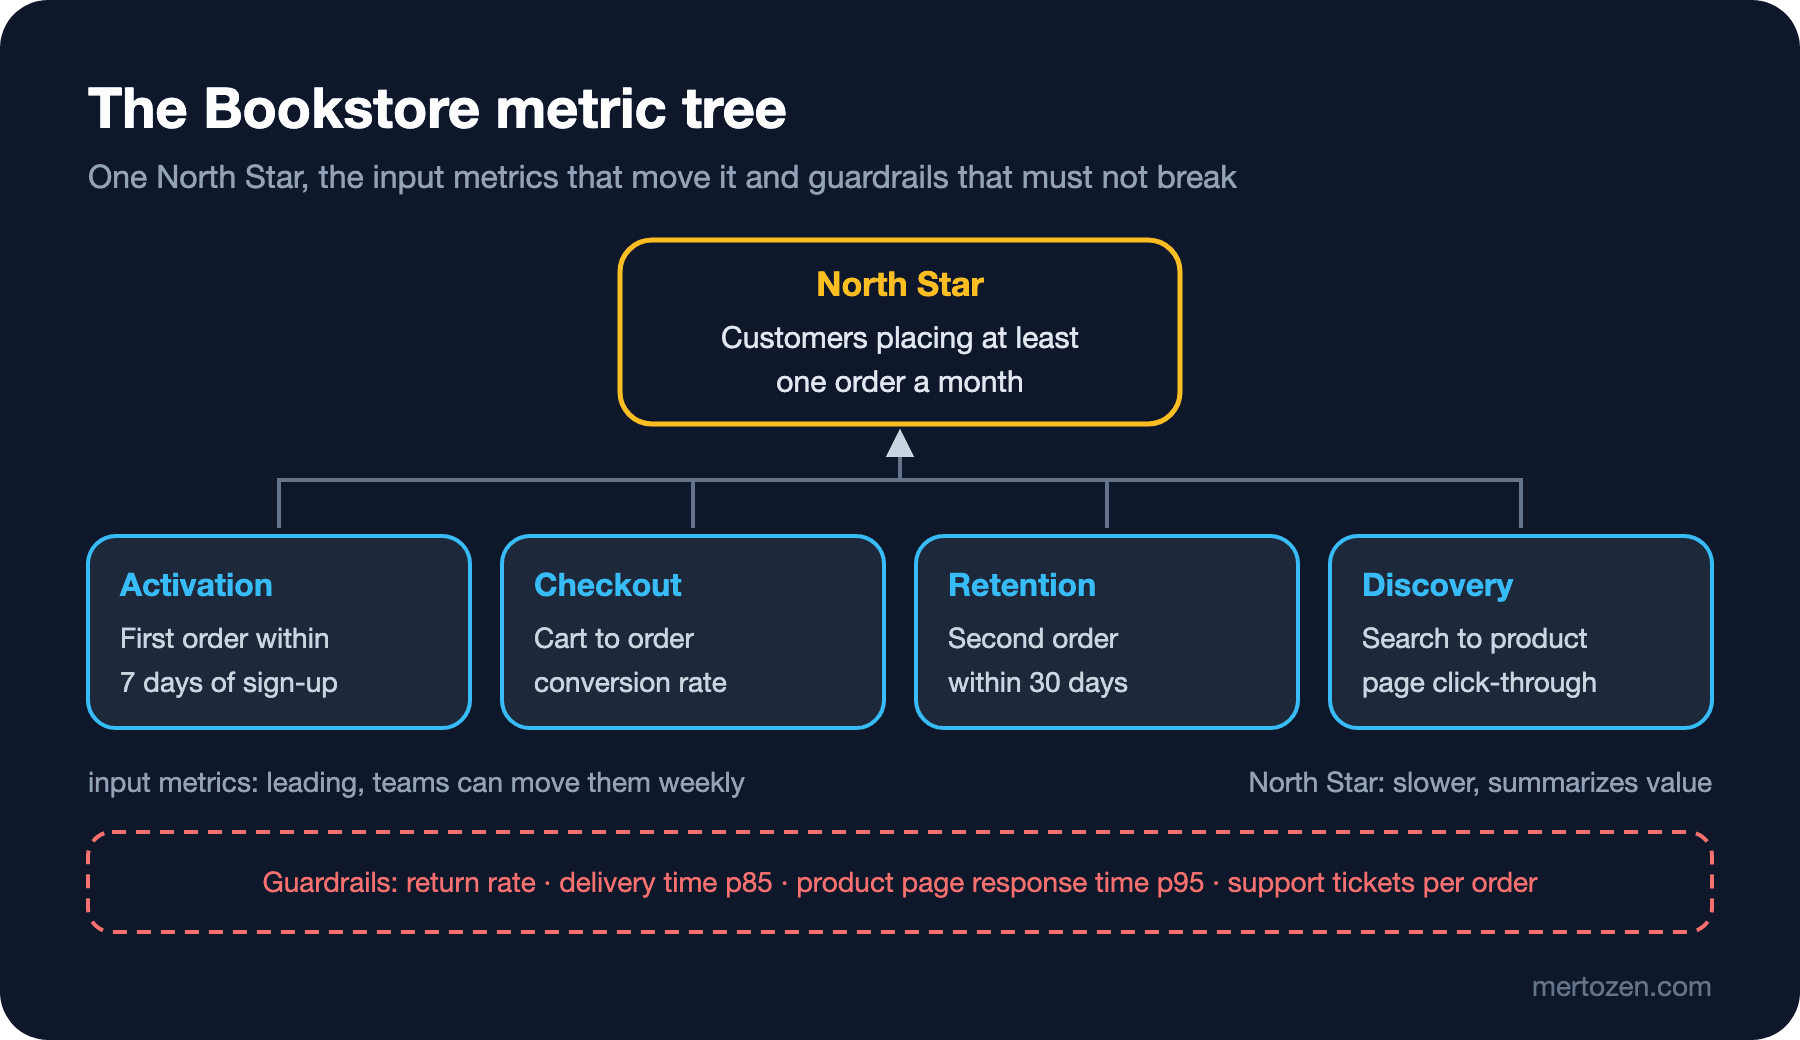
Bookstore's tree has four inputs. Activation is a newly registered customer placing their first order within seven days. Checkout is the rate at which a book added to the cart turns into an order, and it is the direct target of the cart abandonment work. Retention is a second order arriving within 30 days of the first. Discovery is the rate at which a reader who searches goes on to a product page; a reader who can't find what they're looking for can't order.
Each input can be tied to a different team or a different roadmap row. If you look at the rows of the Now-Next-Later table in the previous post, you'll see each has a place in this tree: guest cart abandonment moves Checkout, coming back for a second order moves Retention, searches with no result move Discovery. The tree connects, with numbers, why the problems on the roadmap matter.
The red band under the tree is the guardrails. We'll come back to them below.
HEART and Goals-Signals-Metrics
The North Star looks at the whole product. To measure the success of a single feature or screen, the HEART framework, published by Kerry Rodden, Hilary Hutchinson and Xin Fu of Google at the CHI conference in 2010, is a better fit. HEART has five categories: Happiness (satisfaction, perception), Engagement (intensity and frequency of use), Adoption (the share of new users or users starting to use a new feature), Retention (users coming back) and Task success (completing the task efficiently and without errors).
The paper's real contribution is less the categories than the process for using them: Goals-Signals-Metrics. First you write the goal (what should the user accomplish?), then the signal that shows whether the goal was reached (which behavior shows it?), and finally the metric that turns the signal into a number. The paper also stresses that not every project needs all five categories. For Bookstore's guest checkout feature:
| Category | Goal | Signal | Metric |
|---|---|---|---|
| Happiness | Guest checkout should feel effortless | Answer to a one-question post-purchase survey | Share of 4–5 ratings |
| Adoption | Guests can buy without creating an account | Orders placed through guest checkout | Guest orders over all guest checkouts |
| Retention | Guests come back after their first order | A second order with the same e-mail hash | Second order within 30 days |
| Task success | The payment step completes quickly and without errors | Validation errors on the payment form, step duration | Share of checkouts completed without errors, median duration |
Engagement isn't meaningful for this feature; we don't want anyone to stay longer or more often on the payment step. HEART's strength is that it forces you to think about which categories matter for this feature.
AARRR: Pirate Metrics
AARRR (Acquisition, Activation, Retention, Referral, Revenue), introduced by Dave McClure in his 2007 talk "Startup Metrics for Pirates," splits the customer lifecycle into five stages: Acquisition (how customers find us), Activation (do they have a first good experience), Retention (do they come back), Referral (do they tell others) and Revenue (do they make us money). Because the initials sound like a pirate's cry, they're also called "pirate metrics."
The Bookstore equivalents are easy to find: Acquisition, first-time visitors and their source; Activation, the first order; Retention, a second order within 30 days; Referral, new customers coming from wishlist sharing; Revenue, monthly revenue per customer. AARRR is read as a funnel and shows at which stage the biggest loss happens. At Bookstore the loss is clearly in Activation; most first-time guests never reach a first order. That also says why spending more on Acquisition (ads) isn't the right investment right now: it would be pouring more water into a leaky bucket.
HEART, AARRR and the North Star aren't rivals. The North Star summarizes the whole product in one number, AARRR shows loss across the customer lifecycle, HEART measures the user experience of a single feature. Website traffic and SEO (Search Engine Optimization) metrics are the subject not of this series but of the upcoming Analytics and Measurement series.
Leading, Lagging and Vanity Metrics
A lagging metric reports a result late but with certainty: quarterly revenue, annual customer loss. A leading metric is a faster signal that announces the result in advance: the share of customers who come back a second time within the first week is a leading indicator of retention months later. Teams work with leading metrics because they move weekly; but you need to check now and then that the leading metric really predicts the lagging one. Otherwise the team optimizes a number that predicts nothing.
A vanity metric is a number that feels good but doesn't drive decisions. The opening "registered users" is a classic example: it's cumulative, so it never goes down; it grows a little every month even if the product gets worse. Total page views and total downloads are often vanity too. There's a simple test for whether a metric is vanity: if this number changed by 20% tomorrow, what would you do? If the answer is "nothing," the number isn't helping you decide. Using rates, active users and cohorts instead of cumulative totals turns most vanity metrics into useful ones: "users who placed at least one order last week" instead of "registered users."
Guardrail Metrics
If you give a team a single metric and ask it to optimize it, the team will optimize it; sometimes in ways you didn't want. The fastest way to lower cart abandonment is to make adding to the cart harder. One way to raise checkout conversion is aggressive discounting; conversion goes up, profit goes down.
Guardrail metrics exist to prevent that: numbers that aren't optimized but must not get worse. Bookstore's tree has four guardrails: return rate (no rise in wrong or hasty orders), the 85th percentile of delivery time (fast sales shouldn't choke operations), the product page's 95th percentile response time (calculating shipping cost shouldn't slow the page) and support tickets per order (the new flow shouldn't confuse customers). If an experiment or a new feature improves the North Star while clearly worsening a guardrail, the result doesn't count as a success. We'll use this in post 08 when interpreting an experiment's result.
In Production
Every metric needs a written definition: which events it is computed from, with which time window, which users are included, how guests and registered users are separated. If "monthly active customers" produces two different numbers in the hands of two teams, the metric has no definition; there are two separate metrics. These definitions should live with the code; that's why in post 07 we'll keep the event taxonomy and SQL queries inside the code.
Mark history when you change a definition. When you add a new filter that excludes bots, active users drop overnight; if you don't put a note on the chart, three months later someone will take that drop for a product problem.
Give every metric an owner. If it's unclear who looks at a metric when it breaks (events stopped arriving, the number dropped to zero), the number on the dashboard can stay wrong for weeks. Product metrics need alerts and ownership just like technical metrics.
Common Pitfalls
The first pitfall is measuring what's measurable instead of what's important. Measuring page views is easy, measuring whether a reader found the book they were looking for is hard; the team puts the easy one on the dashboard and over time starts optimizing it. When choosing a metric, start from "what do we need to know?" not "what can we measure?"
The second is optimizing a single metric without guardrails. The observation known as Goodhart's law, in Marilyn Strathern's widely quoted wording, says that when a measure becomes a target, it ceases to be a good measure. Guardrails are the simplest tool for catching that drift.
The third is too many North Stars. A team that lists five metrics as "our North Stars" has no North Star. One North Star and a few inputs that feed it; the rest are supporting metrics used for diagnosis.
The fourth is looking at the average and missing the distribution. "Average basket value went up" may be the effect of a few very large corporate orders. As with cycle time in the Kanban series, the median, percentiles and segment breakdowns of product metrics say far more than the average.
A Small Experiment
★☆☆ Write down the first five metrics on your team's dashboard and, for each, answer "what would we do if this changed by 20% tomorrow?" Which ones turned out to be vanity?
★★☆ Propose a North Star and three input metrics for your product. Write which team's or which roadmap row's work moves each input. Add at least two guardrails.
★★★ Fill in a HEART table for the last feature your team delivered: which categories are meaningful, and for each a goal, a signal and a metric. How many of these metrics can you compute with today's data? For the ones you can't, which event is missing?
We've defined the metrics; now it's time to measure them in code. In the next post we'll build an event taxonomy, write an Angular service that sends events and an event table in ASP.NET Core with a Minimal API (Application Programming Interface) and EF (Entity Framework) Core, and compute a weekly retention cohort and an activation funnel from real data with SQL.