

Measuring and Speeding Up a Pipeline: DORA Metrics, Caching and Parallelism
DORA's current five metrics (change lead time, deployment frequency, failed deployment recovery time, change fail rate, deployment rework rate) are calculated from deploy records and should be tracked as team-level trends; speeding up a pipeline starts with measuring. A single-file C# calculator, a real act measurement where a NuGet cache saved only 0.2 seconds of restore at a 2.3-second restore cost, cache key design, and the path filter trap.
Version note: The examples in this post were run with .NET 10 (SDK 10.0.402), Node.js 24, act 0.2.97, actionlint 1.7.12 and Docker 29.
Guess First
You add a cache for NuGet packages to Bookstore's pipeline; the key is derived from the hash of the lock files. On the first run the cache is empty, on the second it is full. How much faster does dotnet restore get on the second run: half the time, a tenth, or hardly any change? How many seconds does restoring the cache itself take? Write down your guess; the real numbers I measured with act are in the middle section.
DORA's Five Metrics
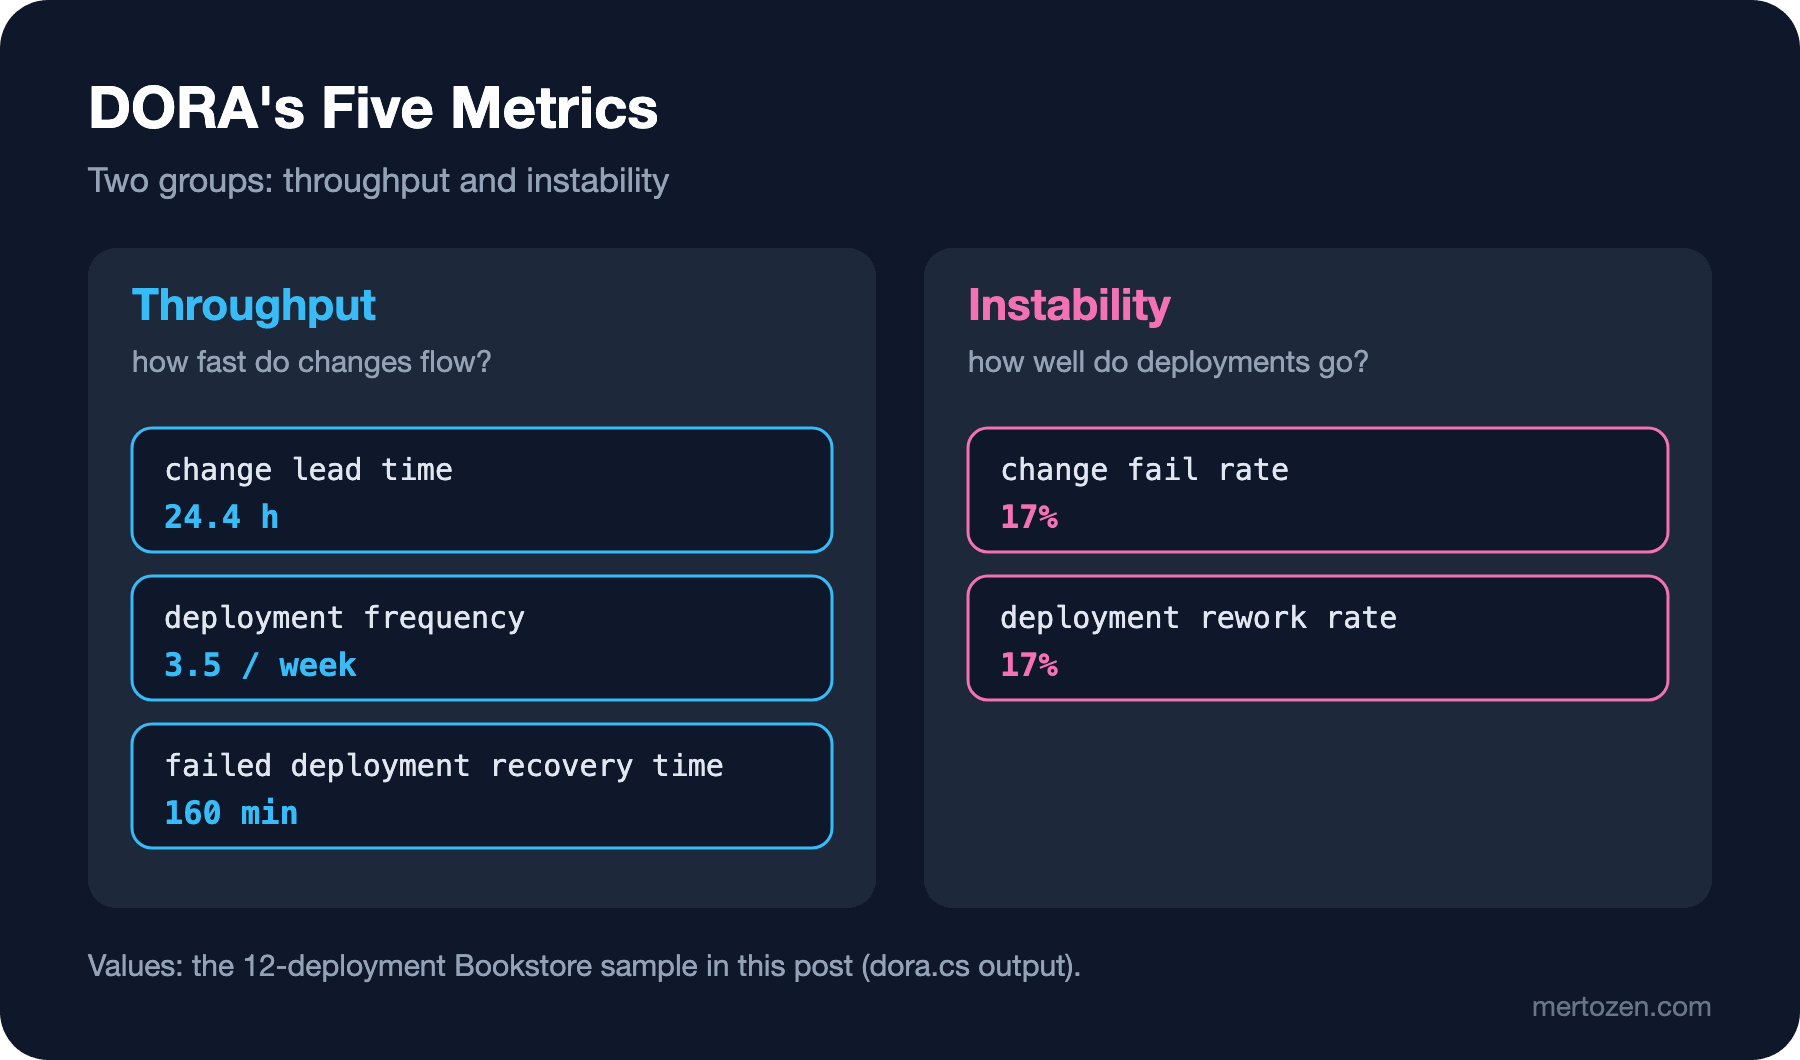
DORA (DevOps Research and Assessment) measures software delivery performance with five metrics. According to dora.dev's guide, updated in January 2026, they fall into two groups. Throughput measures how fast changes flow through the system: change lead time (from a change being committed to version control to it being deployed to production), deployment frequency (how many deployments happen in a period) and failed deployment recovery time (how long it takes to recover from a failed deployment that needs immediate intervention). Instability measures how well deployments go: change fail rate (the share of deployments that need urgent follow-up such as a revert or an emergency patch) and deployment rework rate (the share of deployments that are unplanned and caused by a production incident).
The model has changed over time. The 2014 research started with four variables, and the 2015 report settled on the four-metric throughput and stability model. The old MTTR (Mean Time To Recovery) metric was renamed failed deployment recovery time in the 2023 report; the definition is now about failures caused by deployments rather than "any failure" in general. Deployment rework rate was added with the 2024 report, and the model grew to five metrics. If you see "four key metrics" or MTTR in an older presentation, that is where it comes from.
Calculating the Metrics from Deploy Records
The raw material for the metrics is deploy records. I put 12 production deploys from Bookstore's last four weeks into a CSV (Comma-Separated Values) file. Each row holds the time of the first commit in the deploy, the deploy time, whether the deploy was planned or caused by an incident, whether it failed and, if so, when service was restored:
id,first_commit_at,deployed_at,trigger,failed,restored_at
101,2026-10-05T09:10,2026-10-06T11:00,planned,no,
102,2026-10-06T14:00,2026-10-07T10:30,planned,no,
103,2026-10-08T10:00,2026-10-09T16:00,planned,yes,2026-10-09T17:20
104,2026-10-09T16:40,2026-10-09T17:20,incident,no,
105,2026-10-12T09:00,2026-10-13T11:00,planned,no,
106,2026-10-13T13:30,2026-10-14T15:00,planned,no,
107,2026-10-15T10:00,2026-10-16T10:00,planned,no,
108,2026-10-19T11:00,2026-10-20T09:45,planned,yes,2026-10-20T13:45
109,2026-10-20T12:10,2026-10-20T13:45,incident,no,
110,2026-10-21T10:00,2026-10-22T14:00,planned,no,
111,2026-10-26T09:30,2026-10-27T10:15,planned,no,
112,2026-10-28T15:00,2026-10-29T11:30,planned,no,
103 and 108 are failed deploys; 104 and 109 are the incident-driven hotfix deploys that fixed them. I did the calculation in a single C# file using .NET 10's file-based apps feature; no project file needed, dotnet run dora.cs is enough:
// usage: dotnet run dora.cs -- deployments.csv
using System.Globalization;

string[] lines = File.ReadAllLines(args[0]);
List<Deployment> deployments = lines.Skip(1).Select(Deployment.Parse).ToList();

double days = (deployments.Max(d => d.DeployedAt) - deployments.Min(d => d.DeployedAt)).TotalDays + 1;
TimeSpan medianLeadTime = Median(deployments.Select(d => d.DeployedAt - d.FirstCommitAt));
List<Deployment> failed = deployments.Where(d => d.Failed).ToList();
TimeSpan medianRecovery = Median(failed.Select(d => d.RestoredAt!.Value - d.DeployedAt));
int incidentDriven = deployments.Count(d => d.Trigger == "incident");

Console.WriteLine($"deployments           : {deployments.Count} in {days:0} days");
Console.WriteLine($"deployment frequency  : {deployments.Count / days * 7:0.0} per week");
Console.WriteLine($"change lead time      : {medianLeadTime.TotalHours:0.0} h (median)");
Console.WriteLine($"change fail rate      : {(double)failed.Count / deployments.Count:P0}");
Console.WriteLine($"recovery time         : {medianRecovery.TotalMinutes:0} min (median)");
Console.WriteLine($"deployment rework rate: {(double)incidentDriven / deployments.Count:P0}");

static TimeSpan Median(IEnumerable<TimeSpan> values)
{
    TimeSpan[] sorted = values.Order().ToArray();
    int mid = sorted.Length / 2;
    return sorted.Length % 2 == 1 ? sorted[mid] : (sorted[mid - 1] + sorted[mid]) / 2;
}

record Deployment(int Id, DateTime FirstCommitAt, DateTime DeployedAt, string Trigger, bool Failed, DateTime? RestoredAt)
{
    public static Deployment Parse(string line)
    {
        string[] f = line.Split(',');
        return new(int.Parse(f[0]), Time(f[1]), Time(f[2]), f[3], f[4] == "yes",
            f[5].Length > 0 ? Time(f[5]) : null);
    }

    private static DateTime Time(string value) =>
        DateTime.ParseExact(value, "yyyy-MM-ddTHH:mm", CultureInfo.InvariantCulture);
}
$ dotnet run dora.cs -- deployments.csv
deployments : 12 in 24 days
deployment frequency : 3.5 per week
change lead time : 24.4 h (median)
change fail rate : 17%
recovery time : 160 min (median)
deployment rework rate: 17%There are a few design decisions here. For durations I used the median rather than the mean: a single forgotten PR (pull request) with a three-week lead time blows up the mean but barely moves the median. I took the first commit in the deploy as the start of lead time; taking the last commit would make it look shorter than it is. In this sample change fail rate and rework rate came out the same, because every failed deploy was fixed with a hotfix. In reality the two can diverge: a deploy that is undone with a revert counts towards fail rate but may not need a new deploy; conversely, a production incident may come from something unrelated to a deploy and still require an urgent one.
The source of this data should be the pipeline itself: GitHub's deployment records, Jenkins build history, Azure DevOps environment history. To answer "was this deploy caused by an incident?" automatically, you need a marker, such as a PR label (hotfix) or linking the record in your incident management tool to the deploy. A table kept by hand is correct in the first week and incomplete by the third month.
Measure Before Speeding Up
When the pipeline is slow, the first reflex is to add a cache. First I looked at how much there was to gain locally: restore times for NuGet and npm with an empty package folder (cold) and a full one (warm):
cold nuget restore: 3.1 s
warm nuget restore: 0.6 s
cold npm ci: 6.3 s
warm npm ci: 3.0 s
Locally the picture is clear: NuGet gets five times faster, npm twice as fast. Then I measured the same thing in act, with a real cache step. The workflow:
name: cache

on:
  push:
    branches: [main]

jobs:
  api:
    runs-on: ubuntu-latest
    env:
      NUGET_PACKAGES: ${{ github.workspace }}/.nuget/packages
    steps:
      - uses: actions/checkout@v7
      - uses: actions/setup-dotnet@v6
        with:
          global-json-file: global.json
      - uses: actions/cache@v6
        with:
          path: ${{ env.NUGET_PACKAGES }}
          key: nuget-${{ runner.os }}-${{ hashFiles('**/packages.lock.json') }}
          restore-keys: |
            nuget-${{ runner.os }}-
      - run: dotnet restore --locked-mode
The first run (empty cache) and the second run (full cache):
== run 1
[cache/api]   | Cache not found for input keys: nuget-Linux-44e642d144dc04b17fdc02508da3f79f055a90d012f32b89b5038b3ebeb611dd, nuget-Linux-
[cache/api]   ✅  Success - Main actions/cache@v6 [1.006575458s]
[cache/api]   ✅  Success - Main dotnet restore --locked-mode [4.740434375s]
[cache/api]   | Cache saved with key: nuget-Linux-44e642d144dc04b17fdc02508da3f79f055a90d012f32b89b5038b3ebeb611dd
[cache/api]   ✅  Success - Post actions/cache@v6 [3.165430209s]
== run 2
[cache/api]   | Cache Size: ~97 MB (102144202 B)
[cache/api]   | Cache restored successfully
[cache/api]   ✅  Success - Main actions/cache@v6 [2.288465333s]
[cache/api]   ✅  Success - Main dotnet restore --locked-mode [4.551417333s]
[cache/api]   ✅  Success - Post actions/cache@v6 [198.937125ms]
The answer to the opening question: restore went from 4.74 seconds to 4.55 seconds, so we gained 0.2 seconds. In exchange, restoring the 97 MB cache took 2.3 seconds, and saving it on the first run took 3.2 seconds. In this environment the cache is a net loss. The reason: downloading the packages from nuget.org was already cheap on a fast network, and the rest of the restore time is not downloading but MSBuild evaluating the projects. The 97 MB size is notable too: the whole package tree, including Testcontainers and the test dependencies, is in there.
That does not mean caches are useless. On a slow or metered network, with a large dependency tree, or with a package source that slows down now and then, the picture can flip. The lesson: add a cache based on measurement, not assumption, and measure on your own runners; my numbers were taken locally with act and not run on GitHub's runners.
Designing the Cache Key
The key has two jobs: change when the content changes and stay the same when it does not. The key above has three parts. The nuget prefix says what the cache is. runner.os stops a cache produced on Linux from being restored on a Windows runner. hashFiles('**/packages.lock.json') produces a new key as soon as dependencies change. The lock file is a better input here than the csproj: a comment change in a csproj does not throw the cache away, while a version change in a transitive package does.
restore-keys is a fallback: if there is no exact match, the newest cache starting with the same prefix is restored and restore only downloads the missing packages. When most dependencies stay the same, that beats a completely empty cache.
There are ready-made shortcuts too: the cache: npm option of actions/setup-node and the cache: true option of actions/setup-dotnet derive the key from lock files with the same logic. On the npm side, the thing to cache is not node_modules but npm's own cache folder: npm ci deletes any existing node_modules before it starts.
Affected-Only Builds and Path Filters
Bookstore's API (Application Programming Interface) and web app live in the same repository. Running the API's build and tests when only a CSS (Cascading Style Sheets) change was made on the Angular side wastes minutes. In GitHub Actions the simplest solution is a path filter:
name: web

on:
  push:
    branches: [main]
    paths:
      - 'web/**'
      - '.github/workflows/web.yml'
  pull_request:
    paths:
      - 'web/**'

jobs:
  build:
    runs-on: ubuntu-latest
    steps:
      - run: echo "web changed, building bookstore-web"
It is important to add the workflow file itself to the list; otherwise the commit that changes the workflow does not trigger it, and the change goes untested. The commit that added this file ran the workflow in act. I could not confirm how act evaluates the path filter with a commit that only touches the API; that act run hung without producing a result. I verified this behaviour with actionlint and GitHub's documentation, not by running it on GitHub.
Path filters have a known trap: according to GitHub's documentation, the checks of a workflow skipped because of a path filter stay in a "Pending" state, and if that check is required the PR cannot be merged. Do not tie required checks to path-filtered workflows; either do the filtering with a job-level condition (a job skipped because of a condition reports "Success") or write a small first job that finds the changed paths and run the other jobs based on its output. In a monorepo with many projects, build tools that do "affected" analysis (such as Nx or Bazel) do this through the dependency graph.
Parallelism, Artifact Size and Runner Cost
In the second post we saw that when api and web ran in parallel they added about 10 seconds to the pipeline, where running them one after the other would have added 18. Parallelism has a price too: each job starts on its own machine, so each job redoes the checkout and the SDK installation. In Bookstore the setup-dotnet step alone took 15 seconds. Splitting a job in two means paying those 15 seconds a second time. Splitting work pays off only when the work being split is clearly longer than that fixed cost.
Artifact size shows up in the time as well: every upload and download goes over the network. Bookstore's API artifact also contains .pdb files; whether the package that goes to production needs them is a decision that depends on your debugging strategy. Shortening retention (retention-days) lowers storage cost.
Finally, runner cost. For private repositories, GitHub-hosted runners are billed per minute; larger runners cost more per minute but may finish the work sooner. Which combination is cheap is again found by measuring: total time multiplied by the per-minute price, and the time developers spend waiting.
In Production: Gaming the Metrics
The observation known as Goodhart's law comes from a 1975 remark by the economist Charles Goodhart and is usually summarised like this: when a measure becomes a target, it ceases to be a good measure. It is not hard to predict how this plays out with DORA metrics. If deployment frequency becomes a target, teams split changes into meaningless pieces. If change fail rate becomes a target, failed deploys stop being marked as "failed". If lead time becomes a target, people start measuring from the last commit instead of the first.
My suggestion is three rules. Keep the metrics at team level, not individual level; delivery is a team sport. Look at trends, not absolute values: where Bookstore's lead time went this quarter compared to last quarter means more than another team's number. And look at all five metrics together: if throughput rises while instability rises too, speed is being stolen from safety.
Common Pitfalls
Optimising without measuring: as in the cache example above, an optimisation added on intuition can make the pipeline slower.
The wrong key: a key that is too broad (just nuget-Linux) carries old packages forever; a key that is too narrow, such as the commit's SHA (Secure Hash Algorithm), misses on every run and leaves only the cost of saving.
Caching node_modules: npm ci deletes it anyway; what should be cached is npm's cache folder.
Tying a required check to a path-filtered workflow: on an unrelated change the PR gets stuck on a "Pending" check.
Collecting metrics by hand: the data arrives incomplete and late, and nobody trusts it. The source should be the pipeline's own records.
A Small Experiment
★☆☆ Put last month's production deploys into a CSV and run dora.cs with your own data. For which metric did you lack the data?
★★☆ Add a cache step to your pipeline and compare cached and uncached times with at least three runs each. Is the time it takes to restore the cache less than the time it saves?
★★★ Tie a required check in your repository to a path-filtered workflow, then open a PR that changes an unrelated file. What happened to the PR's status? Fix the problem with a job-level condition.
This post ends our series on CI (Continuous Integration) and CD (Continuous Delivery), CI/CD Fundamentals. We have pulled together, independently of any tool, the answer to why we build pipelines the way we do: frequent integration, an artifact built once, tests ordered from cheap to expensive, environments that differ only in configuration, approvals in the right place, short-lived credentials, and getting faster by measuring. Applying the same ideas in a tool's own language is the subject of the upcoming GitHub Actions, Jenkins and Azure DevOps Pipelines series; separating deploy from release belongs to the Deployment Strategies series.