

Pipeline Anatomy: Triggers, Stages, Jobs, Steps and Failing Fast
A pipeline starts with triggers and is made of dependent jobs (stages in Jenkins) and steps that run in order; putting the build logic in a script that runs locally, letting the pipeline only orchestrate, moving cheap checks first and failing fast across parallel branches all speed up feedback. A GitHub Actions, Jenkins and Azure DevOps term mapping, with real output from act and Jenkins.
Version note: The examples in this post were run with .NET 10 (SDK 10.0.402), Angular 22.2, Node.js 24, act 0.2.97, Jenkins 2.580.2 LTS (Long-Term Support) and Docker 29.
Guess First
Bookstore's pipeline runs two pieces of work in parallel: api for the API (Application Programming Interface) and web for the Angular side. Someone commits a C# file with two extra spaces in it. In Jenkins, the parallelsAlwaysFailFast() option is on at the top of the pipeline. When api fails the formatting check, what does web do: run to the end and finish green, or get cut off halfway? And does the Publish stage that follows both of them run? You will see the answer in the real Jenkins output in the middle of the post.
The Parts of a Pipeline: Trigger, Stage, Job, Step
Every CI (Continuous Integration) and CD (Continuous Delivery) tool uses its own vocabulary, but the underlying structure is the same. A trigger starts the pipeline. The pipeline is made of units of work that depend on each other; each unit runs on a machine (a runner or agent) and consists of steps that run in order. A step is a shell command or a call to a ready-made action or plugin. Some tools add one more logical grouping above the units of work.
What confuses people most when switching tools is that the same word describes different layers. A mapping table:
| Concept | GitHub Actions | Jenkins (declarative) | Azure DevOps |
|---|---|---|---|
| Definition file | .github/workflows/*.yml | Jenkinsfile | azure-pipelines.yml |
| The whole flow | workflow | pipeline | pipeline |
| Logical group | none (jobs and needs) | stage | stage |
| Unit that runs on one machine | job | agent inside a stage | job |
| Single step | step (run or uses) | step (sh, echo…) | step (script or task) |
In this post I will use GitHub Actions and Jenkins snippets side by side to explain the concepts. Tool-specific details (matrices, reusable workflows, shared libraries) belong to the upcoming GitHub Actions, Jenkins and Azure DevOps Pipelines series.
Trigger Types
Bookstore's pipeline starts on five different events:
on:
  push:
    branches: [main]
    tags: ['v*']
  pull_request:
  schedule:
    - cron: '0 3 * * 1'
  workflow_dispatch:
push verifies every change that lands on trunk; this is the heart of CI. The tags filter starts the release flow when a tag like v1.4.0 is pushed. pull_request tests a change before it is merged; for this event GitHub builds a temporary merge commit that combines the PR (pull request) branch with the target branch, so what you test is "what happens if this gets merged". schedule runs every Monday at 03:00 (UTC, Coordinated Universal Time); even if nobody touches the code, it catches changes from outside, such as a newly published package version or an expired certificate. workflow_dispatch is a manual trigger.
In Jenkins the same idea is expressed with a triggers block: cron('H 3 * * 1'). The H derives the minute from a hash of the job name; when a hundred jobs are all scheduled for 03:00, it keeps them from starting in the same second. Push and PR triggers are usually set up in Jenkins with webhooks and a multibranch pipeline.
Script First, Pipeline Second
It is tempting to write dozens of run: lines straight into the pipeline definition, but after a while that causes two problems: you cannot run the same steps locally, and when you want to switch tools you rewrite everything. The sturdier approach is to put the build logic in a script in the repository and let the pipeline only conduct the orchestra. Bookstore's build.sh:
#!/usr/bin/env bash
# Usage: ./build.sh [api|web|all]
set -euo pipefail

api() {
    dotnet restore --locked-mode
    dotnet format --verify-no-changes --no-restore
    dotnet build --no-restore -c Release
    dotnet test --no-build -c Release
    dotnet publish src/Bookstore.Api --no-build -c Release -o artifacts/api
}

web() {
    (
        cd web/bookstore-web
        npm ci
        npx ng test --watch=false
        npx ng build
    )
}

case "${1:-all}" in
    api) api ;;
    web) web ;;
    all) api; web ;;
    *) echo "unknown target: $1" >&2; exit 2 ;;
esac
set -euo pipefail guarantees three things: the script stops when a command fails, using an undefined variable is an error, and a failure inside a pipe is not hidden. Without this line, the script would carry on to publish even if dotnet test failed, and the pipeline would look green.
Note the order too: restore → format check → build → test → publish. Each step uses the output of the previous one; --no-restore and --no-build stop the same work from being done twice. --locked-mode does not allow any version outside packages.lock.json; we will open that up in the next post.
When I ran the same script locally, ./build.sh api finished in about 5 seconds. When the pipeline breaks, the first thing you should do is try the same command on your own machine; the script makes that possible.
Parallel Jobs and the DAG
The API and the web app are independent of each other; there is no point in queuing one behind the other. Packaging, however, needs both to be green. These dependencies form a DAG (Directed Acyclic Graph):
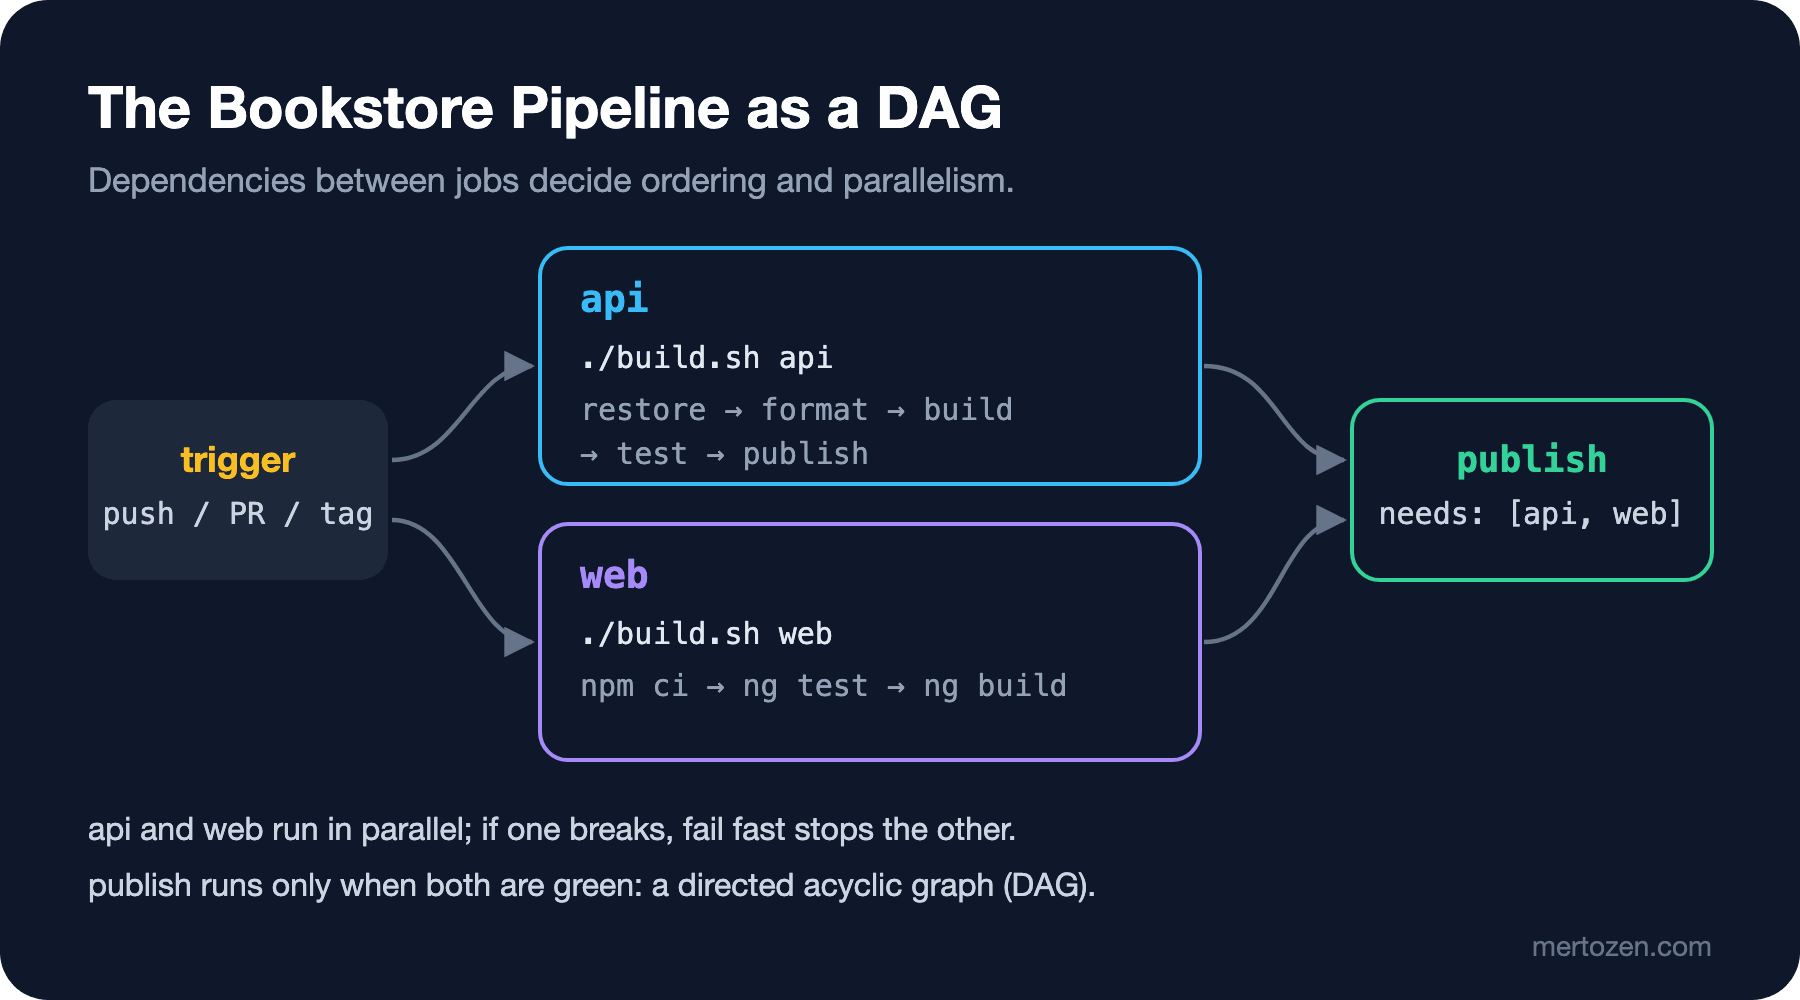
In GitHub Actions, jobs run in parallel by default; needs decides the order:
jobs:
  api:
    runs-on: ubuntu-latest
    timeout-minutes: 15
    steps:
      - uses: actions/checkout@v7
      - uses: actions/setup-dotnet@v6
        with:
          global-json-file: global.json
      - run: ./build.sh api
      - uses: actions/upload-artifact@v5
        with:
          name: api
          path: artifacts/api

  web:
    runs-on: ubuntu-latest
    timeout-minutes: 15
    steps:
      - uses: actions/checkout@v7
      - uses: actions/setup-node@v7
        with:
          node-version: 24
      - run: ./build.sh web
      - uses: actions/upload-artifact@v5
        with:
          name: web
          path: web/bookstore-web/dist/bookstore-web/browser

  publish:
    needs: [api, web]
    runs-on: ubuntu-latest
    steps:
      - uses: actions/download-artifact@v5
      - run: ls api web
Each job starts on a separate, clean machine, so the files that api produced do not show up in publish by themselves. The way to move files between jobs is to upload and download artifacts. I picked v5 of the artifact actions on purpose: act 0.2.97's local artifact server did not work with v6 and v7, but it worked with v5. On GitHub's own runners you can use the current versions.
A summary of the pipeline run with act:
[pipeline/web]   ✅  Success - Main ./build.sh web [7.594339042s]
[pipeline/api]   | Passed!  - Failed:     0, Passed:     6, Skipped:     0, Total:     6, Duration: 158 ms - Bookstore.Api.Tests.dll (net10.0)
[pipeline/api]   ✅  Success - Main ./build.sh api [10.411911584s]
[pipeline/publish]   | Found 2 artifact(s)
[pipeline/publish]   | Total of 2 artifact(s) downloaded
[pipeline/publish]   | api:
[pipeline/publish]   | Bookstore.Api
[pipeline/publish]   | Bookstore.Api.deps.json
[pipeline/publish]   | Bookstore.Api.dll
[pipeline/publish]   | Bookstore.Api.pdb
[pipeline/publish]   | Bookstore.Api.runtimeconfig.json
[pipeline/publish]   | Bookstore.Api.staticwebassets.endpoints.json
[pipeline/publish]   | appsettings.Development.json
[pipeline/publish]   | appsettings.json
[pipeline/publish]   | web.config
[pipeline/publish]   |
[pipeline/publish]   | web:
[pipeline/publish]   | config.json
[pipeline/publish]   | favicon.ico
[pipeline/publish]   | index.html
[pipeline/publish]   | main-S3Z6CNMD.js
[pipeline/publish]   | styles-5INURTSO.css
[pipeline/publish] 🏁  Job succeeded
web finished in 7.6 seconds and api in 10.4 seconds; because they ran at the same time they added about 10 seconds to the total, where running them one after the other would have added 18. With two jobs the difference is small, but as the number of jobs grows, parallelism brings the pipeline time down to the duration of the longest branch.
The Same Pipeline in Jenkins
Thanks to the script, the Jenkinsfile stays short as well:
pipeline {
    agent any
    options {
        timeout(time: 15, unit: 'MINUTES')
        parallelsAlwaysFailFast()
    }
    triggers {
        cron('H 3 * * 1')
    }
    stages {
        stage('Build and test') {
            parallel {
                stage('api') {
                    steps {
                        sh './build.sh api'
                    }
                }
                stage('web') {
                    steps {
                        sh './build.sh web'
                    }
                }
            }
        }
        stage('Publish') {
            steps {
                archiveArtifacts artifacts: 'artifacts/api/**, web/bookstore-web/dist/bookstore-web/browser/**'
            }
        }
    }
}
I ran this in a local Jenkins container that pulls the repository over Git. The skeleton in the console is the same DAG as in GitHub Actions:
[Pipeline] { (Build and test)
[Pipeline] parallel
[Pipeline] { (Branch: api)
[Pipeline] { (Branch: web)
+ ./build.sh api
+ ./build.sh web
Passed!  - Failed:     0, Passed:     6, Skipped:     0, Total:     6, Duration: 94 ms - Bookstore.Api.Tests.dll (net10.0)
[Pipeline] { (Publish)
[Pipeline] archiveArtifacts
Archiving artifacts
[Pipeline] End of Pipeline
Finished: SUCCESS
Notice the difference: in GitHub Actions api and web ran on two separate machines, while in Jenkins they ran in the same workspace on the same agent. Parallel branches that write to the same folder can overwrite each other's files; here api writes to artifacts/ and web under web/, so there is no problem, but in a shared workspace this is always something to check.
Fail Fast: Move Cheap Checks to the Front
Fail fast has two meanings. The first is ordering: the cheaper a check, the earlier it should run. In build.sh the formatting check comes before the build. On a bad commit the local output is:
$ ./build.sh api
  Determining projects to restore...
  All projects are up-to-date for restore.
src/Bookstore.Api/Catalog/BookCatalog.cs(14,31): error WHITESPACE: Fix whitespace formatting. Delete 2 characters. [src/Bookstore.Api/Bookstore.Api.csproj]
src/Bookstore.Api/Catalog/BookCatalog.cs(14,36): error WHITESPACE: Fix whitespace formatting. Delete 2 characters. [src/Bookstore.Api/Bookstore.Api.csproj]
$ echo $?
2
The error arrived in 3 seconds; build and test never started. If the check had come after the tests, you would have received the same information at the end of a full build and test round.
The second meaning is about parallel branches: if one branch has failed, is there any point in waiting for the others? When the same broken commit ran in Jenkins:
[Pipeline] parallel
[Pipeline] { (Branch: api)
[Pipeline] { (Branch: web)
+ ./build.sh api
+ ./build.sh web
/var/jenkins_home/workspace/bookstore/src/Bookstore.Api/Catalog/BookCatalog.cs(14,31): error WHITESPACE: Fix whitespace formatting. Delete 2 characters. [/var/jenkins_home/workspace/bookstore/src/Bookstore.Api/Bookstore.Api.csproj]
added 291 packages, and audited 292 packages in 3s
❯ Building...
Failed in branch api
Sending interrupt signal to process
✖ Building... [FAILED: The service was stopped]
Terminated
Failed in branch web
[Pipeline] { (Publish)
Stage "Publish" skipped due to earlier failure(s)
ERROR: script returned exit code 2
Finished: FAILURE
Here is the answer to the opening question: as soon as api failed, Jenkins sent an interrupt signal to web and the Angular build was cut off halfway; Publish was skipped. The agent did not work for nothing and the result came earlier. The price: if web had an error too, you would not see it in this round. Fail fast is a trade-off between "show the first error quickly" and "show all errors in one round".
In GitHub Actions, independent jobs do not stop each other by default; if one fails, the other runs to the end, and only the jobs that depend on it through needs are skipped. The same idea is controlled for matrix jobs with the strategy.fail-fast setting.
Pipeline as Code
Both the workflow file and the Jenkinsfile live in the repository, and every change to them goes through a PR. That buys you three things: pipeline changes go through the same review as the code, their history shows up in git log, and when you check out a commit you also have the way that commit was built. Pipelines set up by clicking in a tool's web interface have none of this; often nobody knows who changed what and when.
Because pipeline files define code that can reach production, it makes sense to give them a stricter review rule than ordinary code. With the CODEOWNERS file I described in the Git & GitHub series post "Teamwork with Git: Branching Strategies, Rulesets and Conventional Commits", you can require the platform team's approval for .github/workflows/ and the Jenkinsfile. We will look at pipeline security separately in the seventh post.
In Production
Give every job a time limit. In GitHub Actions the default job timeout is 360 minutes; a hung test keeps a runner busy for six hours and shows up on the bill. In Bookstore I used timeout-minutes: 15, and timeout(time: 15, unit: 'MINUTES') in Jenkins. Pick the value based on the normal duration: if the work usually takes 2 minutes, 15 minutes is a comfortable upper bound.
When you measure pipeline time, do not settle for the total; look at the steps. In the act run, the real work of the api job, ./build.sh api, took 10.4 seconds, while the setup-dotnet step before it took 15.1 seconds. More than half the job was installing the SDK. When you want to make the pipeline faster, the first task is to see where the time goes; we will measure caching and parallelism in the last post.
Finally, watch the logs. The output of parallel branches is interleaved in the Jenkins console; in the fail fast output above, npm lines and dotnet format lines arrived mixed together. To read one branch on its own, use the tool's branch view (stage view in Jenkins, the job page in GitHub).
Common Pitfalls
"Magic" steps that cannot be run locally: an environment variable defined only in the pipeline, a tool pre-installed on the runner, or a 40-line shell block embedded in the YAML (YAML Ain't Markup Language). When the pipeline breaks you cannot reproduce these locally, and debugging turns into a "commit, wait, read the log" loop.
Putting everything into one giant job: when restore, build, unit tests, integration tests, e2e (end-to-end) tests and packaging all run in order in a single job, you give up parallelism and you have to dig through one long log to find which stage broke.
Splitting the logic in two: one version of a step in the script and a slightly different version in the YAML. Most "green locally, red in the pipeline" builds come from this. The script should be the single source of truth.
Forgetting set -e: the script carries on after a failing command and the pipeline finishes green. That is much worse than a false alarm; it shows a broken build as successful.
A Small Experiment
★☆☆ Write down the duration of every job in your project's pipeline. Which branch is the longest, and what percentage of the total does it take?
★★☆ Write a build.sh (or build.ps1) for your project and move the pipeline's run: steps into it. Then run the script locally on a clean clone; did anything turn up that the pipeline has and your machine does not?
★★★ Remove the parallelsAlwaysFailFast() line from the Jenkinsfile and run the same broken commit again. How long did the web branch take this time, and was Publish skipped again?
In the next post we will focus on what the publish stage produces: building an artifact once and carrying the same one to every environment, stamping versions, and why building the same commit twice does not produce the same package.