

Deploy vs Release: Why Downtime Happens and a Map of Deployment Strategies
A deploy installs code in an environment, a release is when users see the new behavior; teams that can separate the two split the risk. In a single-container recreate deploy behind Nginx, 12 requests failed within 2.5 seconds. The five sources of downtime, a map of recreate, rolling, blue-green, canary, shadow, A/B and feature flags, a decision table, and the risk = blast radius × detection time calculation.
Version note: The examples in this post were run with .NET 10 (SDK 10.0.402), Nginx 1.30 and Docker 29.
Guess First
The Bookstore API (Application Programming Interface) runs as a single container behind Nginx. You ship the new version the simplest way: stop the old container, remove it, start the new one. The app is a small .NET 10 minimal API that starts in under a second. If ten requests per second arrive during this deploy, for how many seconds do users see errors? Zero, one, five?
The second question is more conceptual. The code for the new "one-click checkout" feature went to production today, but the feature is turned off with a flag. Would you say you "deployed" the feature or "released" it? Write both answers down. We'll measure the first one shortly; the second is the main idea of the whole series.
Deploy and Release Are Not the Same Thing
In everyday talk the two are used interchangeably, but separating them clarifies a lot. A deploy is new code being installed in an environment and running: a new image becoming a container, new files copied to a server, a migration being applied. A release is users starting to see the new behavior. In most teams both happen at the same moment, because user traffic goes to the new code as soon as it runs. That's a choice, though, not a necessity.
When you can separate deploy and release, risk splits into two parts. The deploy's risk is technical: does the process start, is the config right, does it reach the database? The release's risk is behavioral: does the new feature calculate correctly, do users understand it, what happens under load? Blue-green does the deploy a few minutes before the release and runs a smoke test in between. Canary limits the release to a small share of users. A feature flag does the deploy days ahead and reduces the release to a config change. That's also the answer to the second opening question: a feature behind a disabled flag has been deployed but not released.
Measuring the Cost of Recreate
Let's start with the simplest strategy, recreate: stop the old version, start the new one. There's one API container behind Nginx:
events {}

http {
    resolver 127.0.0.11 valid=1s ipv6=off;

    upstream bookstore_api {
        zone bookstore_api 64k;
        server depwork-api:8080 resolve;
    }

    server {
        listen 80;
        location / {
            proxy_pass http://bookstore_api;
        }
    }
}
The resolve parameter lets Nginx learn the new IP (Internet Protocol) address of a recreated container within a second. The deploy script is just this:
#!/usr/bin/env bash
# recreate.sh VERSION: stop the old container, then start the new one
set -euo pipefail
docker stop depwork-api >/dev/null
docker rm depwork-api >/dev/null
docker run -d --name depwork-api --network depwork-net "depwork-bookstore-api:$1" >/dev/null
echo "$(date +%H:%M:%S) deployed $1"
To see what happens during the deploy, we use a probe that sends a request every 100 milliseconds and groups the results per second. We'll use this script throughout the series:
#!/usr/bin/env bash
# probe.sh URL SECONDS [METHOD]: send one request every 100 ms, group results per second
url=$1
end=$((SECONDS + $2))
method=${3:-GET}
while [ $SECONDS -lt $end ]; do
    printf '%s ' "$(date +%H:%M:%S)"
    curl -s -o /dev/null -m 1 -X "$method" -w '%{http_code} %header{x-app-version}\n' "$url"
    sleep 0.1
done | sort | uniq -c
curl's -m 1 setting aborts the request if no response arrives within a second and prints the code as 000. %header{x-app-version} reads the version header the app adds to every response. We start the deploy while the probe is running:
(./tools/probe.sh http://localhost:18604/api/books 8 > recreate.txt) &
sleep 2.5; ./lab01/recreate.sh 1.1.0; wait; cat recreate.txt
07:25:15 deployed 1.1.0
2 07:25:11 200 1.0.0
8 07:25:12 200 1.0.0
8 07:25:13 200 1.0.0
1 07:25:14 000
3 07:25:14 200 1.0.0
1 07:25:14 502
3 07:25:15 502
1 07:25:16 200 1.1.0
7 07:25:16 502
8 07:25:17 200 1.1.0
8 07:25:18 200 1.1.0The lines are easy to read: each one shows how many requests in that second came back with which code and from which version. At 07:25:14 one request got no answer within a second, then Nginx started returning 502 Bad Gateway. At 07:25:16 the new version gave its first response. For about two and a half seconds most incoming requests failed: 12 requests in total.
Two and a half seconds may look small, but it was measured on this machine for an app that starts in under a second and doesn't even connect to a database. A real Bookstore checks migrations, warms up the connection pool, fills caches and does JIT (Just-In-Time) compilation on startup. Those easily push the window to somewhere between 10 and 60 seconds. On a system receiving ten requests per second that's 100 to 600 failed requests, and any of them could be a payment, an add-to-cart or a login.
Where Does Downtime Come From?
The source of the outage in recreate is obvious: for a while there is no running instance at all. But zero-downtime strategies have outages too, because their sources are subtler. Knowing these five makes it easier to understand why we do what we do in the following posts.
1. Process Restart
If the old process doesn't finish its requests while shutting down, or the load balancer keeps sending requests to a stopping instance, users see dropped connections. The fixes are graceful shutdown and connection draining; we measure both in the second post of the series.
2. Cold Start
A new process isn't ready the moment it starts. The first three requests to the same container:
for i in 1 2 3; do
    curl -s -o /dev/null -w "books #$i %{http_code} %{time_total}s\n" localhost:18600/api/books
done
books #1 200 0.015302s
books #2 200 0.001436s
books #3 200 0.000845sThe first request is ten times slower than the second and eighteen times slower than the third. The difference comes from JIT compilation, assemblies loaded for the first time and first connections. Here we're talking about milliseconds, but in a large app the first requests take seconds, and if all traffic is routed to the new instance the moment it starts, timeouts begin. The fix is readiness: an instance should take no traffic until it says it's ready.
3. Schema Incompatibility
If the new version renamed a column, the old version's queries fail the moment the migration runs. The same happens if the new version isn't running yet or you rolled back. This is a data change problem, not a strategy problem; no amount of traffic management fixes it. The sixth post of the series is entirely about it: expand-contract.
4. Cache and Session Loss
Sessions, carts or ASP.NET Core Data Protection keys kept in an instance's memory are lost when the instance changes. Users don't see an error page, but they get logged out, their cart empties, or their form is rejected with an "antiforgery token" error. Because these don't show up as 500s in the logs, they are the outages noticed last.
5. Half-Finished Deploy
Three of five servers were updated, the disk filled up on the fourth and the script stopped. Or the first step of a migration was applied and the second failed. The system is now neither on the old version nor on the new one, and nobody knows which combination was tested. The remedy for half-finished deploys is to make every step reversible or safely re-runnable (idempotent) and to report clearly where the deploy stopped.
A Map of Strategies
There are different ways to avoid or shrink the outage. The figure below shows how traffic is shared between the old and new versions over time in the most common strategies.
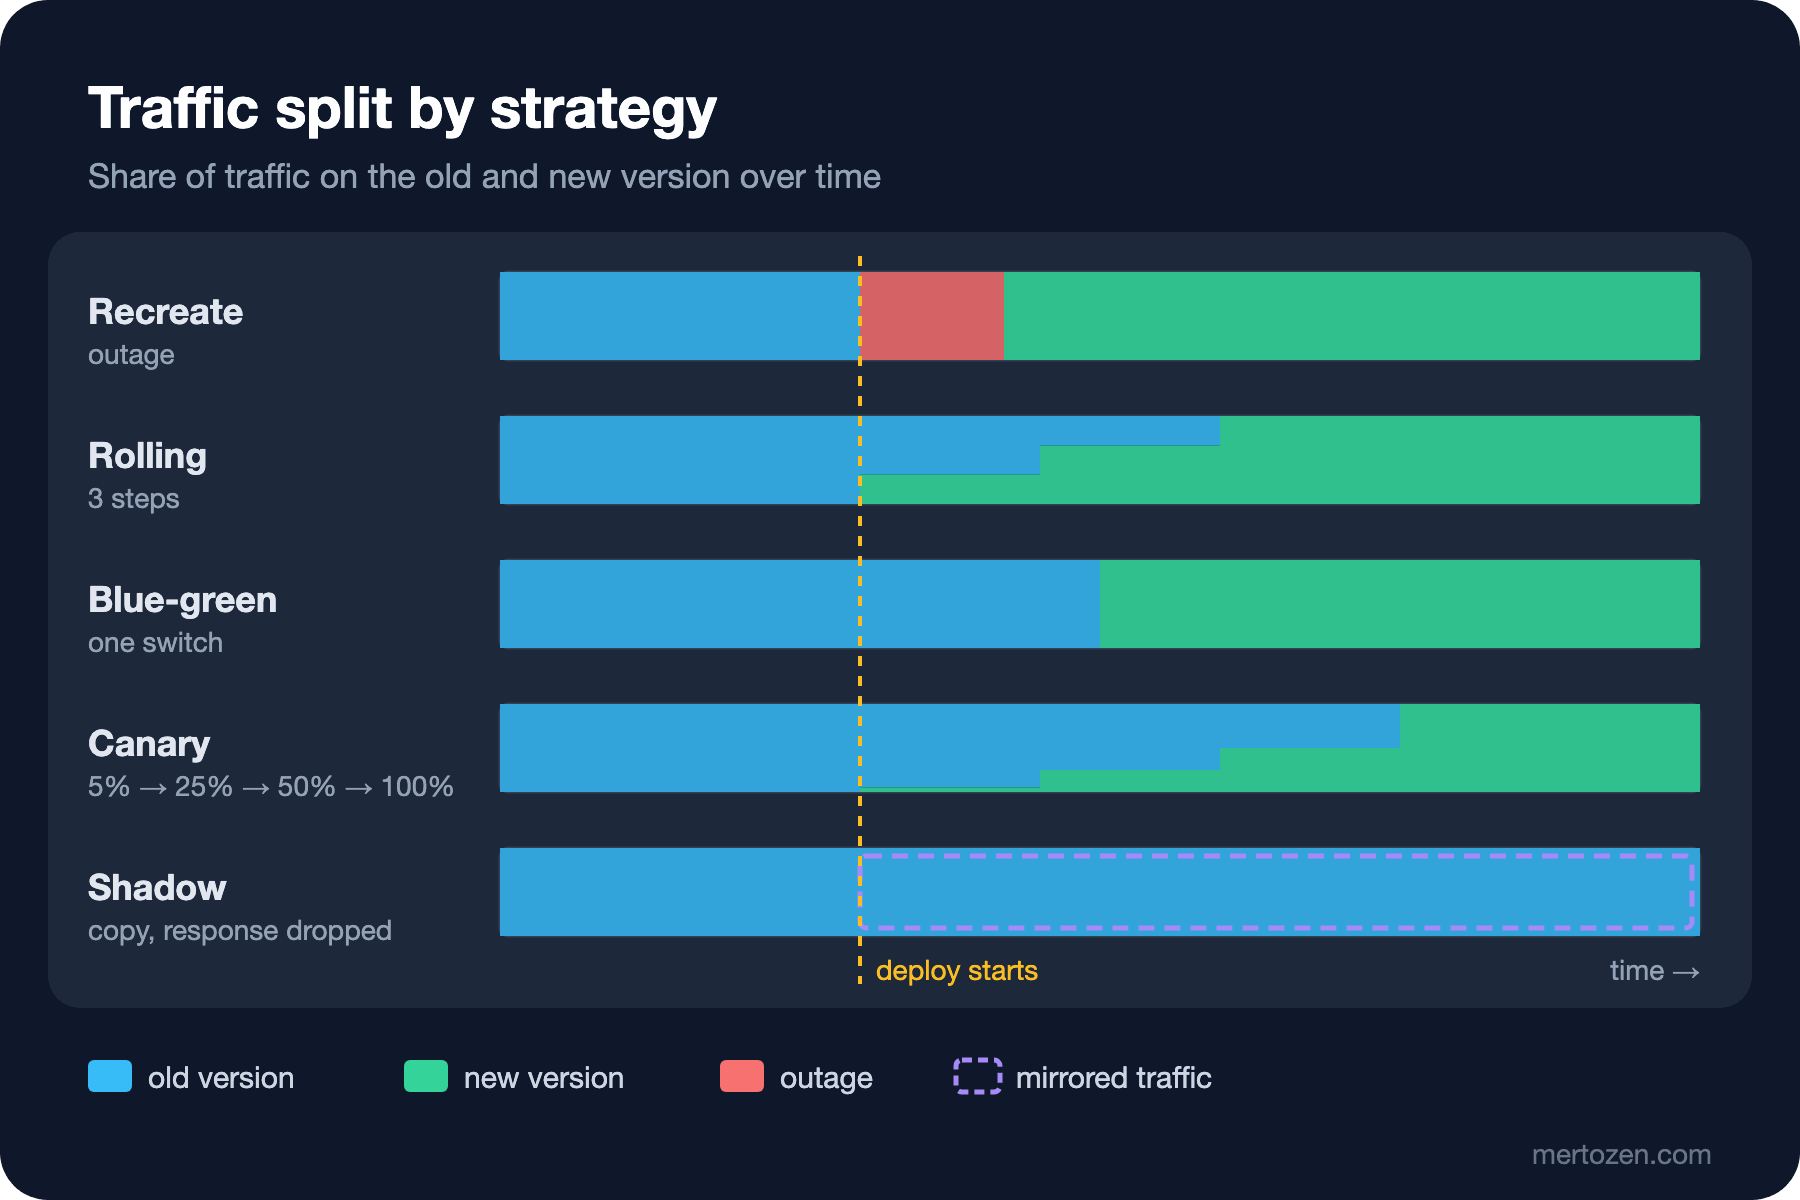
Recreate stops the old version and starts the new one. There's an outage in between, but the system never runs two versions together. It's still a valid choice for single-instance internal tools, systems deployed in a nightly maintenance window, and cases where two versions can't live side by side.
Rolling updates instances one at a time. It needs no extra infrastructure, but two versions run together for the whole deploy and rolling back is just as slow. It's Kubernetes' default. The topic of the third post.
Blue-green brings the new version fully up in a separate environment, tests it and switches traffic in one move. Switching back is also a single move. The cost is double capacity for a while and two environments sharing the same database. Martin Fowler popularized the name in his 2010 "BlueGreenDeployment" article. The topic of the fourth post.
Canary gives a small percentage of traffic to the new version, looks at metrics and raises the percentage if nothing is wrong. It limits risk by the number of users, but deciding requires metrics and patience. The topic of the fifth post.
Shadow (dark launch) sends a copy of real traffic to the new version but never shows its response to users. You see performance and errors under real load without affecting users. Endpoints that write need care, because a copied order request can create the order twice.
A/B testing is a product experiment, not a technical one. It splits two behaviors across user groups and measures which one moves a business metric (conversion, basket size) more. Its infrastructure resembles canary, but the goal differs: canary asks "is the new version broken?", A/B testing asks "which one is better?".
A feature flag manages behavior rather than traffic. The code is deployed and the behavior is turned on and off with a flag. It's the tool that separates deploy from release most cleanly, and it's used together with the other strategies. The topic of the seventh post.
A Decision Table
Picking a strategy comes down to four questions: how much extra infrastructure do I need, how fast can I go back when something breaks, how long do two versions run side by side, and must database changes be backward compatible?
| Strategy | Extra infrastructure | Rollback speed | Mixed-version window | Backward-compatible schema required? |
|---|---|---|---|---|
| Recreate | None | As slow as a redeploy, with an outage again | None | No, but the outage is accepted |
| Rolling | None or one instance | Slow, a rolling deploy in reverse | The whole deploy | Yes |
| Blue-green | A second full environment | Seconds, one switch | Only the switch moment and long connections | Yes, both environments use the same database |
| Canary | A load balancer that can split traffic, metrics | Fast, set the canary to zero | Hours or days | Yes |
| Shadow | Traffic mirroring, separate resources | Not needed, users don't see it | None, users see one version | Writes need separate data |
| Feature flag | Flag infrastructure | Seconds, turn the flag off | The code is always one version | A flag can't hide the schema, so yes |
The most important column is the last one. Every strategy except recreate requires old and new code to work against the same database for a while. That's why a team without migration discipline keeps having outages at deploy time, whichever strategy it picks.
Risk = Blast Radius × Detection Time
The most useful way to compare strategies is to think about how many users a bug touches and for how long. Blast radius is the share of traffic the faulty version sees; detection time is the time until you notice the bug and send traffic back. Their product gives the number of affected requests.
A simple calculation: a system receives 10,000 requests per minute, a bug breaks 5% of requests, and the team notices and reverts it in five minutes. With recreate or a full switch, the new version takes all traffic: 5 minutes × 10,000 × 5% = 2,500 failed requests. If the same bug ships in a 5% canary, the new version sees only one twentieth of the traffic and the result is 125 failed requests. If automated metric analysis cuts detection time to one minute, that drops to 25.
This calculation teaches two things. First, shrinking blast radius (canary, user targeting with feature flags) and shortening detection time (metrics, alerts, automated rollback) don't substitute for each other; they multiply. Both need investment. Second, rollback speed is part of detection time: if you see the bug in one minute but the rollback takes ten, your detection time is really eleven minutes. That's exactly where blue-green earns its keep.
In Production
Measure the deploy as an event. For every deploy, record start and end times, the 5xx count in the deploy window, the error rate in the new version's first 15 minutes, and whether a rollback happened. These are the raw data for two of DORA's (DevOps Research and Assessment) five metrics, change fail rate and failed deployment recovery time. We'll cover them together with the rollback decision in the eighth post of the series.
Try to make deploys boring. Rare, large deploys get riskier each time, because the bigger the change, the larger both the blast radius and the time to find the bug. With small, frequent deploys, choosing a strategy gets easier too.
Common Pitfalls
- Treating deploy and release as the same thing. Then every deploy is a release and all the risk piles up in a single moment.
- Saying "we use Kubernetes, so there's no outage". Kubernetes does rolling deploys, but if the app doesn't implement graceful shutdown and readiness correctly, rolling produces outages too.
- Picking a strategy and forgetting the database. A team that switches traffic in a second with blue-green but runs a migration that drops a column in the same deploy closes its own rollback path.
- Never testing the rollback. In many plans that say "we'll switch back to blue" on paper, the blue environment has long been shut down or the old version's config deleted.
- Assuming production behaves like staging because it was tested there. Staging has none of production's traffic, data volume or long-lived connections, and that difference is exactly where a strategy proves its worth.
A Small Experiment
★☆☆ Repeat the recreate experiment above, starting the container with -e WARMUP_SECONDS=5. This setting delays Bookstore's readiness by five seconds, but Nginx doesn't look at readiness. Does the error window change, and why?
★★☆ Run probe.sh against a GET and a POST endpoint at the same time and compare their error counts during a recreate. If they differ, look for the reason in Nginx's proxy_next_upstream documentation.
★★★ Pull the last three months of deploys from your own system and do the "blast radius × detection time" calculation for each. In the most expensive incident, which strategy would have shrunk that product the most?
Whichever strategy you choose, the same prerequisites sit underneath: an app that finishes its work when shutting down, tells the truth about being ready, and behaves the same regardless of which instance it runs on. In the next post we measure these prerequisites one by one: graceful shutdown, readiness, being stateless, backward compatibility and Angular's old chunks.